The research on engine stable frame report parsing of Boeing 747-400 by QAR data
2015-10-29HongchunQUYuanqiangHUANGXingchuanZHANG
Hong-chun QU, Yuan-qiang HUANG, Xing-chuan ZHANG
(College of Aeronautical Engineering, Civil Aviation University of China, Tianjin 300300, China)
The research on engine stable frame report parsing of Boeing 747-400 by QAR data
Hong-chun QU*, Yuan-qiang HUANG, Xing-chuan ZHANG
(CollegeofAeronauticalEngineering,CivilAviationUniversityofChina,Tianjin300300,China)
In order to fully tap the vast amount of the raw monitoring data in QAR, verify the reliability of ACARS messages and further assist the research in condition monitoring and fault diagnosis of aircraft and engine, the structure of the engine stable frame report has been researched and a method about extracting DFD report from its QAR data to meet the triggering conditions has been proposed, which have greatly enriched the engine performance monitoring data. The reliability of the method has been verified through computational analyzing both the actual ACARS reports and the extracted data of a B747-400 airplane. The result shows that this method has great prospects in engineering application.
QAR data mining, ACARS report parsing, Engine stable frame report, DFD report structure, Boeing 747-400
10.3969/j.issn.1001-3881.2015.24.004 Document code: A
V233
1 Introduction
QAR (quick access recorder) is an airborne data recording equipment which records exactly the operation parameters of each system every other second. The amount of data is very large and can reflect the actual operating status of each system continuously and completely during the entire range. The data can be copied or download through WQAR (wireless quick access recorder) by the engineer and, it has provided the most important data support for the airplane performance analysis, important system condition monitoring and fault diagnosis [1-3].
ACARS (aircraft communication addressing and reporting system) is developed by ARINC (aeronautical radio incorporated) and is now widely used as a common addressable air-to-ground data communication network in international civil aviation. It transfers and exchanges message with ground data center automatically through airplane airborne equipment in the form of digital telegram and is mainly used by airlines to monitor the aircraft’s operating status in real-time [4]. After receiving airplane raw messages or reports, the ground data center needs to interpret the data, precondition, decode and check process, then generate readable report and send to the airlines. To ensure the accuracy and completeness of message transmission, the ground data center generally performs cyclical redundancy check [5]. However, due to objective factors, such as communication network transfer error, burst signal interference, human caused error and equipment failure, it’s often inevitable that the message contents error code is missing or unrecognizable. At the same time, the amount of data and airplane parameters contained in ACARS is limited by the air-to-ground data transmission technology. Moreover, because of OEM (original equipment manufacturer) technology blockade and lack of independent innovation capability, our airlines can only pay a high cost to buy part of the ACARS messages or report data to monitor the operating status of aircraft. This situation is unable to meet the in-depth research needs on airplane and engine condition monitoring of the airlines.
Currently, the airlines rely mainly on the combination of ACARS reports and QAR data to carry out engine condition monitoring and fault diagnosis [1, 6]. One of the most important engine monitoring reports is engine stable frame report, called as DFD, which is acquired in cruise stage and during each flight only 2 DFDs are generated [7]. If engine monitoring reports meeting trigger conditions can be extracted from QAR data, we can not only take great advantage of large amounts of raw monitoring data contained in QAR data, to enrich greatly the steady-state report information and, assist the airlines to study aircraft and engine status monitoring and fault diagnosis, but also discover the ACMS (aircraft condition monitoring system) failures, test the reliability of ACARS reports, improve the aircraft safety and reliability through comparison with the ACARS downlink packet data. This paper, taking a Boeing 747-400 aircraft for example, studies extraction of the engine stable frame report which meets the trigger requirements from QAR data, other types of report messages can also be obtained in this way.
2 The extraction logic of engine stable frame report and its analysis
The airplane’s ACARS reports have more than 110 varieties, in the application aspect can be divided into AOC (airplane operational control) reports which are for airlines’ operational management and ATS (air traffic service) reports which are used for air traffic control and service [4]. The engine stable frame report is just one of the numerous AOC reports.
2.1 The extraction logic of DFD report
Take the B747-400 fleet of a certain airline as an example, which was installed the PW4056 engine selectively. The OEM demands that search for the engine stable condition shall start upon entry to the ER mode, until stable conditions have been detected or until end of the ER mode. During each flight only 2 engine stable frame reports shall be generated and down linked. The first one as soon as any category stability is met, the second one is from the last stable condition met in the ER mode [7], as shown in the following logical judgment.
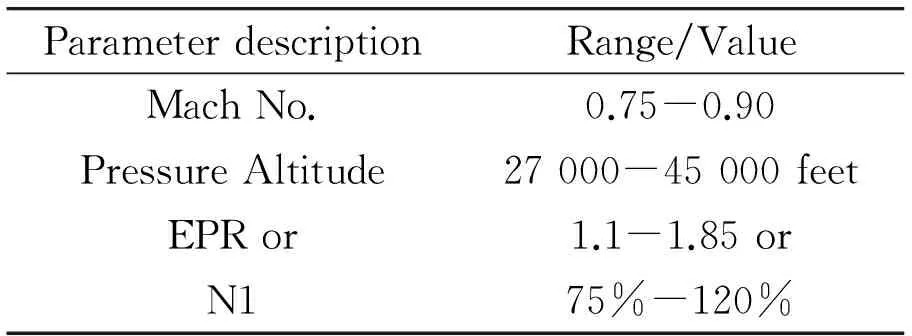
Step 1. When the engine conditions defined in Table1 that are met for 3 minute continually, go to Step 2. If an initial condition is not met, the search for it restarts at the beginning of the next 1 second period. The stable condition search shall be continued, but the stable search period timer will be decremented by 1, until an acceptable set of stable parameters has been obtained for the entire stable condition search period [7].
Table 1 Engine stability monitoring initial conditions
ParameterdescriptionRange/ValueMachNo.0.75-0.90PressureAltitude27000-45000feetEPRor1.1-1.85orN175%-120%
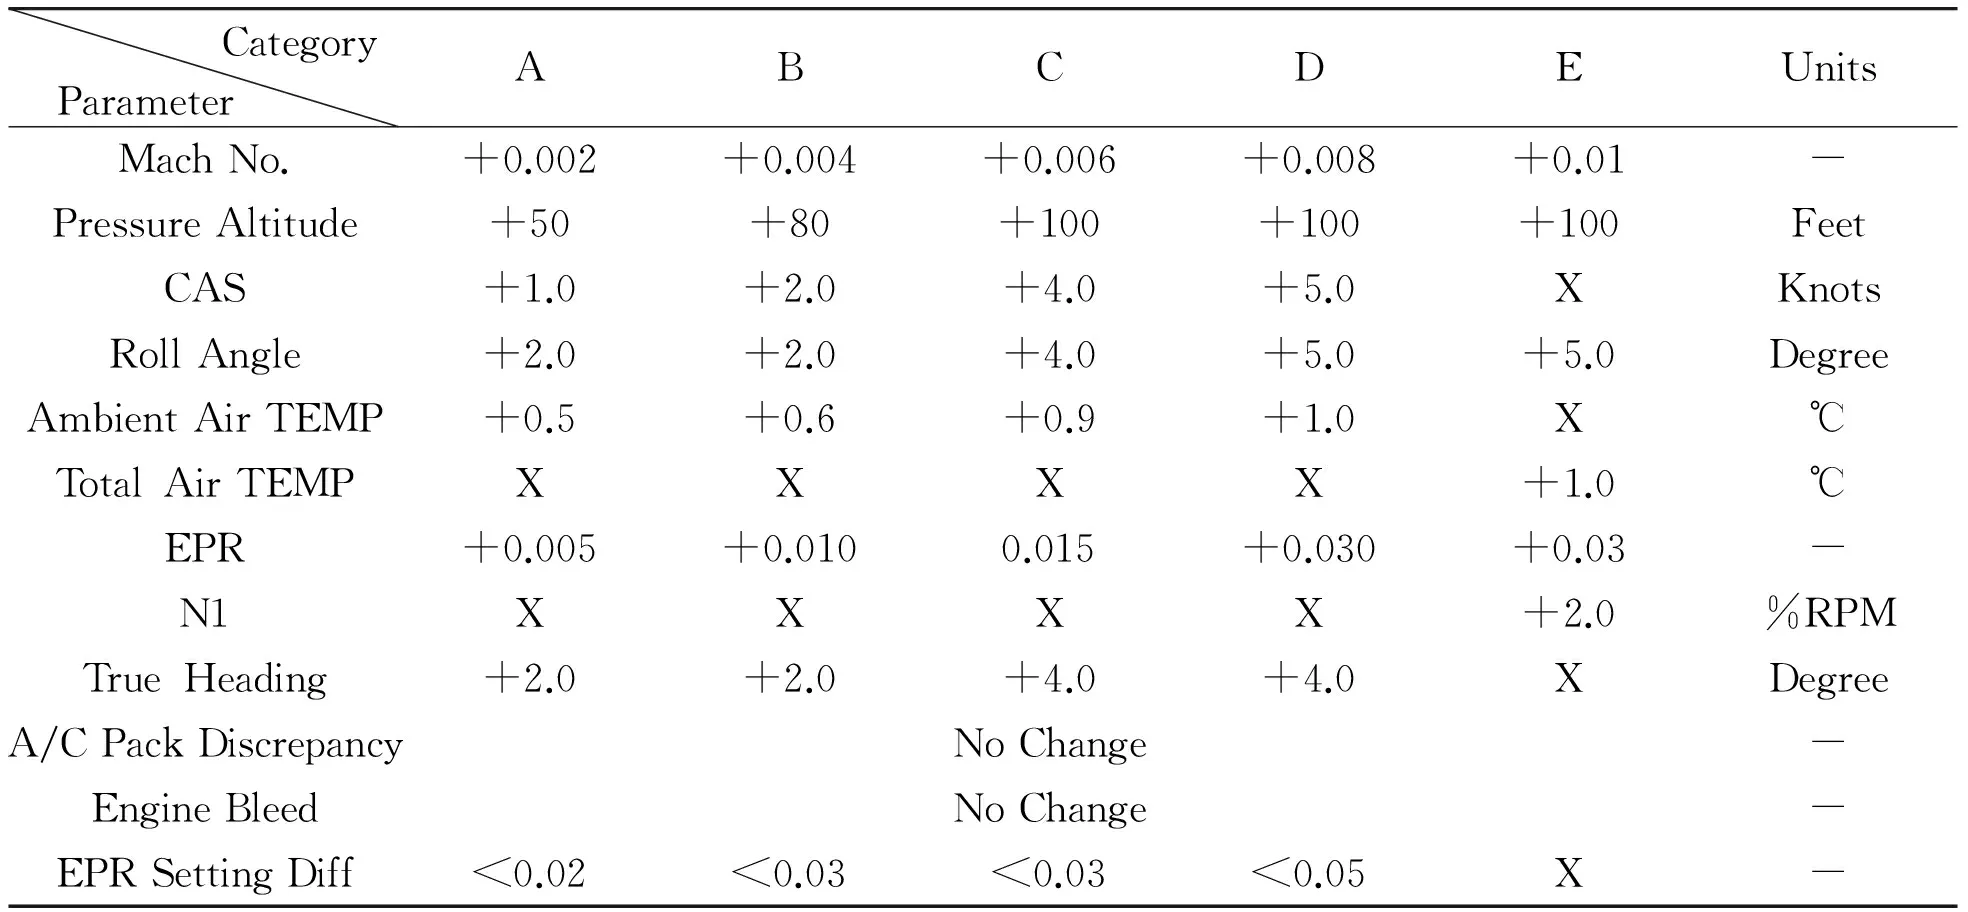
Step 2. When engine stable conditions have been detected, Min and Max values are saved for each of the engine stability parameters and compared against their respective TB (tolerance band) category shown in Table 2 during the initial 3 minute stability monitoring period. In each subsequent second a new set of Min and Max values shall be developed as new values are received and the oldest values are discarded. If the minimum to maximum spread for each stable parameter is less than its corresponding TB over the entire 3 minute stability monitoring period, the parameters averaged values of last 20 seconds, including the associated quality letter corresponding to the best tolerance category found, shall be stored in NVM (non-volatile memory). At this time a 1 hour “rest period” shall be initiated. No further search for engine stability shall take place during the rest period. But if a given stable parameter falls outside of its associated TB prior to the end of the monitoring period, this process shall be stopped, go back to STEP 1 and the stable search period timer will be decremented by 1 [7].
Step 3. At the end of the 1 hour “rest period”, the stable condition monitoring as described in step 1 and step 2 shall be repeated until end of the ER mode. At this point, the averaged values for the engine stable frame report are stored in a temporary buffer (does not overwrite the first engine stable frame report data in NVM) but no report is generated and a new 1 hour “rest period” initiated. The next search for engine stable conditions will not begin until the rest period has elapsed. Each subsequent detection of engine stability results in previously stored data in the temporary buffer being overwritten by the new data, regardless of the previously stored data’s category level. The process described above is continued while in the ER mode. When the flight mode changed the last engine stable condition data stored in temporary buffer shall be used to generate an engine stable frame report and stored in NVM [7].
In Table.1, EPR represents engine pressure ratio; N1 (low pressure rotor speed) is used as an alternate initial condition only when an engine for which is no valid EPR on any bus. In Table 2, category “E” is minimum acceptable stability tolerance for engine stable condition monitoring. The “+” associated with each of the tolerance parameters represents a min/max range (equal to twice the value) defining the amount of change a parameter may undergo and remain in the tolerance band. “X” means the parameter is not used as search criteria.
Table 2 Engine stable condition tolerance category
CategoryParameterABCDEUnitsMachNo.+0.002+0.004+0.006+0.008+0.01-PressureAltitude+50+80+100+100+100FeetCAS+1.0+2.0+4.0+5.0XKnotsRollAngle+2.0+2.0+4.0+5.0+5.0DegreeAmbientAirTEMP+0.5+0.6+0.9+1.0X℃TotalAirTEMPXXXX+1.0℃EPR+0.005+0.0100.015+0.030+0.03-N1XXXX+2.0%RPMTrueHeading+2.0+2.0+4.0+4.0XDegreeA/CPackDiscrepancyNoChange-EngineBleedNoChange-EPRSettingDiff<0.02<0.03<0.03<0.05X-
2.2 DFD report structure parsing
Take a certain fleet for example, the typical format of engine stable frame report is shown in Fig.1. The abbreviations of parameters in Fig.1 (a) could be referred to the professional aviation dictionary or Boeing manuals and the airlines could choose which parameters to be generated in the report depending on their demands.
The code “DFD” in the first line means that it is the report of engine cruise stable frame report; the information of airplane flight number, aircraft identification number and departure airport codes can be obtained in the second and third lines; line 4 shows the MACH, airspeed, flight altitude and total air temperature and other important parameters when the engine extracts the report information; there are four engines in Boeing 747 airplane which numbered 1 to 4 from left to right and line 5 to line 7 show the monitoring parameter data of engine No.1. The format of monitoring parameters of other engines is the same as the engine No.1. The whole content of DFD is shown in Fig.1 (b), which is not duplicated in Fig.1 (a).
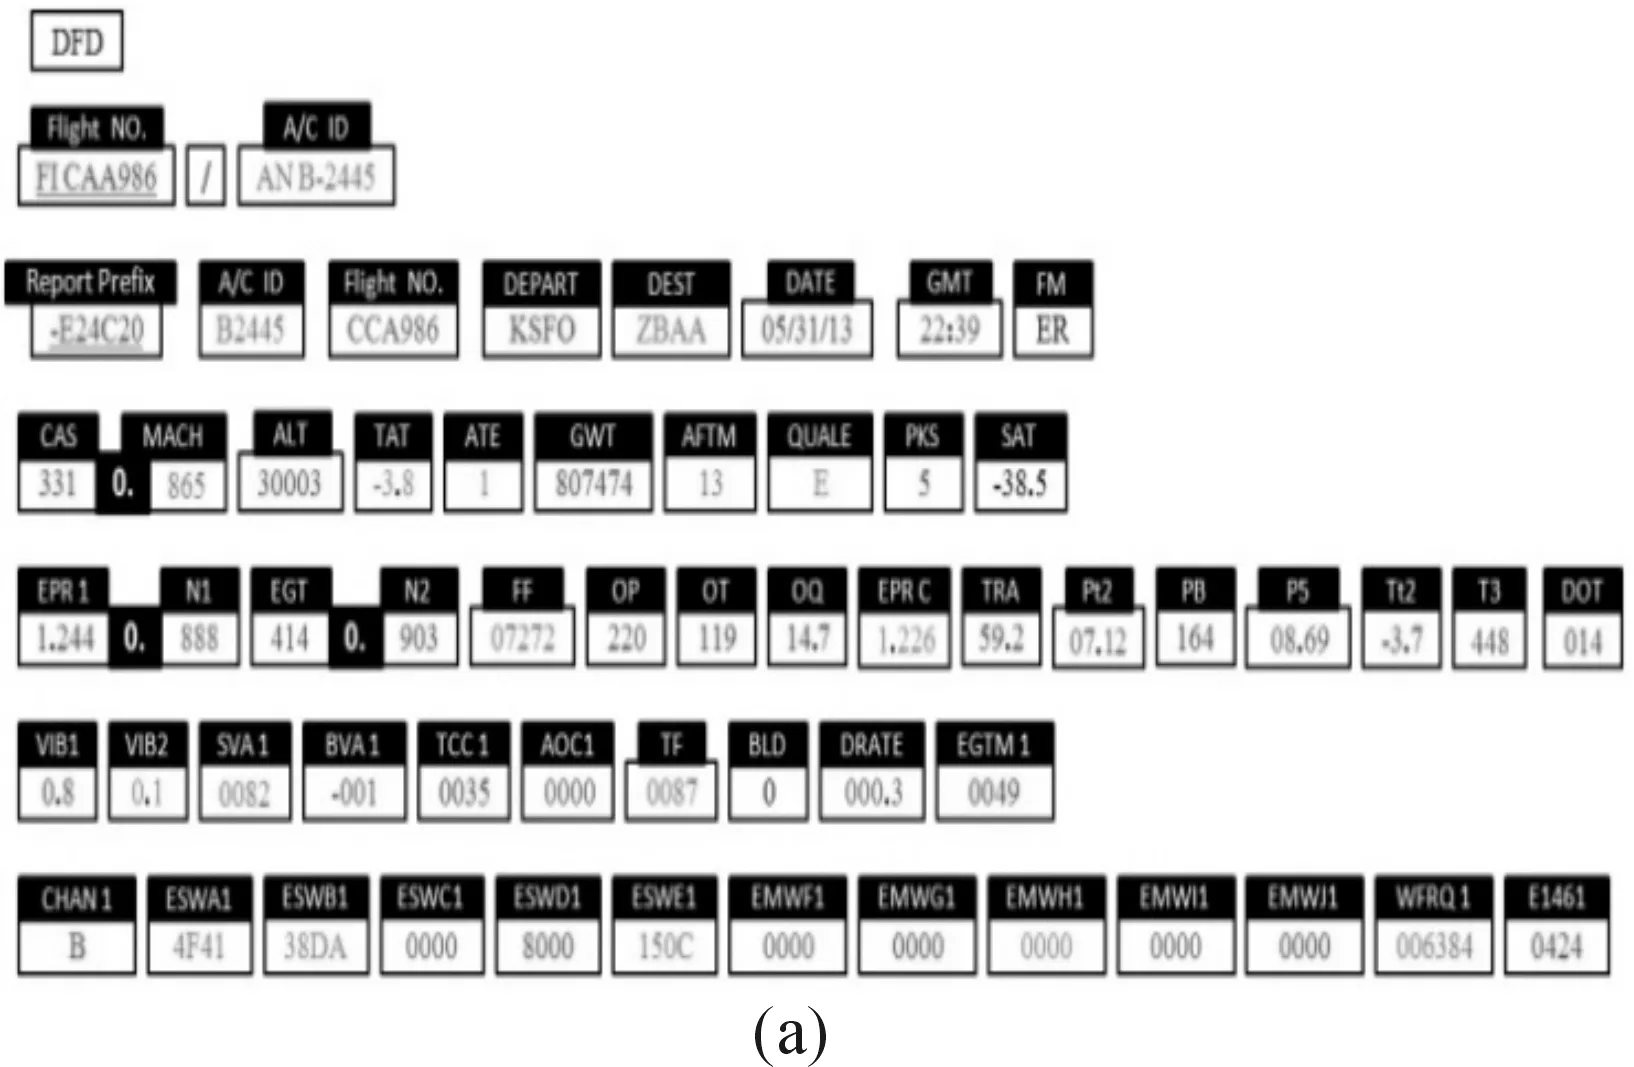
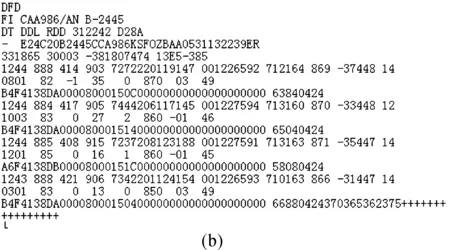
Fig.1 The typical format of DFD
2.3ThegenerationlogicofDFDreportbasisonQAR
The flowchart of the calculation algorithm which is designed to extract the stable frame report from QAR data according to the extraction logic shown in Fig.2, and the MATLAB code is translated accordingly. The reliability of the algorithm principle could be verified by comparing the two actual ACARS reports with the generated report data. In fact, only two ACARS reports data could be downloaded from each flight. However, the reports extracted from QAR data could not only cover any phase of the flight but also could restore ACARS reports data and verify the reliability of ACARS reports according to the historical QAR data.
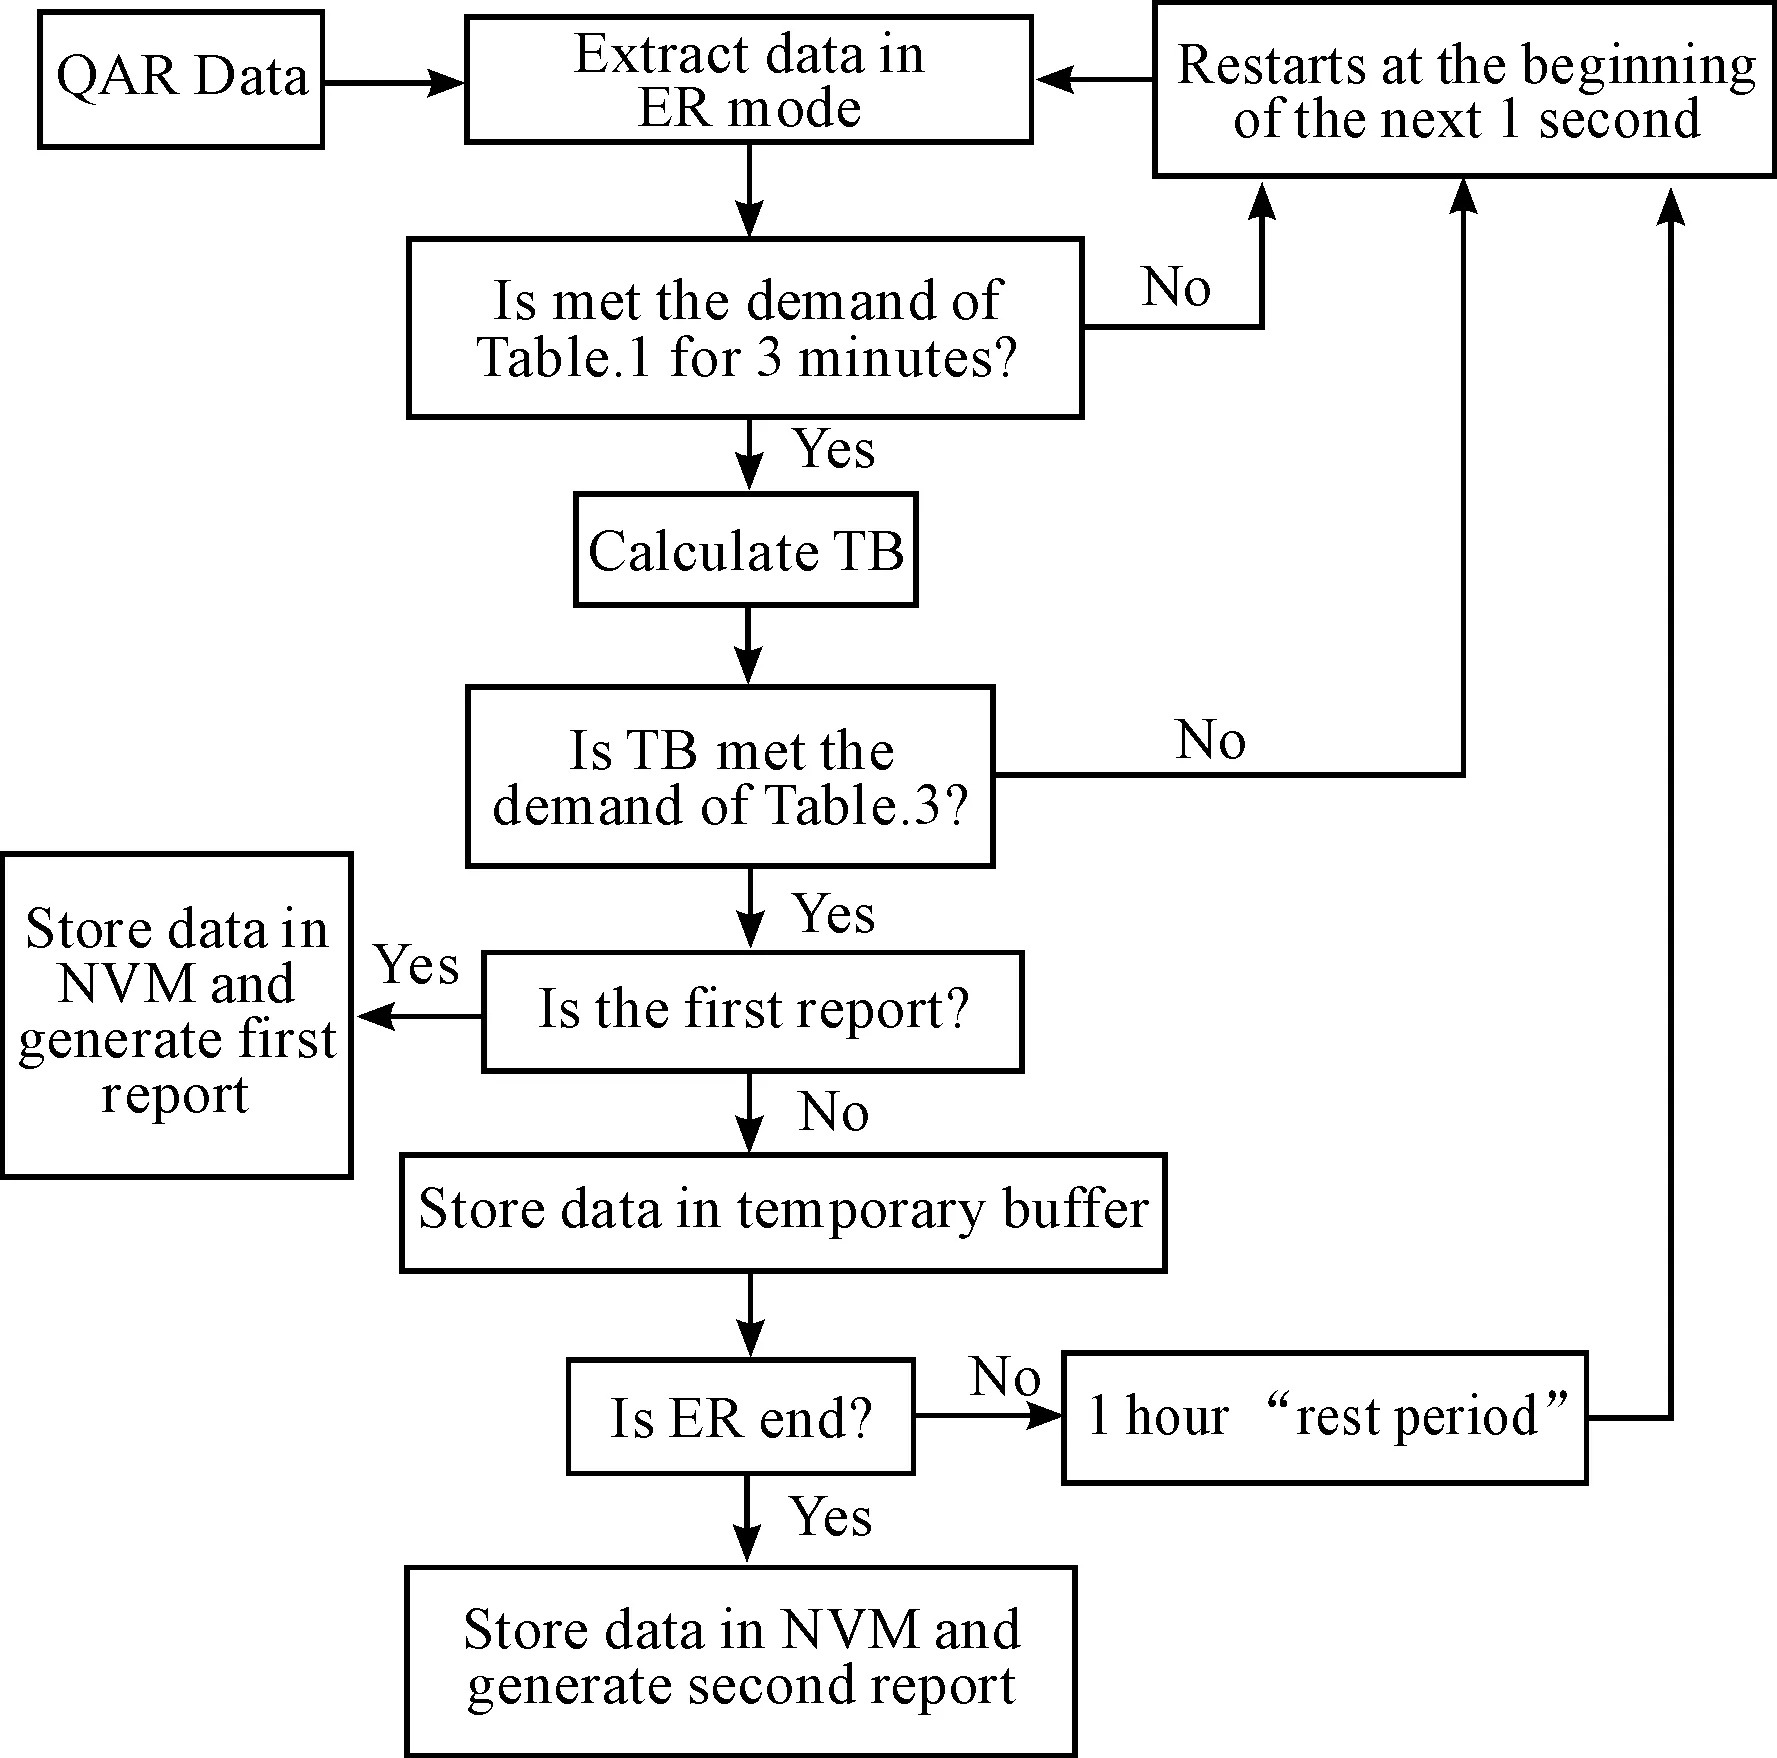
Fig.2 The generation logic of frame report from QAR data
3 Application examples
3.1 Reliability and accuracy test
Take a Boeing 747-400 for example, collecting 20 QAR data and its corresponding two ACARS engine cruise reports, part of the QAR parameter data and ACARS report are shown in Table 3 and Fig.1 (b). The symbol “///” in Table 3 means the sensor has shut down.
The flight mode of airplane could be simulated and recovered by QAR data, Fig.3 illustrates that how the ALT, TAT and CAS vary with the flight time and it is clear to see when the airplane starts to cruise, when to climb and how the parameters vary with others in the whole range.
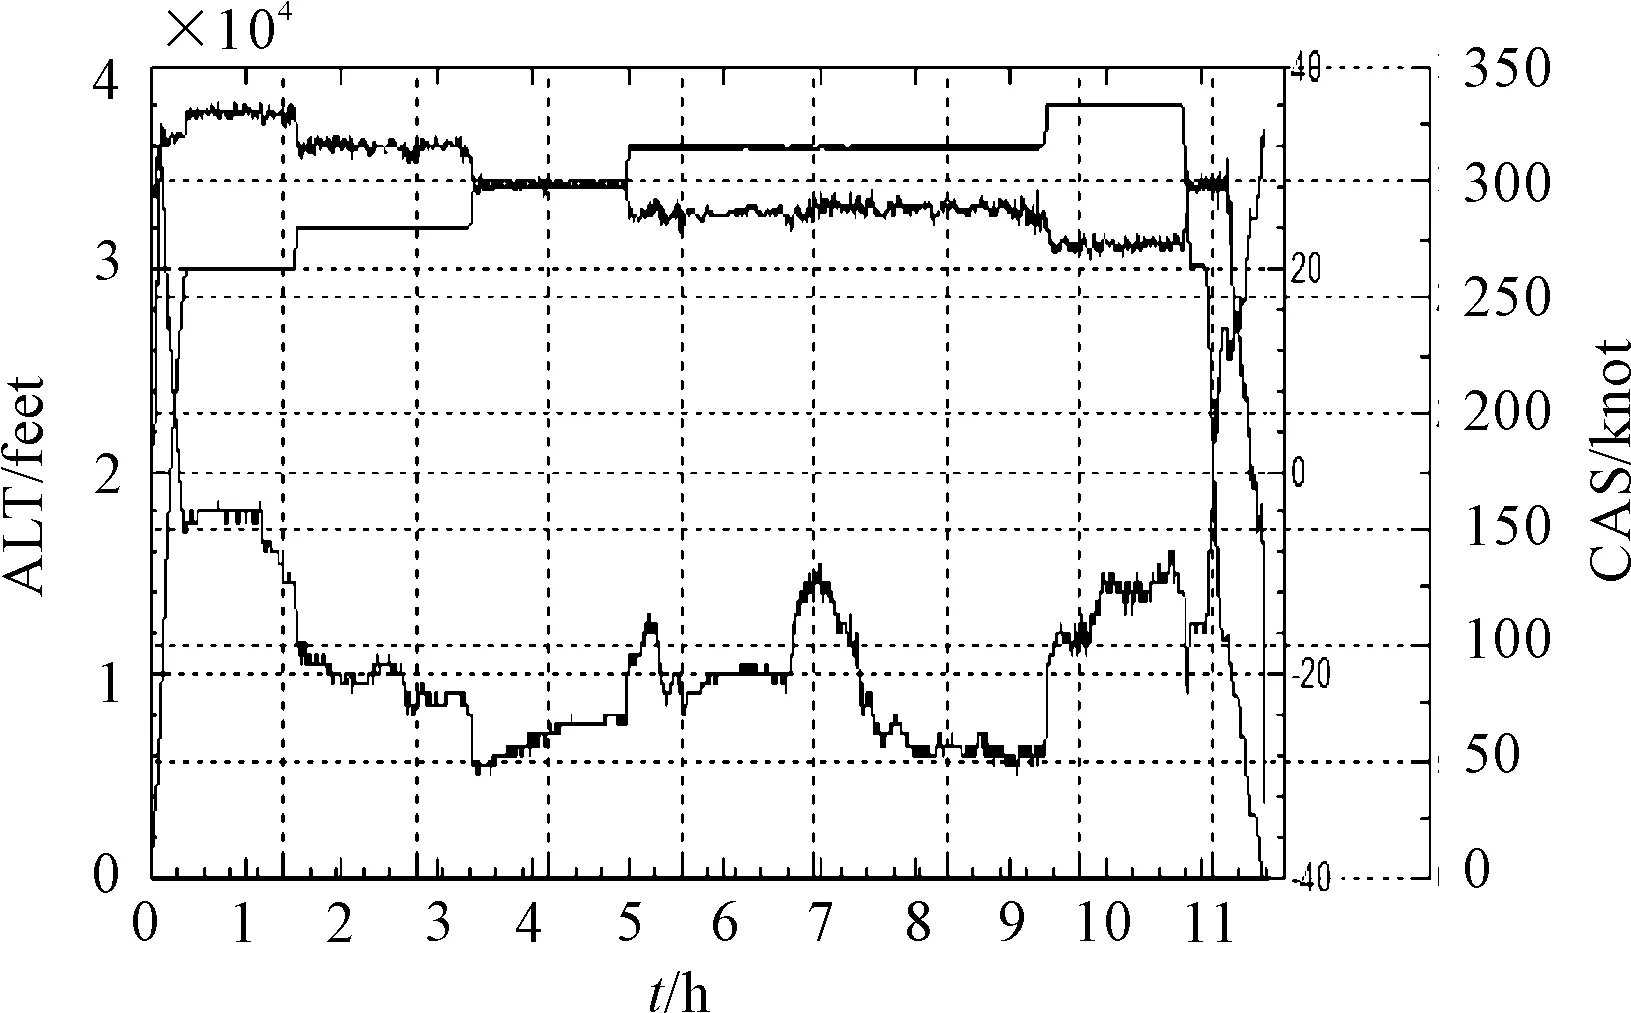
Fig.3 The ALT, TAT and CAS changes with the flight time
Table 3 Part of QAR data
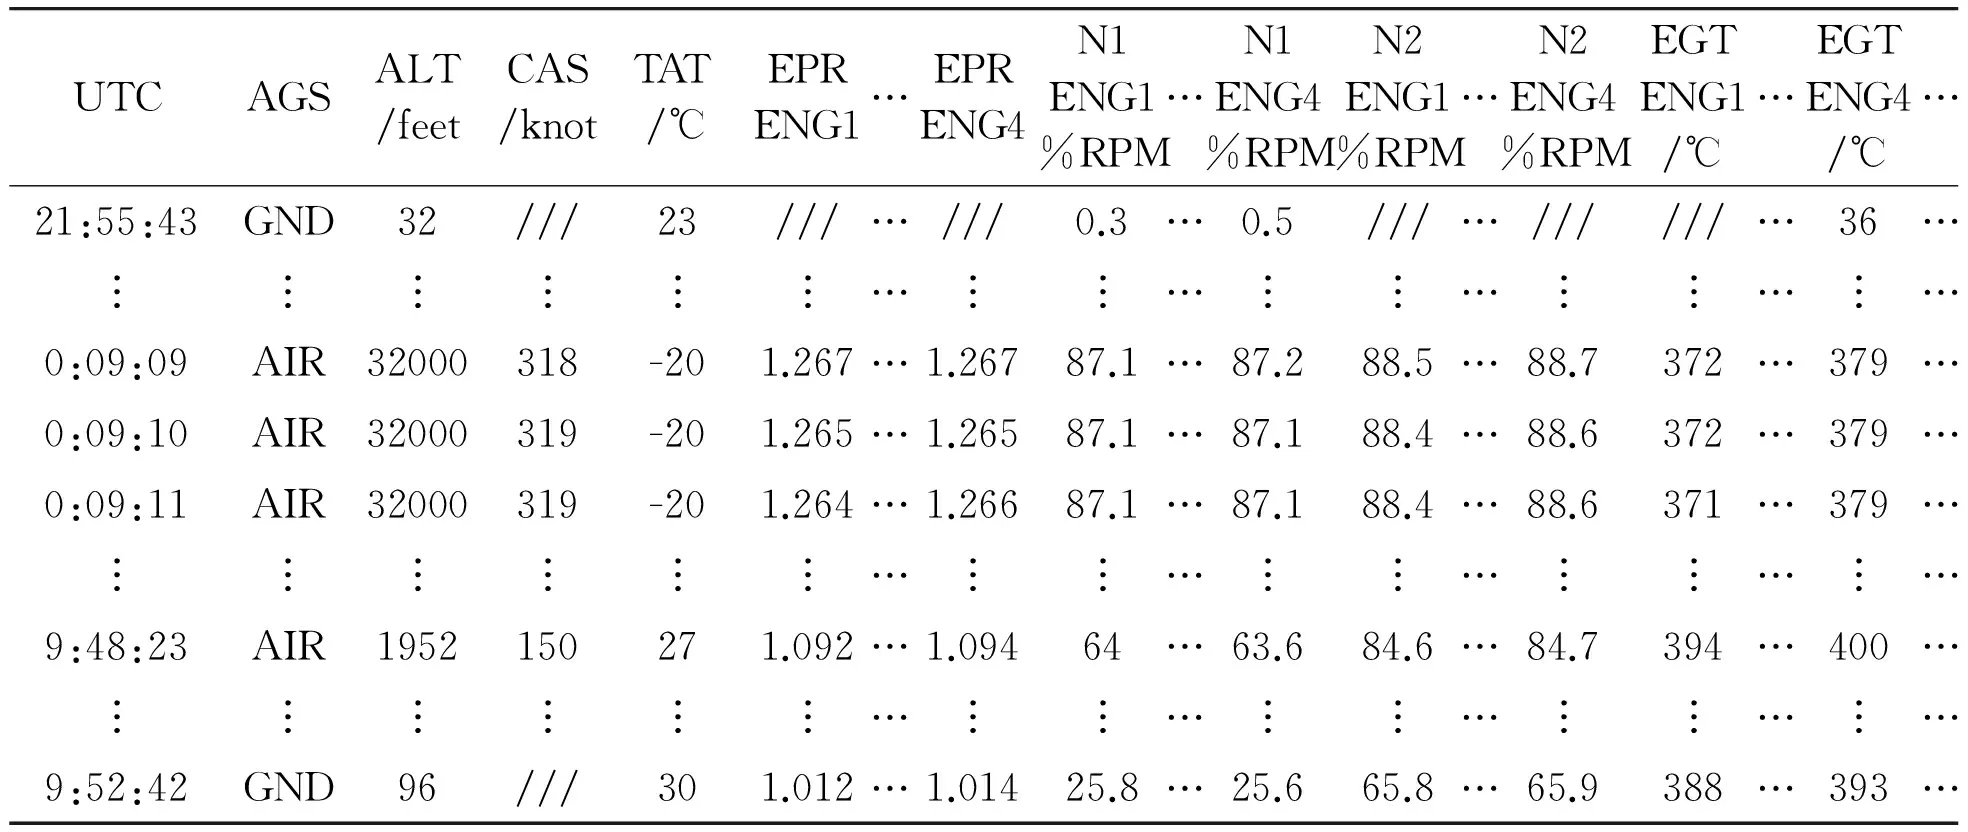
UTCAGSALT/feetCAS/knotTAT/℃EPRENG1…EPRENG4N1ENG1%RPM…N1ENG4%RPMN2ENG1%RPM…N2ENG4%RPMEGTENG1/℃…EGTENG4/℃…21:55:43GND32///23///…///0.3…0.5///…//////…36…︙︙︙︙︙︙…︙︙…︙︙…︙︙…︙…0:09:09AIR32000318-201.267…1.26787.1…87.288.5…88.7372…379…0:09:10AIR32000319-201.265…1.26587.1…87.188.4…88.6372…379…0:09:11AIR32000319-201.264…1.26687.1…87.188.4…88.6371…379…︙︙︙︙︙︙…︙︙…︙︙…︙︙…︙…9:48:23AIR1952150271.092…1.09464…63.684.6…84.7394…400…︙︙︙︙︙︙…︙︙…︙︙…︙︙…︙…9:52:42GND96///301.012…1.01425.8…25.665.8…65.9388…393…
The QAR data is inputted into the MATLAB program to generate the engine stable report data and the error value is calculated by comparing the engine stable report data with raw ACARS report data, as shown in Fig.4. Most of the data calculation errors can be controlled within 2% and no more than 4%, which are acceptable by estimating of minimum category “E” from Table 2 and it demonstrates the effectiveness of this method as well.
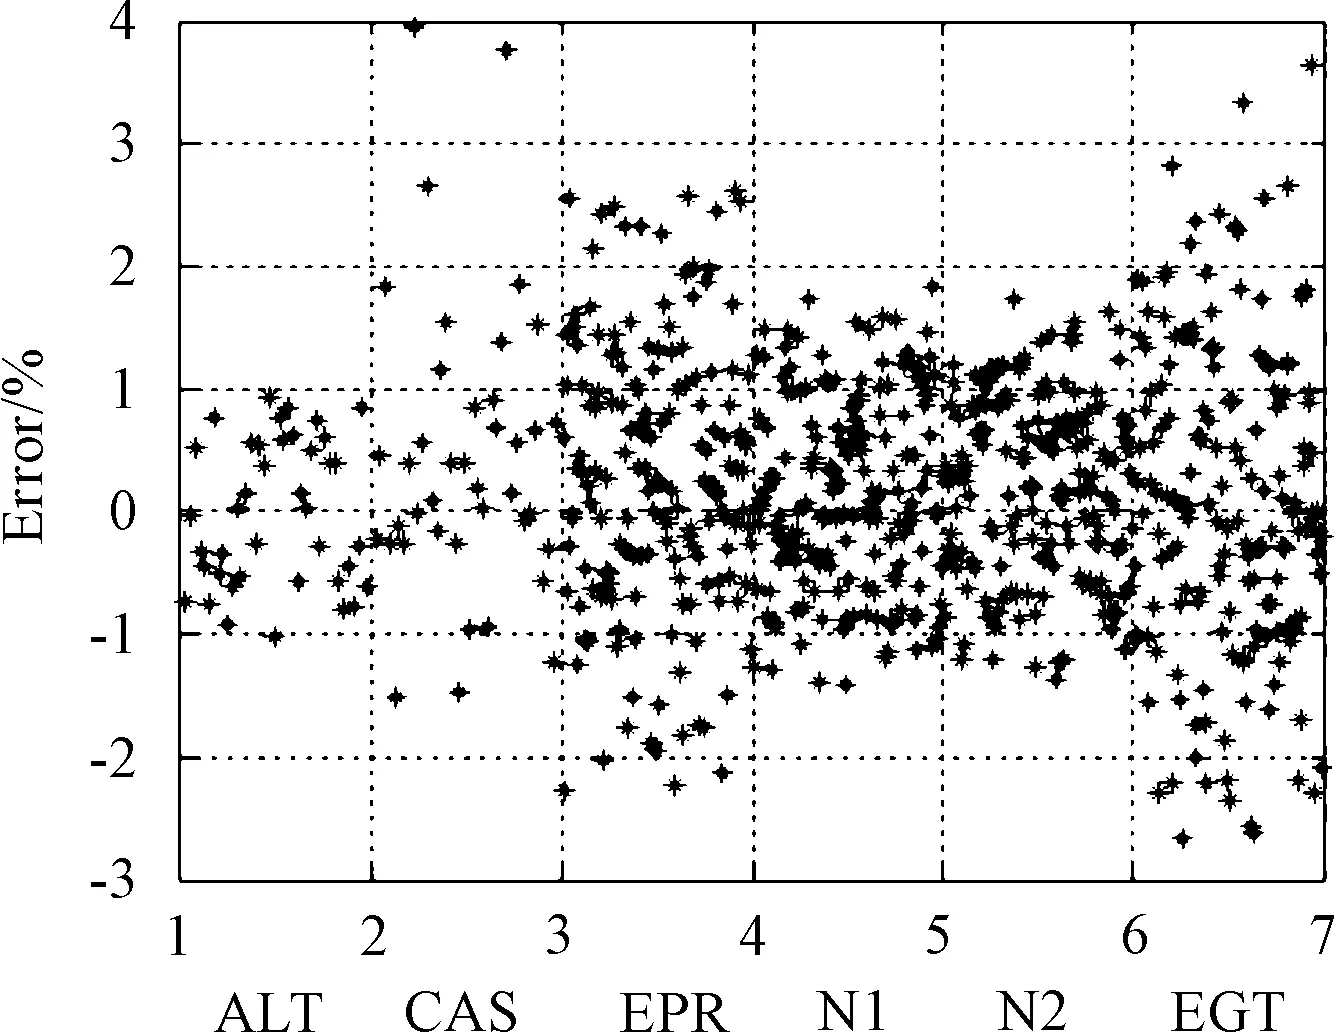
Fig.4 The contradistinction of calculation error
3.2 Error analysis
The engine stable frame report provided by OEM could be extracted in a large range and with little constraints, as shown in Table 1 and Table 2. The ACARS data of DFD reports is received and calculated by a third party firstly and then issued to airlines. The specific calculation algorithm is kept strictly confidential by the OEM which might include some hidden computational models and more restricted constraints. The extraction error of a parameter’s trigger conditions could have great influence on other parameters and it results in the calculation errors inevitably. Therefore, further studies are needed to be done.
According to 40 pieces of ACARS data reports, the relation curves of N1 and EGT which is changing with the EPR are described in Fig.5.
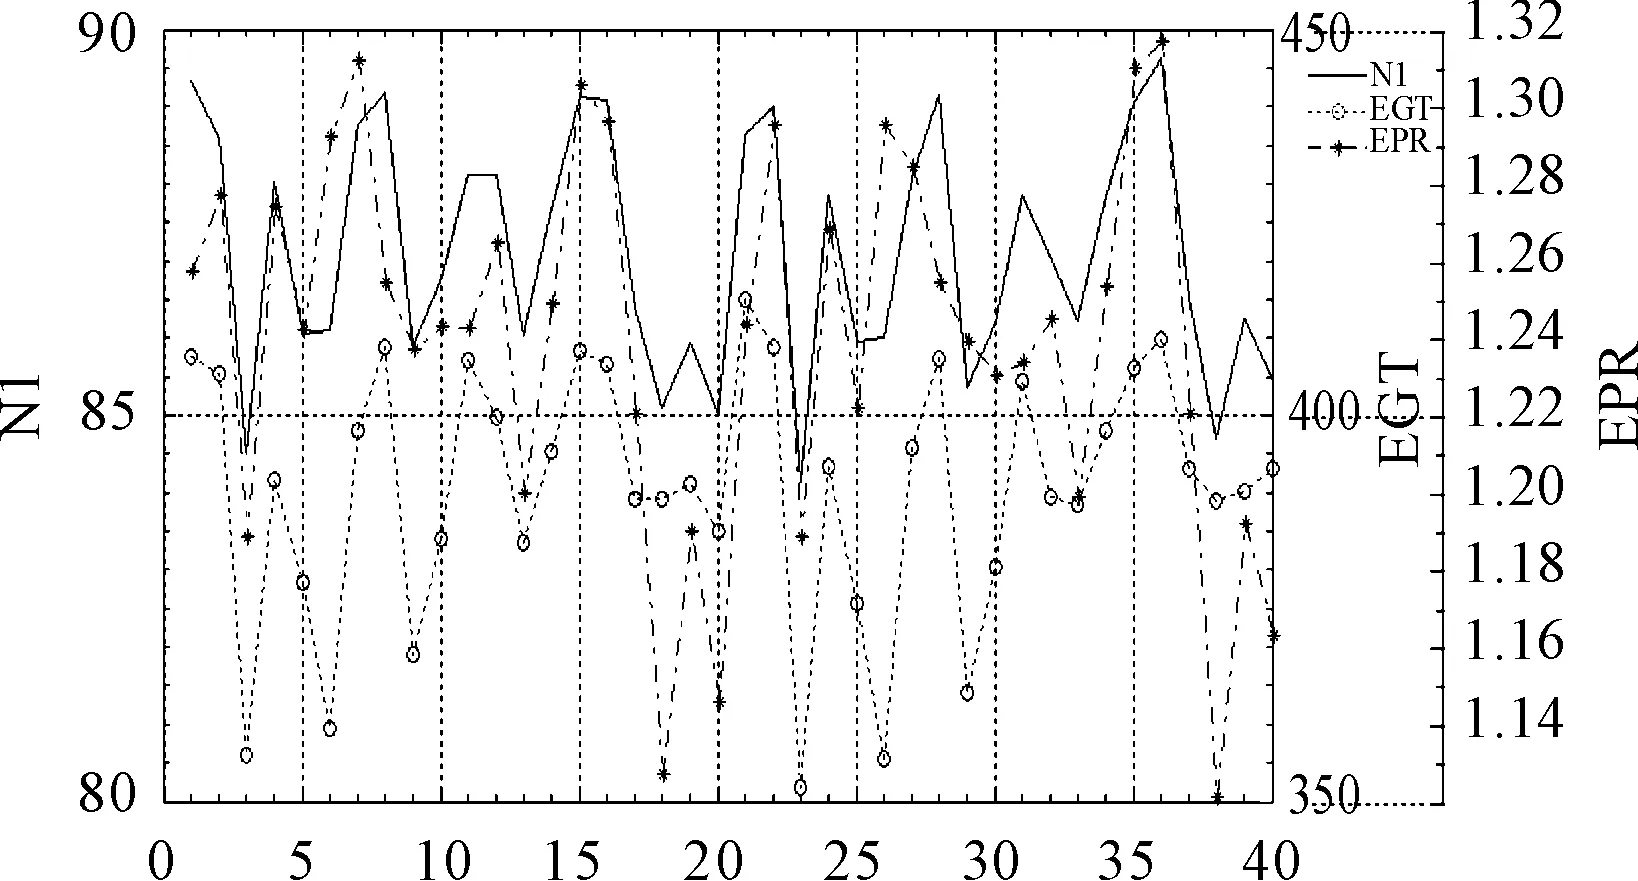
Fig.5 The N1 and EGT changes with the EPR
The EPR could influence N1 and EGT through regulating the FF (fuel flow) which could generate different exhaust pressure ratioes. It can be seen clearly that both N1 and EGT are positively correlated with the EPR in Fig.5.
4 Conclusions
This paper researches on the structure of the engine stable frame report and proposes the method about how to extract DFD report from its QAR data to meet the triggering conditions through data mining. The reliability of the method has been verified by computational analysis of the B747-400 airplane’s actual ACARS reports and generates data. It has great prospects in engineering application, which could not only enhance the flying qualities and the condition monitoring of the critical systems in airplane for the airlines but could also improve the accuracy and completeness of the air-ground data by adding the ACARS data reasonable. Meanwhile, the reports of any phase could be extracted from historical QAR data and the historical reports could be restored. Then the safety and reliability of the airplane could be improved by verifying the reliability of ACARS reports.
Acknowledgements
This paper is supported by the Fundamental Research Funds for the Central Universities (Y15-03) and The 4th Boeing Technical Challenge Fund (201410059).
[1]Qu Hongchun. Study on civil turbofan engine health intelligent monitoring technologies [D]. Tianjin: Tianjin University, 2010.
[2]CHEN Guoyan. QAR data analysis of turbofan engine [J]. Aviation Maintenance and Engineering, 2012, 2: 44-46.
[3]YAN Zhenqian, HUANG Aijun. Airplane fault isolation based on analysis of ACMS report and QAR data [J]. Aviation Maintenance and Engineering, 2014, 1: 44-47.
[4]GENG Hong, JIE Jun, XU Wenyan. Parameter identifying of the ACARE message [J]. Avionics Technology, 2006, 37(4): 6-11.
[5]LI Shuming, LV Wenli. Air-ground data link communication system based on ACARS and message parsing [J]. Equipment Manufacturing Technology, 2014)2): 54-57.
(Continued on 66 page)
20 May 2015; revised 17 July 2015;
Hong-chun QU, Professor.
E-mail: qhc@eyou.com
accepted 5 October 2015
Hydromechatronics Engineering
http://jdy.qks.cqut.edu.cn
E-mail: jdygcyw@126.com
杂志排行
机床与液压的其它文章
- Research on active suspension control strategy based on fuzzy PID control
- Study on rigid-flexible coupling multi-body dynamic model and simulation for wind turbine
- Mathematic model and parameters optimizing of cycloid rotational indexing machining of straight bevel gear
- Overload intelligent detection method of lift platform’s number of people under auxiliary visual
- Impact of fluid properties on the injection process in a common-rail direct injection system
- Pouring characteristics analysis on the concrete pump truck boom based on rigid-flexible coupling method
