Genetic diversity and association mapping for salinity tolerance in Bangladeshi rice landraces
2015-08-15RezaEmonMirzaIslamJyotirmoyHalderYeyangFan
Reza M.Emon,Mirza M.Islam*,Jyotirmoy HalderYeyang Fan**
aChinese National Center for Rice Improvement/State Key Laboratory of Rice Biology,China National Rice Research Institute,Hangzhou 310006,ChinabBangladesh Institute of Nuclear Agriculture,Mymensingh 2202,Bangladesh
Genetic diversity and association mapping for salinity tolerance in Bangladeshi rice landraces
Reza M.Emona,b,1,Mirza M.Islamb,*,1,Jyotirmoy Halderb,Yeyang Fana,**
aChinese National Center for Rice Improvement/State Key Laboratory of Rice Biology,China National Rice Research Institute,Hangzhou 310006,China
bBangladesh Institute of Nuclear Agriculture,Mymensingh 2202,Bangladesh
A R T I C L E I N F O
Article history:
Received in revised form 9 April 2015
Accepted 1 June 2015
Available online 6 June 2015
Oryza sativa L
Salinity tolerance
Seedling stage
Simple sequence repeat Sequence tagged site
A B S T R A C T
Breeding for salinity tolerance using Bangladeshi rice landraces and understand genetic diversity has been limited by the complex and polygenic nature of salt tolerance in rice genotypes.A genetic diversity and association mapping analysis was conducted using 96 germplasmaccessionswith variableresponsetosaltstressattheseedlingstage.Theseincluded 86landracesand10indicavarietiesandlinesincludingNonaBokra,fromsouthernBangladesh.A total of 220 alleles were detected at 58 Simple Sequence Repeat(SSR)marker loci randomly distributed on all 12 rice chromosomes and 8 Sequence Tagged Site(STS)markers developed for genes SKC1,DST,and SalT.The average gene diversity was 0.5075 and polymorphism information content value was 0.4426,respectively.Cluster analysis revealed that 68 and 21 accessions were clustered into 2 distinct groups,possibly corresponding to indica and japonica groups,respectively and the remaining 7 landraces were classified as an admixed group.In addition to Wn11463,the STS marker for SKC1,RM22418 on Chr.8 was significantly associated with salinity tolerance,at the location of a QTL detected in previous studies.Our findings of favorable alleles associated with salinity tolerance in Bangladeshi rice landraces,as well as the development of STS markers for salt tolerance genes,will be helpful in future efforts to breed salinity tolerance in rice.
©2015 Crop Science Society of China and Institute of Crop Science,CAAS.Production and hosting by Elsevier B.V.This is an open access article under the CC BY-NC-ND license (http://creativecommons.org/licenses/by-nc-nd/4.0/).
1.Introduction
Soil salinity is one of the most important environmental factors restricting rice production.Rice is classified as a salt sensitive crop,especially in the early growth stages[1].There are about 380 million hectares of saline soils globally,which are widely distributed in arid and semi-arid areas as well as seasonally dry coastal areas[2].In Bangladesh 2.8 million hectares of rice land in coastal areas are currently affected by salinity[3].Salt tolerant varieties are considered to be the most economical and effective way to increase crop production on saline lands[3].
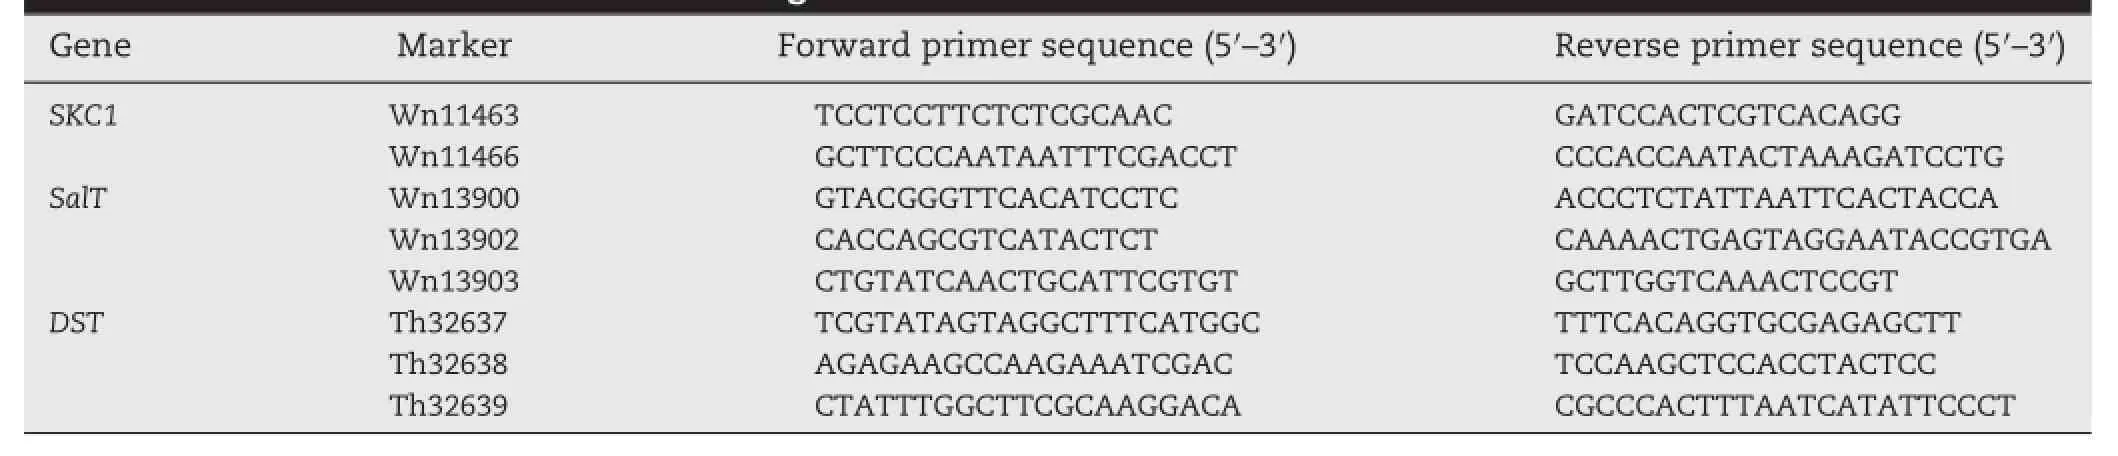
Table 1-STS markers for three salt-tolerant genes.
Many studies show that salinity tolerance is a complex trait controlled by quantitative trait loci(QTL)[4].For example,11 QTL for seedling survival were identified on chromosomes 1,4,6,7,and 9 using a Nona Bokra×Koshihikari F2:3population. One major QTL for shoot K+concentration on chromosome 1 (qSKC-1)explained 40.1%of the total phenotypic variance[5]. SKC1 was subsequently map-based cloned;it encodes a Na+transporter of the HKT type and is involved in Na+and K+homeostasis[6].Another QTL,SalTol,was fine-mapped to the same region and also acts mainly to control shoot Na+/K+homeostasis,suggesting that SKC1 may be the causal gene underlying the SalTol QTL[7].A salt-induced gene SalT,identified previously,was found to co-localize with SalTol and was 2.4 Mb away from SKC1[8].
Landraces are currently being exploited as preferred potential donors of abiotic stress tolerance traits because of their local adaptation[4].For instance,favorable alleles at the SKC1 and SalTol loci were derived from indica landraces Nona Bokra[6]and Pokkali[7],respectively.With close genetic similarity to current cultivars,the tolerance traits could readily be introduced into commercial breeding lines[4].
The southern part of Bangladesh is well known for high salinity and popular landraces from the region are well adapted and regarded as possessing some resistance to salt stress,particularly at the seedling stage[9].The situation is further increased by selection of rice landraces,which has happened in thecaseofassociationanalysisusingcollectedgermplasmfrom thisregion.Anevaluation ofgeneticdiversityandidentification of markers in Bangladesh rice landraces could provide useful information for genetic improvement of salt tolerance.
SSR have been the predominant molecular markers used in kinship and population studies because they are multiallelic,reproducible,PCR-based,and generally selectively neutral[10]. They can be applied for genetic diversity and association analysisofimportantagronomicandqualitytraitsinrice[11—15].
In the present study,96 rice accessions from southern Bangladesh were subjected to a genetic diversity and association mapping study using SSR and STS markers.The main objective of the present study was to:1)characterize the genetic diversity and population structure of Bangladesh rice landraces;2)develop novel STS markers for salt-tolerance genes and confirm their effect;and 3)identify loci significantly associated with salinity tolerance in rice.
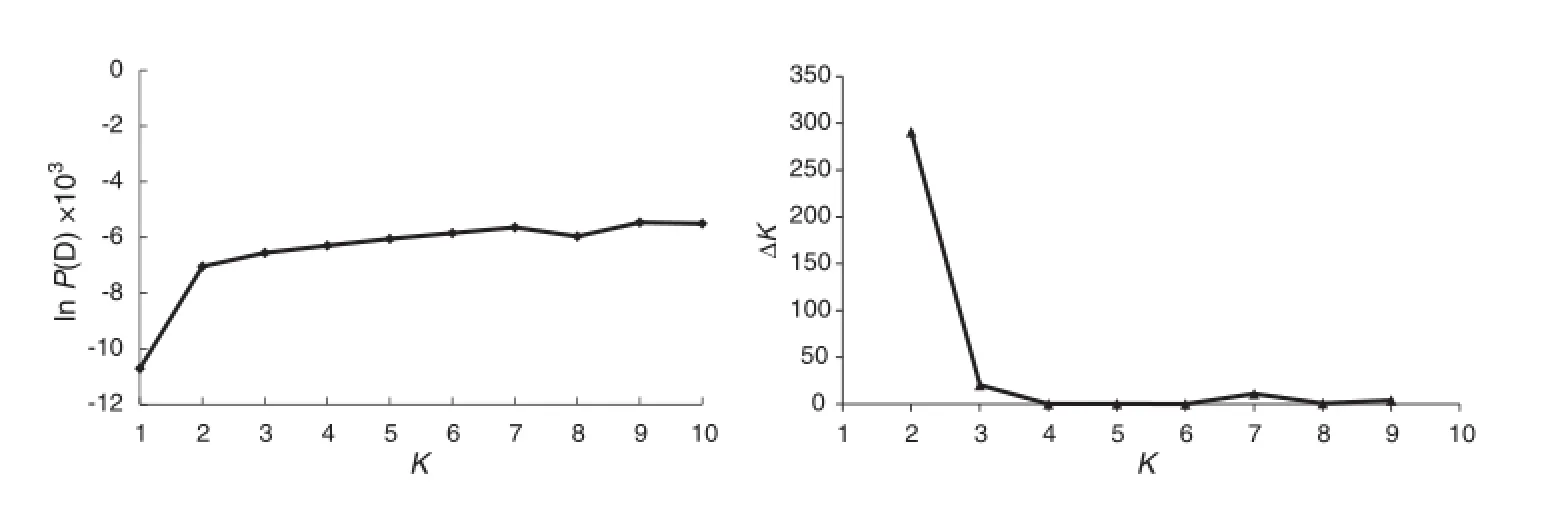
Fig.1-Average ln P(D)with K=1-10 and ΔK with K=2-9.
2.Materials and methods
2.1.Rice materials
A total of 96 rice accessions were collected by Bangladesh Institute of Nuclear Agriculture(BINA)and used in this study. They included 86 landraces from southern Bangladesh,9 indica varieties and lines,and salt tolerant Nona Bokra,the donor of SKC1,was used as the tolerant control(Table S1).
2.2.Screening for salinity tolerance
Hydroponic system based on the IRRI protocol[16]was used in the glasshouse at BINA to evaluate the salt tolerance responses of rice genotypes at the seedling stage.Three replications of 20 plants were tested under salt stress of 12 dS m−1.The modified standard evaluation score(SES)of IRRI[17]was used to assess visual symptoms of salt toxicity 21 days after sowing.Binadhan-8 was used as a second tolerant control and Binadhan-7 was the susceptible control.
2.3.Marker genotyping
DNA was extracted from 6—8 individuals in each accession following the method of Zheng et al.[18].To facilitatemarker-assisted selection(MAS),sequence tagged site(STS)markers,rather than single nucleotide polymorphism (SNP)markers,were developed based on Insertion/Deletions(InDels)between the Nipponbare and 9311 genome sequences at the SKC1(Chr.1)[6],SalT(Chr.1)[8]andDST(Chr.3)[19]loci.Primers (Table 1)were designed using Oligo 7.0 software.Eight STS markers were developed,2 for SKC1,3 for SalT and 3 for DST(Table 1).Wn11463 and Wn11466 were designed based on 4 bp and 17 bp InDels downstream of SKC1(LOC_Os01g20160);Wn13900 was based on a 4 bp InDel upstream of SalT (LOC_Os01g24710);Wn13902 and Wn13903 were based on 7 bp and8 bpInDelsintheSalTcodingregion;Th32637wasbasedon a 3 bp InDel upstream in DST(LOC_Os03g57240);and Th32638 and Th32369 were based on 12 bp and 18 bp InDels in the coding region of DST.
One hundred and ninety-four SSR markers randomly distributed across 12 chromosomes of rice were selected from Gramene(http://www.gramene.org/)and used to screen for polymorphisms in 4 DNA pools bulked by 24 genotypes each. Finally,58polymorphicmarkerswereselectedtogenotypeeach accession,of which 8,5,8,3,4,7,3,7,3,4,1,and 5 were located on each of 12 chromosomes,respectively.Chromosome 11 was represented by only one marker.
PCRwascarriedoutina20 μLreactionmixtures containing 10 μL of 2×Taq MasterMix II(Beijing Cowin BiotechCo.,Ltd.),0.5 μmol L−1SSRprimersand1.0 μL oftemplateDNA.Amplificationswereperformedwith pre-denaturation of 2 min at 94°С,30 cycles of 30 s at 94°С,30 s at 50—55°С,30 s at 72°С and extension of 2 min at 72°С. PCR products were visualized on 2%agarose gels using GelRed staining or on 6%non-denaturing polyacrylamide gel using silver staining.
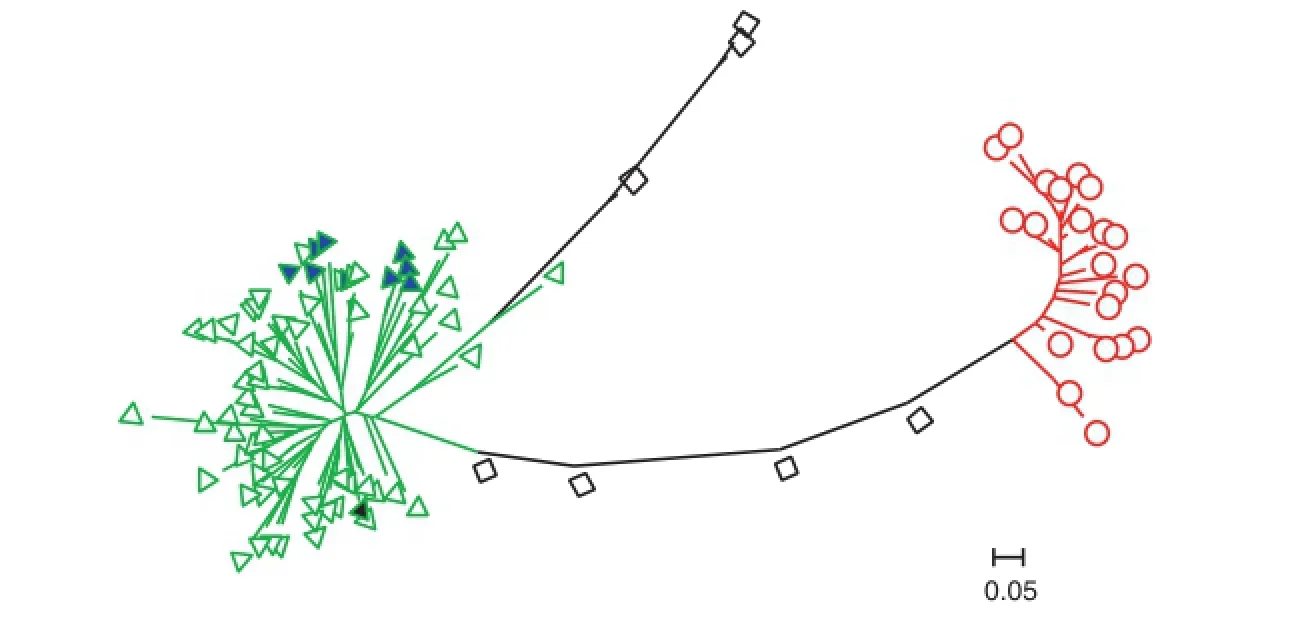
Fig.2-Neighbor-joining tree for 96 rice accessions based on 66 molecular markers.The triangles,circles and squares indicate Group 1,Group 2 and the admixed group,respectively.The blue triangles filled with blue and black color represent the 9 indica lines and the black triangle is Nona Bokra.
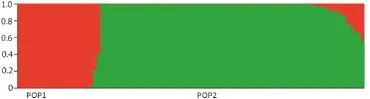
Fig.3-Population structure of 96 rice accessions based on 66 molecular markers(K=2).
2.4.Statistical analyses
Genetic diversity was assessed using PowerMarker version 3.25 [20],and was measured by the number of alleles per locus,major allele frequency,gene diversity,and polymorphism information content(PIC).Nei's distance was calculated and used for the unrooted phylogeny reconstruction though the neighbor joining method implemented in PowerMarker with Treeview using MEGA 4.0[21].Population structure of the rice germplasm was analyzed using STRUCTURE v2.0[22].Models with putative numbers of sub-populations(K)from 1 to 10 with admixture and correlated allele frequencies were considered. Seven independent runs with burn-in of 10,000,and run length of 100,000 iterations for each K were implemented.Both ln P(D)value and Evanno's ΔK were used to determine the K-value[23]. ln P(D)is the log likelihood of the observed genotype distribution in K clusters and was found by STRUCTURE simulation. Evanno's ΔK takes into consideration the variance of ln P(D)among repeated runs and indicates the ideal K.The optimum value of K was then used to determine inferred ancestries.An individual was assigned to a specific population if it had more than 0.8 membership in that population,whereas individuals withmembershipprobabilitieslessthan0.8wereassignedtoan admixed group.
Association between marker alleles and salinity tolerance data was performed using a mixed linear model(MLM)function based on population structure(Q)+relative kinship(K)in TASSEL 3.0.For each locus,rare alleles(frequency<5%)were treatedasnullalleles.Therelativekinshipmatrixwascalculated by Tassel.Significant marker-trait associations were declared by P≤0.05 with relative magnitudes represented by the R2value as the portion of variation explained by the marker.
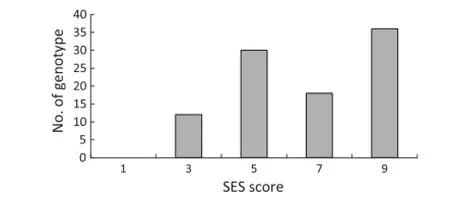
Fig.4-Distribution of seedling salinity tolerance scores among 96 rice accessions.
3.Results
3.1.Genetic diversity
A total of 220 alleles were detected using 58 SSR markers randomly distributed on rice 12 chromosomes and 8 STS markers(Table S2).The average major allele frequency was 0.61,ranging from 0.35 to 0.92,indicating that 61%of loci shared a common major allele at any given locus.The average number of alleles per locus was 3.33,ranging from 2 to 7.The average gene diversity was 0.51,ranging from 0.15 to 0.73 and the average PIC value was 0.44,ranging from 0.14 to 0.68.
3.2.Population structure
The ln P(D)value increased with K from 1 to 10,but showed a large increase at K=2(Fig.1),suggesting two distinct groups. There was also a sharp peak of Evanno's ΔK at K=2(Fig.1).A neighbor-joining tree was constructed based on Nei's genetic distance(Fig.2).The same result was revealed based on STRUCTURE membership assignment for the 96 accessions (Fig.3).The majority of accessions,including 58 landraces,9 varieties/lines and Nona Bokra were assigned to Group 1 and 21 landraces comprised Group 2(Table S1).Seven landraces with membership probabilities ranging from 0.56 to 0.79 were classified as an admixed group.Nine indica genotypes,as well as Nona Bokra,were all in Group 1,indicating that Group 1 corresponds to ssp.indica.
3.3.Association mapping
There was a large variance in seedling response to salt stress (Fig.4,Table S1).The controls responded as expected.The SES scores for Nona Bokra and Binadhan-8 were 3.0 and 3.7 (tolerant),whereas that for Binadhan-7 was 8.3 indicative of low tolerance.Among all 96 accessions 12 were tolerant(1<score≤3),30moderatelytolerant(3<score≤5),18 sensitive(5<score≤7),and 36 highly sensitive(7<score≤9). None was highly tolerant(score=1).
Two markers showed significant association with salinity tolerance score(Fig.5,Table S3).Wn11463,a marker for SKC1 gene on Chr.1 was significantly associated with tolerance with a P-value of 0.028 and explained 11.7%of the phenotypic variation.RM22418 on Chr.8,also showed a significant association with salinity tolerance(P=0.028)accounting for 17.8%of the variation.
For Wn11463,the accessions carrying the alleles 120 bp (the size of PCR product for the markers,the same as below)and 113 bp had significantly(P<0.01)lower SES scores,as did those carrying the 160 bp and 152 bp alleles at RM22418 (P<0.01),indicating these alleles could be useful in breeding.
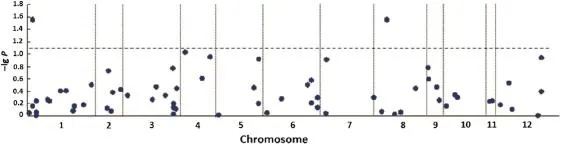
Fig.5-Manhattan plots for salinity tolerance.Negative lg-transformed P-values were plotted against chromosomal position.
4.Discussion
Our results indicated two major groups of southern Bangladeshi germplasm;Group 1 apparently corresponded to ssp. indica.Wang et al.recently detected three distinct groups corresponding to ssp.indica,aus,and japonica among 151 Bangladeshi accessions using 47 SSR markers[24].Yesmin et al.found38Bangladeshi landraces in2majorgroups described as indica and aromatic using 34 SSR markers[9]. Some accessions in the previous studies were the same as those in the present work.Variety BRRI Dhan41 and landraces Raja Shail and Kali Boro were classified as indica[9],whereas Bouari(or Boari in [24])was in the japonica group[24],suggesting that two main groups I and 2 in the present work probably corresponded to ssp.indica and japonica,respectively.
Eight new STS markers based on 3 salt tolerance genes were developed,but only Wn11463,a marker for SKC1,was significantly associated with salt tolerance,indicating that SKC1 is likely to be present in some Bangladeshi landraces. Wn11463 was designed based on a 4 bp InDel located 1 kb downstream of SKC1,suggesting that it might be a functional marker for selection of SKC1.The STS marker Wn11463 would be helpful in MAS for rice salinity breeding.
Locus RM22418 on the short arm of Chr.8 also showed a significant association with salinity tolerance,corresponding to the physical position of 3326 kb in Nipponbare genome. QTL for traits related to salt tolerance have been detected repeatedly in this region(Table S4).The QTL in RM38-RM25 (2115—4378 kb)interval showed significant effect to score of salt toxicity of leaves and survival days of seedlings at the seedling stage,as well as fresh weight at the tillering stage[25].A QTL was also identified for Na+in straw at high salt in the interval of RM1235-RM25(1209—4378 kb)accounting for 14.05%of the total variation[26].These results suggested that RM22418-contained region were essential for rice growth under salt stress.
In summary,of 86 southern Bangladeshi rice landraces,11 (12.6%)were identified as having seedling tolerance(SES score 3.0)to salt stress,and 25(28.7%)were moderately tolerant. These accessions could be suitable sources of salinity tolerance in breeding programs.
Acknowledgments
We thank Prof.Jieyun Zhuang for support and suggestions and Dr.Caihong Wang for guidance in statistical analysis. This work was supported by the National High Technology Research and Development Program of China(2012AA101102)and the Technology Research Program of Zhejiang province (2011C24001).
Supplementary material
Supplementary data to this article can be found online at http://dx.doi.org/10.1016/j.cj.2015.04.006.
R E F E R E N C E S
[1]K.Kumar,M.Kumar,S.R.Kim,H.Ryu,Y.G.Cho,Insights into genomics of salt stress response in rice,Rice 6(2013)27.
[2]J.H.Xie,F.J.Zapata-Arias,M.Shen,R.Afza,Salinity tolerant performance and genetic diversity of four rice varieties,Euphytica 116(2000)105—110.
[3]M.M.Islam,S.N.Begum,R.M.Emon,J.Halder,A.C.Manidas,Carbon isotope discrimination in rice under salt affected conditions in Bangladesh,IAEA-TECDOC-1617,Greater Agronomic Water Use Efficiency in Wheat and Rice Using Carbon Isotope Discrimination,International Atomic Energy Agency,Vienna 2012,pp.7—23.
[4]S.J.Roy,E.J.Tucker,M.Tester,Genetic analysis of abiotic stress tolerance in crops,Curr.Opin.Plant Biol.14(2011)232—239.
[5]H.X.Lin,M.Z.Zhu,M.Yano,J.P.Gao,Z.W.Liang,W.A.Su,X.H. Hu,Z.H.Ren,D.Y.Chao,QTLs for Na+and K+uptake of the shoots and roots controlling rice salt tolerance,Theor.Appl. Genet.108(2004)253—260.
[6]Z.Ren,J.Gao,L.Li,X.Cai,W.Huang,D.Chao,M.Zhu,Z. Wang,S.Luan,H.Lin,A rice quantitative trait locus for salt tolerance encodes a sodium transporter,Nat.Genet.37(2005)1141—1146.
[7]M.J.Thomson,M.Ocampo,J.Egdane,M.A.Rahman,A.G. Sajise,D.L.Adorada,E.Tumimbang-Raiz,E.Blumwald,Z.I. Seraj,R.K.Singh,G.B.Gregorio,A.M.Ismail,Characterizing the saltol quantitative trait locus for salinity tolerance in rice,Rice 3(2010)148—160.
[8]S.Negrão,M.C.Almadanim,I.S.Pires,I.A.Abreu,J.Maroco,B.Courtois,G.B.Gregorio,K.L.McNally,M.M.Oliverira,New allelic variants found in key rice salt-tolerance genes:an association study,Plant Biotechnol.J.11(2013)87—100.
[9]N.Yesmin,S.M.Elias,M.S.Rahman,T.Haque,A.K.M.M. Hasan,Z.I.Seraj,Unique genotypic differences discovered among indigenous Bangladeshi rice landraces,Int.J.Genomics (2014)210328,http://dx.doi.org/10.1155/2014/210328.
[10]C.Zhu,M.Gore,E.S.Buckler,J.Yu,Status and prospects of association mapping in plants,Plant Genome 1(2008)5—20.
[11]H.A.Agrama,G.C.Eizenga,W.Yan,Association mapping of yield and its components in rice cultivars,Mol.Breed.19 (2007)341—356.
[12]W.Wen,H.Mei,F.Feng,S.Yu,Z.Huang,J.Wu,L.Chen,X.Xu,L.Luo,Population structure and association mapping on chromosome 7 using a diverse panel of Chinese germplasm of rice(Oryza sativa L.),Theor.Appl.Genet.119(2009)459—470.
[13]L.Jin,Y.Lu,P.Xiao,M.Sun,H.Corke,J.Bao,Genetic diversity and population structure of a diverse set of rice germplasm for association mapping,Theor.Appl.Genet.121(2010)475—487.
[14]P.Zhang,J.Li,X.Li,X.Liu,X.Zhao,Y.Lu,Population structure and genetic diversity in a rice core collection(Oryza sativa L.)investigated with SSR markers,PLoS One 6(2011)e27565,http://dx.doi.org/10.1371/journal.pone.0027565.
[15]P.Zhang,X.Liu,H.Tong,Y.Lu,J.Li,Association mapping for important agronomic traits in core collection of rice(Oryza sativa L.)with SSR markers,PLoS One 9(2014)e111508,http:// dx.doi.org/10.1371/journal.pone.0111508.
[16]S.Yoshida,D.A.Forno,J.H.Cook,K.A.Gomez,Laboratory Manual for Physiological Studies of Rice,International Rice Research Institute,Los Baños,Laguna,Philippines,1976.61—66.
[17]G.B.Gregorio,D.Senadhira,R.D.Mendoza,Screening rice for salinity tolerance,IRRI Discussion Paper Series no.22,International Rice Research Institute,Manila,Philippines 1997,pp.1—30.
[18]K.Zheng,N.Huang,J.Bennett,G.S.Khush,PCR-based marker-assisted selection in rice breeding,IRRI Discussion Paper Series No.12,International Rice Research Institute,Manila,Philippines,1995.
[19]X.Huang,D.Chao,J.Gao,M.Zhu,M.Shi,H.Lin,A previously unknown zinc finger protein,DST,regulates drought and salt tolerance in rice via stomatal aperture control,Genes Dev.23 (2009)1805—1817.
[20]K.Liu,S.V.Muse,PowerMarker:integrated analysis environment for genetic marker data,Bioinformatics 21 (2005)2128—2129.
[21]K.Tamura,J.Dudley,M.Nei,S.Kumar,MEGA4:molecular evolutionary genetics analysis(MEGA)software version 4.0,Mol.Biol.Evol.24(2007)1596—1599.
[22]D.Falush,M.Stephens,J.K.Pritchard,Inference of population structure using multilocus genotype data:linked loci and correlated allele frequencies,Genetics 164(2003)1567—1587.
[23]G.Evanno,S.Regnaut,J.Goudet,Detecting the number of clusters of individuals using the software STRUCTURE:a simulation study,Mol.Ecol.14(2005)2611—2620.
[24]M.Wang,Z.Zhu,L.Tan,F.Liu,Y.Fu,C.Sun,H.Cai,Complexity of indica—japonica varietal differentiation in Bangladesh rice landraces revealed by microsatellite markers,Breed.Sci.63(2013)227—232.
[25]J.Zang,Y.Sun,Y.Wang,J.Yang,F.Li,Y.Zhou,L.Zhu,J.Reys,M.Fotokian,J.Xu,Z.Li,Dissection of genetic overlap of salt tolerance QTLs at the seedling and tilling stage using backcross introgression lines in rice,Sci.China Ser.C 51 (2008)583—591.
[26]A.Pandit,V.Rai,S.Bal,S.Sinha,V.Kumar,M.Chauhan,R.K. Gautam,R.Singh,P.C.Sharma,A.K.Singh,K.Gaikwad,T.R. Sharma,T.Mohapatra,N.K.Singh,Combining QTL mapping and transcriptome profiling of bulked RILs for identification of functional polymorphism for salt tolerance genes in rice (Oryza sativa L.),Mol.Genet.Genomics 284(2010)121—136.
*Correspondence to:M.M.Islam,Bangladesh Institute of Nuclear Agriculture,Mymensingh 2202,Bangladesh.Tel.:+880 91 67834.
**Correspondence to:Y.Fan,Chinese National Center for Rice Improvement/State Key Laboratory of Rice Biology,China National Rice Research Institute,Hangzhou 310006,China.Tel.:+86 571 63370364.
E-mail addresses:mirza_islam@yahoo.com(M.M.Islam),fanyeyangcnrri@163.com(Y.Fan).
Peer review under responsibility of Crop Science Society of China and Institute of Crop Science,CAAS.1These authors contributed equally to this work.
http://dx.doi.org/10.1016/j.cj.2015.04.006
2214-5141/©2015 Crop Science Society of China and Institute of Crop Science,CAAS.Production and hosting by Elsevier B.V.This is an open access article under the CC BY-NC-ND license(http://creativecommons.org/licenses/by-nc-nd/4.0/).
29 January 2015
杂志排行
The Crop Journal的其它文章
- Tillage and straw mulching impacts on grain yield and water use efficiency of spring maize in Northern Huang-Huai-Hai Valley
- Physiological responses of Brassica napus to fulvic acid under water stress:Chlorophyll a fluorescence and antioxidant enzyme activity
- Field evaluation of durum wheat landraces for prevailing abiotic and biotic stresses in highland rainfed regions of Iran
- Genetic diversity and DNA fingerprinting in jute (Corchorus spp.)based on SSR markers
- Genomewide association study of Aegilops tauschii traits under seedling-stage cadmium stress
- Crop rotation-dependent yield responses to fertilization in winter oilseed rape(Brassica napus L.)