Effects of 42-year long-term fertilizer management on soil phosphorus availability,fractionation,adsorption-desorption isotherm and plant uptake in flooded tropical rice
2015-08-15PratapBhattacharyyaAmareshKumarNayakMohammadShahidRahulTripathiSangitaMohantyAnjaniKumarRajagounderRajaBipinBihariPandaBanwariLalPriyankaGautamChinmayaKumarSwainKoushikSinghaRoyPradeepKumarDash
Pratap Bhattacharyya*,Amaresh Kumar Nayak,Mohammad Shahid,Rahul Tripathi,Sangita Mohanty,Anjani Kumar,Rajagounder Raja,Bipin Bihari Panda,Banwari Lal,Priyanka Gautam,Chinmaya Kumar Swain,Koushik Singha Roy,Pradeep Kumar Dash
Division of Crop Production,Central Rice Research Institute,Cuttack 753006,Odisha,India
Effects of 42-year long-term fertilizer management on soil phosphorus availability,fractionation,adsorption-desorption isotherm and plant uptake in flooded tropical rice
Pratap Bhattacharyya*,Amaresh Kumar Nayak,Mohammad Shahid,Rahul Tripathi,Sangita Mohanty,Anjani Kumar,Rajagounder Raja,Bipin Bihari Panda,Banwari Lal,Priyanka Gautam,Chinmaya Kumar Swain,Koushik Singha Roy,Pradeep Kumar Dash
Division of Crop Production,Central Rice Research Institute,Cuttack 753006,Odisha,India
A R T I C L E I N F O
Article history:
Receivedinrevisedform19March2015 Accepted 1 June 2015
Available online 6 June 2015
Long-term fertilization
Phosphorus adsorption
Phosphorus desorption
Phosphorus fractionation Tropical rice
A B S T R A C T
Soil phosphorus(P)fractionation,adsorption,and desorption isotherm,and rice yield and P uptake were investigated in flooded tropical rice(Oryza sativa L.)following 42-year fertilizer and manure application.The treatments included low-input[unfertilized control without N,P,or K (C0N0)],farmyard manure(FYM)(C1N0),NP(C0NP),NPK(C0NPK),FYM+NP(C1NP),and high-input treatment,FYM+NPK(C1NPK).Grain yield was increased significantly by 74% over the control under the combined application of FYM+NPK.However,under low-and high-input treatments,yield as well as P uptakewas maintained at constant levels for 35 years. Duringthesameperiod,highyieldlevelsandPuptakeweremaintainedundertheC0NP,C0NPK,and C1NPK treatments.Theseareunique characteristics of a tropical floodedecosystem,which is a self-sustaining system for rice production.The Fe—P fraction was highest compared to the Ca—PandAl—Pfractionsafter42 yearsoffertilizerapplicationandwassignificantlyhigherunder FYM+NPK treatment.The P adsorption capacity of soil was highest under the low-input treatment and lowest under long-term balanced fertilization(FYM+NPK).In contrast,P desorption capacity was highest under NPK and lowest in the control treatment.Long-term balanced fertilization in the form of FYM+NPK for 42 years lowered the bonding energy and adsorption capacity for P in soil but increased its desorption potential,increasing P availability to the plant and leading to higher P uptake and yield maintenance.
©2015 Crop Science Society of China and Institute of Crop Science,CAAS.Production and hosting by Elsevier B.V.This is an open access article under the CC BY-NC-ND license (http://creativecommons.org/licenses/by-nc-nd/4.0/).
1.Introduction
Long-termexperimentsprovideameansofevaluating sustainable management systems in agriculture[1].Several long-term fertilizer experiments have been conducted to quantify changes in major and trace elements in soils[2]. Phosphorus(P)deficiency is a universal constraint to crop production and constitutes the second most important soilfertility problem throughout the world[3].Crop yields are often limited by low P availability in soils,owing mainly to adsorption andprecipitationreactionsofbothindigenoussoilPandapplied fertilizer P with iron(Fe),aluminum(Al),or calcium(Ca)[4].Low P uptake efficiency of plants isassociatedprimarily with limited P availability in native soil.Consequently,large amounts of expensive inorganic P fertilizers need to be applied to many agricultural soilsto attain reasonablecropyields[5].Application of organic matter to soil increases P solubility,decreases P fixation,and thus improves P availability to plants[4].
Several additive mechanisms may be involved,including the release of inorganic P from decaying residues,blockage of P sorption sites by organic molecules released from the residues,regulation of soil pH,and complexation of soluble Al and Fe by organic molecules[6].The adsorption behavior of P in a soil system can be determined by analysis of the adsorption data for various isotherms using equations such as the Langmuir and Freundlich equations.The P concentration in soil depends on P adsorption on the surface of soil colloids. The P availability in soil depends on the degree of P adsorption on soil colloids[7,8].
The interaction of N with P is the single most important nutrient interaction[9].When P input from fertilizer exceeds P output in crop,P accumulates in soil over time[10].The information obtained from P fractionation schemes has been used to estimate the fate of applied P and the relationship between forms of P and plant P nutrition[11].Thus,for developing long-term P management strategies,it is important to ascertain the forms and characteristics of P remaining in the soil after repeated fertilizer P application in an agroecosystem.
Soil inorganic P(Pi)represents the dominant component in the soil P pool,accounting for about 75—85%of soil total P[12]. Soil Pi is represented as various fractions such as Ca—P (HCl-extractableP),Fe-andAl—P(non-occludedFe-and Al-boundP)andO—P(PoccludedwithinFeoxides)[13].Sequential Pi fractionation distinguishing labile(resin-extractable P and NaHCO3-extractable P)and more stable forms(Ca—P,Al—P,Fe—P,and O—P)of Pi has been established[14].Ca—P is generally not fractionated further into subfractions because the Ca—P fraction in non-calcareous soils is rather small[15].
However,in calcareous soils,most Pi is present in various Ca-bound forms and there are great differences in P availability among these Ca—P fractions.Huang et al[16]investigated the soil P dynamics inpaddy soilsina one-seasonfield experiment. In contrast,information about the dynamics of soil Pi fractions andPtransformationunderlong-termfertilizationinrelationto adsorption and desorption isotherms is sparse.The objectives of the present study were(1)to investigate the yield and P uptake of rice in response to long-term fertilization,(2)to investigatelong-termfertilizationeffectsonsoilPfractions,and (3)toevaluatePadsorptionanddesorptionisothermsinflooded rice soil after long-term fertilizations.
2.Materials and methods
2.1.Experimental site
A long-term fertilizer experiment has been continuing since 1969,involving a rice—rice cropping system in tropical Aeric Endoaquept soil on the experimental farm of the Central Rice Research Institute,Cuttack.The site is located in the alluvial tract of the Mahanadi basin at 20°25′N and 85°55′E at an altitude of 24 m.a.s.l.in eastern India.The climate is tropical with mean annual precipitation around 1500 mm and the predominant rainfall occurs from June to September.The soil is sandy clay loam(30.9%clay,16.6%silt,52.5%sand)with bulk density 1.41 Mg m−3,pH(using 1:2.5,soil:water suspension)6.6,total C 0.78%,and total N 0.08%.The cation exchange capacity is 15.2 cmol(P+)kg−1and the available P content of the initial soil was 13 mg kg−1.
2.2.Crop establishment and treatments
The field experiment was conducted for 42 years(there was no crop in the dry season during 1984—1993)under rice—rice cultivation and the six treatments under the study were replicated three times in a randomized block design.The field was plowed thoroughly and flooded for puddling and leveling 2—3 days before transplanting.Rice seedlings around 25 days old were transplanted at a spacing of 20 cm×15 cm with two to three seedlings per hill in both wet(July—December)and dry (January—April)seasons.Farmyard manure was applied to the field once yearly during wet season at 5 t ha−1.The total C and P content in the FYM was 245 g kg−1and 3.7 g kg−1,respectively.Nitrogen was applied in the form of 50%urea as basal andtherestintwoequalsplitsastopdressingafter transplanting.Topdressing with N fertilizer(urea)was performed at maximum tillering and panicle initiation stage of crop growth in both wet and dry seasons.The full doses of P and K were applied as basal just before transplanting in the form of single superphosphate and muriate of potash(KCl). All the field plots remained continuously flooded to a depth of 7±3 cm during the entire period of crop growth and were drained 10 days before harvest.The crop was cultivated according to local recommended agronomic practices except for the fertilization,which was performed as described for the treatments.The treatments were as follows:
(a)Control(with no fertilizers or organic manures)(C0N0)
(b)FYM(5 t ha−1applied only in wet season)(C1N0).
(c)N+P(60 kg N ha−1in wet season;80 kg N ha−1in dry season and30 kg P2O5ha−1inwetseason;40 kg P2O5ha−1in dry season)(C0NP)
(d)NPK(60 kg N ha−1in wet season;80 kg N ha−1in dry season;30 kg P2O5ha−1in wet season;40 kg P2O5ha−1in dry season and 30 kg K2O ha−1in wet season;40 kg K2O ha−1in dry season)(C0NPK)
(e)FYM+NP(5 t ha−1+60 kg N ha−1inwetseason;80 kg N ha−1in dry season and 30 kg P2O5ha−1in wet season;40 kg P2O5ha−1in dry season)(C1NP).
(f)FYM+NPK(5 t ha−1+60 kg N ha−1inwetseason;80 kg N ha−1in dry season;30 kg P2O5ha−1in wet season;40 kg P2O5ha−1in dry season and 30 kg K2O ha−1in wet season;40 kg K2O ha−1in dry season)(C1NPK).
2.3.Soil sampling and storage
Soil samples were collected in three replications with an auger(at a depth of 0—15 cm)in both wet and dry seasonsduring 1969—2013.The soil samples collected after harvest in the wet season in the respective years were used for the study. The soils were air dried,sieved through a 2 mm sieve,and stored in sealed plastic jars for analysis.
2.4.Phosphorus adsorption
Soil samples were equilibrated with graded P levels(0,2.5,5.0,10,20,30,40,and 50 μg P g−1)in 0.01 mol L−1CaCl2solution using a soil solution ratio of 1:10.Centrifuge tubes containing the soil suspension were equilibrated for 6 days at room temperature following Singh and Jones[17].Two drops of toluene were added to each tube to minimize microbial activity.The samples were then centrifuged at 2500 r min−1for 10 min,and the P concentration was measured in the supernatant solution by the ascorbic acid method[18]on a spectrophotometer.The sorbed P was calculated as the difference between the amount of P added and that remaining in the equilibrium soil solution using the relationship

where x/m or S denotes the amount of P adsorbed(μg P g−1soil),V the volume of equilibrium solution(mL),C0the original concentration of P in solution(μg P mL−1),Cethe equilibrium concentration of P in solution(μg P mL−1)and g the mass of the soil sample (g).The residual soil was retained for desorption studies.Adsorption data were analyzed using
(A)Langmuir equation:


where X denotes μg P adsorbed g−1soil,C the equilibrium P concentration(μg P mL−1),a the extent of P adsorption (μg P g−1soil)and n a constant corresponding to the degree of linearity between the solution equilibrium concentration and adsorption(g mL−1).A linear plot of log10X versus log10C yields a and n from the intercept and slope,respectively. Differential and maximum buffering capacities were computed from the change in the quantity of P adsorbed by soil due to the change in the concentration of P in the soil solution using the relationship given by Holford and Mattingly[19].
2.5.Phosphorus desorption
The residual soils obtained from the adsorption studies were shaken with 25 mL of 0.01 mol L−1CaCl2solution for 6 h on a horizontal shaker[17]and filtered through Whatman No.1 filter paper.The equilibrium P concentration in the solution,desorbed P,was determined by the ascorbic acid method[18]. Phosphorus retained in soil(pre-sorbed P)was determined as the difference between initial sorbed P and P in the desorption equilibrium solution.
2.6.Soil P,Brays'P,uptake,and P fractionation
Soluble soil P was determined using the Olsen P method[20],based on extraction of air-dry soil with 0.5 mol L−1NaHCO3at pH 8.5.Uptake of P in shoot,root,and in grain was calculated as Puptake(shoot/grain)=(P concentration inshoot/ grain)×biomass.The method of Chang and Jackson[21]is widely used for estimation of soil P.Phosphorus fractionation was determined following Murphy and Riley[22].Briefly,the Al—P fraction in a soil sample(1 g)was extracted with 50 mL of 1 mol L−1NH4Cl and 0.5 mol L−1NH4F followed by washing with saturated NaCl.Then the solution was treated with 50 mL 0.1 mol L−1NaOH to yield the Fe—P fraction.The soluble P was obtained by treating the solution with 40 mL 0.3 mol L−1Na3C3H6O7,5 mL 1 mol L−1NaHCO3,and 1 g Na2SO4.The Ca—P fraction was obtained by treating the solution with 50 mL 0.25 mol L−1H2SO4with shaking for 1 h.The Bray's P was determined by extracting soils with 0.03 mol L−1NH4F in 0.025 mol L−1HCl followed by spectrophotometric estimation [23].
2.7.Statistical analysis
Individual character datasets were subjected to analysis of variance and means were separated by Tukey—Kramer's HSD test at the 0.05 level of probability using the statistical software SPSS 20.0(Statistical Package for Social Science;M/s IBM,USA).
3.Results and discussion
3.1.Grain yield and P uptake
Grain yield varied under different treatments of long-term fertilizer applications in comparison to that of the control in both wet(1969—2011)and dry(1970—2010)seasons(Fig.1).The trend of grain yield was in the order C1NPK>C1NP>C0NPK>C0NP>C1N0>C0N0in both seasons(Fig.1).The yield was higher in the dry than in the wet season(Fig.1).In the wet season the grain yield was in the ranges 3.18—5.78,4.30—5.74,3.77—5.46,3.42—5.81,2.57—3.48,and 1.83—3.80 t ha−1under the treatments C1NPK,C1NP,C0NPK,C0NP,C1N0,and C0N0,respectively(Fig.1-a).In the dry season the grain yield was in the ranges 2.71—5.85,2.12—6.15,2.08—5.01,2.32—4.13,1.40—4.92,and 1.03—4.04 t ha−1under the same treatments (Fig.1-b).The highest yield was found under the treatment C1NPK and varied over the ranges 2.70—6.42 and 4.47—5.99 t ha−1in the wet and dry seasons,respectively(Fig.1).There was a reduction in the yield in the year 1999 owing to a tropical cyclone that damaged the crop and incurred a severe loss in grain yield.In the wet season,there was a jump in grain yield in 1984,15 years after the initiation of the experiment because of the introduction of the high-yielding varieties Savitri,Pusa 2-21,IR 36,and Ratna to replace the varieties IR 8,Supriya,and Bala.
where S denotes μg P adsorbed g−1soil,C the equilibrium P concentration(μg P mL−1),b the Langmuir adsorption maximum (μg P g−1soil)and k the Langmuir bonding energy constant(mL μg−1).A plot of C/S versus C gives a straight line.The constants k and b were obtained from the intercept and slope,respectively.
(B)Freundlich equation:
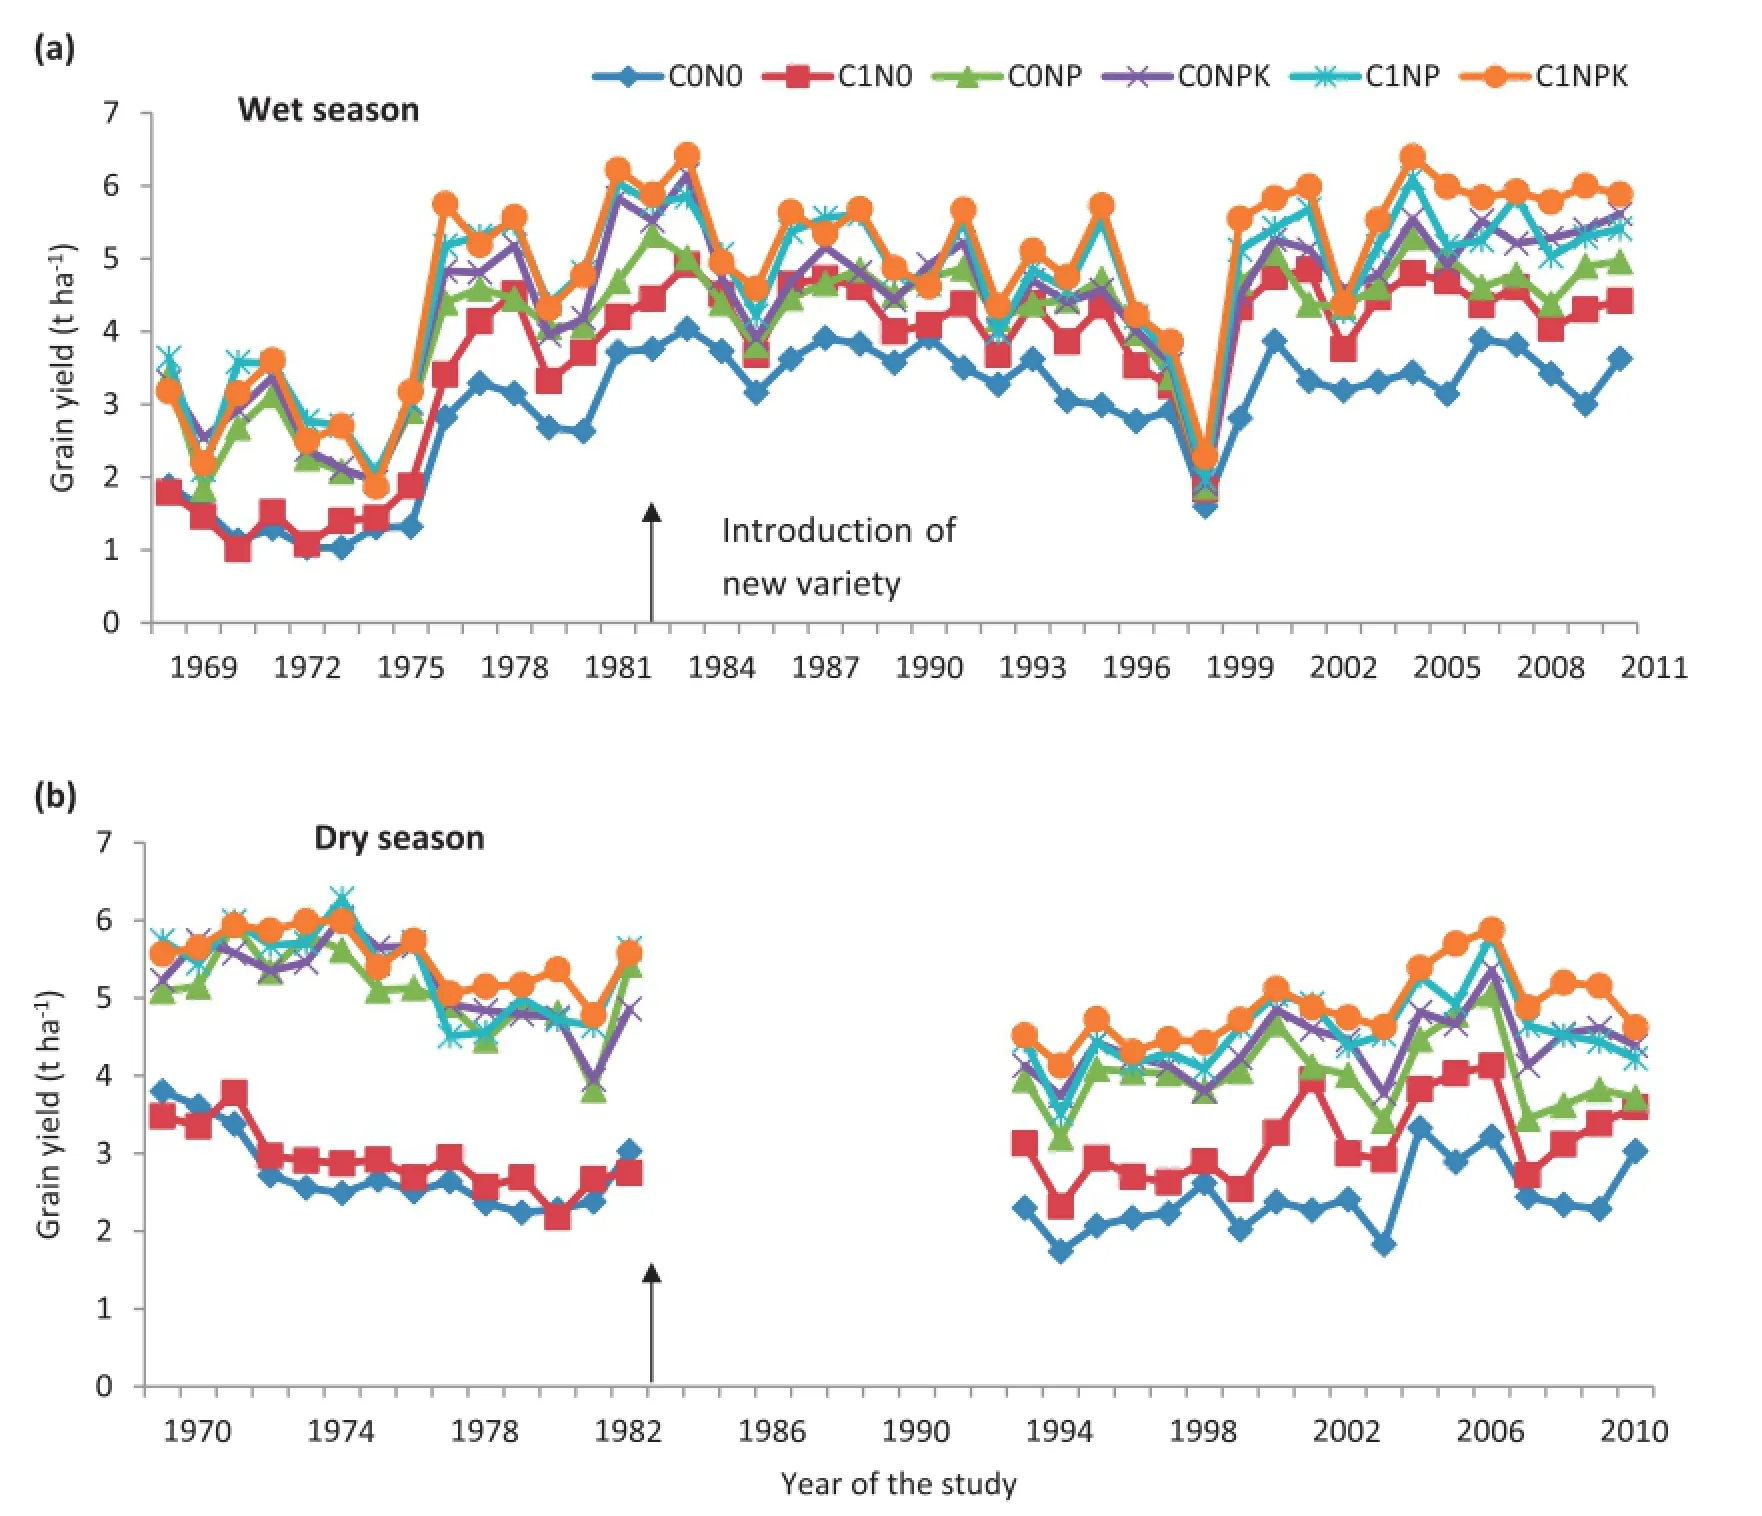
Fig.1-Temporal variation in grain yield(t ha−1)in(a)wet season(1969-2011)and(b)dry season(1970-2010)under six long-term fertilizer treatments.The arrow indicates the introduction of new high-yielding varieties.Arrow in Fig.1-b indicates introduction of new variety.
P uptake varied under different treatments in both wet seasons of 1969—2011 and dry seasons of 1970—2010(Fig.2). Grain P uptake also varied in both seasons,irrespective of treatment(Fig.2).A positive trend in P uptake under the C0NP,C0NPK,and C1NPK treatments was found but was not significant year wise.In contrast,no trend was found in the low-input treatments C0N0and C1N0.Grain P uptake varied in the ranges 2.9—12.2,2.9—16.3,6.0—17.2,5.7—20,5.8—19.2,and 5.2—20.8 kg ha−1under the treatments C0N0,C1N0,C0NP,C0NPK,C1NP,and C1NPK,respectively,during the wet seasons of 1969—2009(Fig.2-a).During the dry seasons of 1970—2009,grain P uptake was 4.8—7.1,4.3—9.9,9.1—15.2,8.2—16.2,9.7—15.4,and 9.5—16.9 kg ha−1under the same treatments(Fig.2-b).P uptake was highest under C1NPK in both wet and dry seasons.
The yield response to P fertilization suggests the importance of long-term fertilizer experiments to study the potential of soil nutrient supply capacity.In the present study,grain yield was significantly higher under the C1NPK treatment than under the other treatments.Similar trends were reported by Dawe et al.[24]and Ladha et al.[25]in a rice—wheat cropping system.In a rice—rice cropping system,a yield increase under C1NPK was also reported by Hafele et al.[26]. Indigenous nutrient supply,particularly of P and K,showed important effects on rice yields and fertilizer recovery rates in irrigated rice systems[27].The carbon contents under the C0N0,C1N0,C0NP,C0NPK,C1NP,and C1NPK treatments were 6.3,7.1,7.5,7.9,7.3,and 9.3 g kg−1,respectively.The N contents were 154,218,227,225,206,and 245 kg ha−1under these six treatments.The higher carbon and nitrogen content under C1NPK treatment led to increased microbial growth and higher yield in these treatments.Our long-term rice—rice system is self-sustaining,as it has the potential to store large amounts of carbon under flooded conditions as well as maintaining sustained yield over the years[28—30].We found that the grain yield under the C1N0treatment was lower than that under the other treatments except for the control.FYM appliedinthe wet seasonat therate of5 t ha−1was applied as a supplementary dose that was lower than the full dose of NPK applied inother treatments.This low input led to a reduction in grain yield compared to that under the other treatments.
GrainyieldandPuptakewerehigherundertheC0NP,C0NPK,and C1NPK treatments than under the low-fertilizer input treatments(C0N0and C1N0).There were significant differences in yield and uptake under C0N0,C1N0compared to the C0NP,C0NPK,and C1NPK treatments.Under both low-and high-input treatments,yield and P uptake were maintained for 35 years.This result indicates that a low level of grain yield and P uptake in the control was sustained for three decades.High yield and P uptake levels(in the C0NP,C0NPK,and C1NPK treatments)were maintained during the same time.This maintenance of yield and P levels is a unique characteristic of lowland submerged rice ecology in eastern India,and is due to the low rate of decomposition of organic matter in soil and inputs of C and other nutrients in the form of algae,weeds,and plant biomass.
Nitrogen application had a yield-increasing effect compared with the control,and the application of P significantly increased yields of rice compared with the P-omitted treatments.There was no significant effect of K application on rice yields,owing to the high inherent soil K levels in excess of crop K demand at present yield levels,a finding in agreement with those of other studies[27].The P uptake was significantly higher both in shoot and grain under the C1NPK treatment.In P-sufficient soils such as that of the present study,application of NPK alone or in combination with FYM led to a higher P uptake level than observed under the other treatments,as also reported by Singh et al.[7].
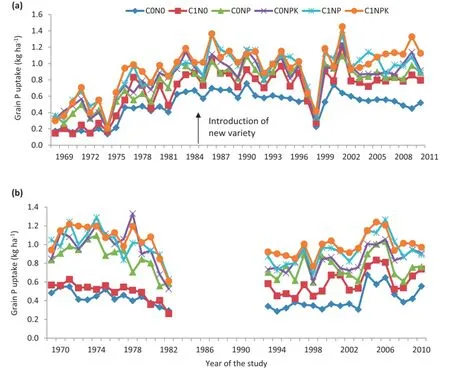
Fig.2-Temporal variation in grain P uptake(kg ha−1)in(a)wet season(1969-2011)and(b)dry season(1970-2010)under six long-term fertilizer treatments.Arrow in Fig.2-a indicates introduction of a new variety.
3.2.Soil available P and fractions of P
Soil available P varied significantly among the treatments during 1969—2009(Fig.3).The maximum P content was found under C1NPK and varied in the range 13.0—28.2 kg ha−1(Fig.3). Available P content varied in the ranges 10.3—13.7,13.0—15.6,13.0—18.8,13.0—21.2,13.0—27.3,and 13.0—28.2 kg ha−1under C0N0,C1N0,C0NP,C0NPK,and C1NP;respectively(Fig.3). SolublePandBrays'Pwereintherespectiveranges 7.0—12.0 mg kg−1and 9.9—33.7 mg kg−1among the treatments and were highest under C1NPK(Table 1).Three fractions of P were quantified from different treatments:Al—P,Fe—P,and Ca—P.The highest content of fractioned P was found in the form of Fe—P(Table 1).Each P fraction was highest under the C1NPK treatment and the lowest under the C0N0treatment.The contents of P in different fractions were in the ranges 53—94,72.1—181,and 51.0—116.5 mg kg−1in the form of Al—P,Fe—P and Ca—P;respectively,among the treatments.The largest amount of fractionated P was found under the C1NPK treatment,with values of 94,181,and 117 mg kg−1for Al—P,Fe—P,and Ca—P,respectively(Table 1).
Fractionation of Pi sheds light on soil Pi availability and Pi interconversion among different fractions and Olsen-P gives an indication of soil P availability[31].Accordingly,soil Pi has been partitioned into fractions including Ca—P(HCl extractable P),Fe—P,and Al—P.Sequential Pi fractionation for distinguishing labile (resin-extractable P and NaHCO3-extractable P)and more stable forms(Ca—P,Al—P,and Fe—P)of Pi has been established[14].In this study,among all soil P fractions,Fe—P was highest in all thetreatments.Among the six long-term treatments,where P fertilizers were applied for 42 years along with FYM and K,P fractions followed the trend Fe—P>Ca—P>Al—P.However,the application of P fertilizer along with NK and organic manure favors thefixation ofP equallyinFeandCasitesinsoil atnearly neutral pH(6.6)under flooded conditions.In contrast,where P fertilizer wasnot applied orwasapplied onlywith N,P fractions followed the trend Fe—P>Al—P>Ca—P.This difference may represent the promotion of soil acidification by N fertilization even in flooded soil,perhaps favoring the Al—P over the Ca—P fraction under the N and NP treatments.In the present study,the Pi fractions in the form of Ca—P,Fe—P,and Al—P were at the highest levels in the C1NPK treatment.Schmidt et al.[32]reportedthat fertilizerPandmanure appliedannually formany years resulted in accumulation of inorganic P and organic P fractions in soil.Comparing the treatments with and without P application at 0—15 cm depth,the increase in Fe—Pi concentrations was greater than that in Al—Pi concentrations.This difference was due to the NaOH-extractable inorganic P that servedasaprimarysinkforfertilizerPaddedtotropicalsoiland was also observed for continuous fertilization of soils with fertilizer P for 9 or more years under some cropping systems [33].Under the NPK treatment,plant P uptake resulted in a marked decrease in available soil P with time,possibly enhancing P release from sparingly soluble P forms because of a change in the balance between available P and sparingly soluble P[34].Phosphorus is an important plant nutrient neededforrealizingoptimumyieldsinagroecosystems including rice—wheat[35]and rice—rice.In most lowland rice soils,P availability initially increases on flooding[36],and rice may meet its P requirement from the residual P applied in the preceding season of cultivation.Drainage following submergence induces P deficiency,owing mainly to changes in the inorganic fractions[37].The availability of native P depends on the degree of reduction of soil,as rice grows under waterlogged conditions[35].

Fig.3-Temporal variation in soil P content(kg ha−1)under different long-term fertilizer treatments in the year 1969-2009.

Table 1-Effect of long-term use of inorganic fertilizers and farmyard manure on soluble-P,Brays'P,and different soil P fractions.
3.3.Phosphorus adsorption
The results indicated that the amount of P sorbed was higher under C0N0than under the other long-term fertilizer treatments(Fig.4).The long-term fertilizer experiment soils varied with respect to P adsorption behavior.Phosphorus adsorption data for different long-term fertilized soils were fitted to the Langmuir(R2:0.970—0.988)and Freundlich equations(R2: 0.933—0.983)(Table 2).The Langmuir P adsorption maxima (b)and bonding energy constant(k)showed a wide variation among treatments(Table 2).The values of the adsorption maxima,which are measures of the P adsorption capacities of soil,were highest under the C0N0treatment(8.19 μg P g−1),decreasedwithlevelsofPapplied,andwerelowest(3.02 μgPg−1)under C1NPK.Bonding energy,which is a measure of resistance to P release insoils,varied from0.320 to 0.560 mL μg−1(Table 2). The Freundlich constants a and n also showed wide variability in the different long-term fertilizer treated soils(Table 2).The constant a,which is a measure of the extent of P adsorption atthe unit equilibrium concentration,ranged from 8.93 to 10.16 μg g−1soil.The n values were highest(0.725 g mL−1)under C1NPK and lowest(0.674 g mL−1)under C1N0(Table 2).
The flux of P from the soil as well as the amount and type of water-soluble P sources applied to plant roots determine the bioavailability of P to growing plants.The intensity factor,the measure of P concentration in soil solution,is one of the major factors that governs this flux and is associated with P adsorption on the surface of soil colloids.Thus,P reactions and its retention in soil have important implications to plant growth and fertilizer use efficiency[38].The extent of adsorption is one of the important factors in P supply capacity of soil[7]and in fertilizer recommendations[8].The adsorption behavior of P in a soil system can be determined by analysis of adsorption data for various isotherms using equations such as the Langmuir,Freundlich,Brunauer—Emett—Teller(BET),and Temkin equations[8].These analyses give an idea of the adsorption capacity as well as the energy with which the nutrient is retained in the soil system.The amount of P adsorbed was higher under C0N0than under the other treatments.Higher adsorption in C0N0compared to rest of the treatments were ascribed to the presence of more exchange sites because of the 42-year stress on the soil P reserves for meeting crop requirements.The Olsen P content of C0N0was also lower than that of the fertilized soils,resulted in higher adsorption of P in C0N0soil[39].The NPK treatment either alone or in combination with FYM showed lower adsorbed P than the other treatments.Thus,an increase in the rates of long-term P fertilization led to marked reduction in P adsorption.Sharma et al.[40]also reported reduced P adsorption under continuous application of P during 11 cycles of maize—wheat crop rotation.It is interesting to note that P adsorption was lowest under the C1NPK treatment.This observation could be due to a relatively large amount of residual P in C1NPK[39].The application of FYM played a key role in keeping the applied P in a more available form and,consequently,in reducing P adsorption.Organic acid anions released during the decomposition of FYM accumulate in the rhizosphere and compete with orthophosphates for adsorption sites,thereby making more P available and decreasing P adsorption[41].
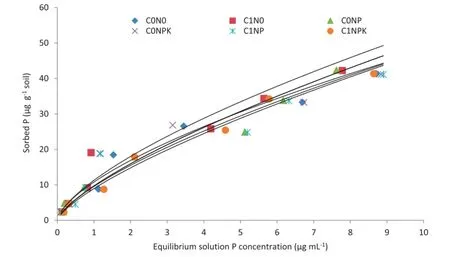
Fig.4-Phosphorus adsorption at different P substrate concentrations under different long-term fertilizer treatments over 40 years of study.

Table 2-Effect of long-term use of inorganic fertilizers and farmyard manure on adsorption(Langmuir and Freundlich)constants.
3.4.Phosphorus desorption
The practical reliability of using adsorption isotherms is questionable if this is not compared with the P desorptionbehavior of the soils.The degree of reversibility of the adsorption—desorption reaction cannot be ignored.The relationshipsbetweenPadsorptionanddesorptioninthe long-term experiment soils under investigation are presented in Fig.5.It is evident that only a fraction of the sorbed P was desorbed.The results showed that during the past 42 years,the quantity of P desorbed was far less under the C0N0than under the C1NPK treatment.The higher P desorption under NPK alone compared to that under FYM alone at higher P concentration may have be due to higher organic molecule-P complexes with FYM.The soils that adsorbed a high proportion of applied P during the adsorption reaction tended to release a lower proportion during the desorption reaction,and vice versa.
There is,however,a disagreement[42]as to whether or not adsorption—desorption reactions are reversible.If they are irreversible or partially reversible,the indication of the replenishing ability of soils by the P adsorption isotherms may be misleading.Distinct hysteresis in adsorption—desorption behavior of the long-term experiment soils suggests that overestimationoftheadsorption—desorptionreactionis unavoidable when the P adsorption isotherm is used to estimate the P-supplying ability of the soils to crops.Raven and Hossner[43]observed hysteresis in P adsorption and desorption processes in soils.In addition,the possibility of precipitation of the added P as sparingly soluble P compounds must not be overlooked.These results revealed that the amount of desorbed P was far less than that of adsorbed P and was of a relatively high order in the treatment C1NPK. Also,P desorption increased with an increase in added fertilizer P.The results explicitly indicate that the adsorption and desorption of applied P are inversely related and that soils that adsorb P the most readily release it the least readily into the soil solution.Thus,the plots receiving continuous P additions had higher potential to release P to meet the P requirements of the subsequent crops.These results indicate that the continuous addition of higher P doses and FYM decreased resistance to P release and thus increased the P supply in the soil.
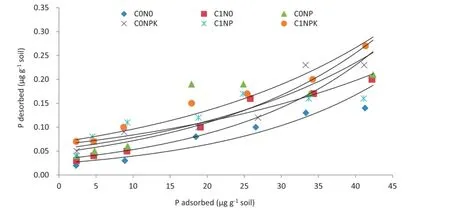
Fig.5-Phosphorus desorption at different P substrate concentrations under different long-term fertilizer treatments in 40 years of study.
4.Conclusion
Long-term balanced fertilization lowers the bonding energy and adsorption capacity for P in soil as well as increasing its desorption potential.This process in turn increases P availability to plants and leads to increased P uptake and yield sustainability.There is a future scope to quantify soil organic P pools in addition to inorganic fractions.There is also a scope for introduction of P-responsive rice varieties in this region that exploit the native soil P effectively,not only maintaining yield at higher levels but reducing the cost of external fertilizer application.
Acknowledgments
We acknowledge the valuable contributions in particular of Dr.Rabindra Nath Samantaray,Dr.Ashoka Kumar Mishra,Arvind Kumar Shukla and all ex-PIs and co-PIs of the long-term fertilityprojectformaintainingtheexperiments.Technicalhelp provided by Shyam Sundar Singh,Chandan Ojha,Brundaban Das,Subrat Ranjan Das,and Saroj Kumar Rout is also gratefully acknowledged.
R E F E R E N C E S
[1]P.E.Rasmussen,K.W.T.Goulding,J.R.Brown,P.R.Grace,H.H.Janzen,M.Korschens,Long-term agroecosystem experiments:assessing agricultural sustainability and global change,Science 282(1998)893—896.
[2]A.Takeda,H.Tsukada,M.Nanzyo,Y.Takaku,T.Uemura,S. Hisamatsu,J.Inaba,Effectof long-term fertilizer applicationon theconcentrationandsolubilityofmajorandtraceelementsin a cultivated Andisol,Soil Sci.Plant Nutr.51(2005)251—260.
[3]A.Rashid,Z.I.Awan,J.Ryan,Diagnosing phosphorus deficiency in spring wheat by plant analysis:proposed critical concentration ranges,Commun.Soil Sci.Plant Anal.36(2005)609—622.
[4]L.Khiari,L.E.Parent,Phosphorus transformations in acid light-textured soils treated with dry swine manure,Can.J. Soil Sci.85(2005)75—87.
[5]G.Ayaga,A.Todd,P.C.Brookes,Enhanced biological cycling of phosphorus increases its availability to crops in low-input sub-Saharan farming systems,Soil Biol.Biochem.38(2006)81—90.
[6]M.S.Erich,C.B.Fitzgerald,G.A.Porter,The effect of organic amendment on phosphorus chemistry in a potato cropping system,Agric.Ecosyst.Environ.88(2002)79—88.
[7]V.K.Singh,B.S.Dwivedi,A.K.Shukla,Y.S.Chauhan,R.L.Yadav,Diversificationof ricewith pigeon pea ina rice—wheat cropping system on a Typic Ustochrept:effect on soil fertility,yield and nutrient use efficiency,Field Crop Res.92(2005)85—105.
[8]N.S.Dhillon,T.S.Dhesi,B.S.Brar,Phosphatesorption-desorption characteristics of some Ustifluvents of Punjab,J.Indian Soc.Soil Sci.52(2004)17—22.
[9]M.S.Aulakh,S.S.Malhi,Interactions of nitrogen with other nutrients and water:effect on crop yield and quality,nutrient use efficiency,carbon sequestration,and environmental pollution,Adv.Agron.86(2005)341—409.
[10]S.Kuo,B.Huang,R.Bembenek,Effectsoflong-termphosphorus fertilization and winter cover cropping on soil phosphorus transformations in less weathered soil,Biol.Fertil.Soils 41 (2005)116—123.
[11]A.E.Cox,J.J.Camberato,B.R.Smith,Phosphate availability and inorganic transformation in an alum sludge-affected soil,J.Environ.Qual.26(1997)1393—1398.
[12]J.Liu,Transformation of Fertilizer Phosphorus in Calcareous Soil and Its Influencing Factors(PhD Dissertation)China Agriculture University,1999.
[13]P.Solis,J.Torrent,Phosphate fractions in calcareous Vertisols and Inceptisols of Spain,Soil Sci.Soc.Am.J.53(1989)462—466. [14]J.E.Yang,J.S.Jacobsen,Soil inorganic P fractions and their uptake relationships in calcareous soils,Soil Sci.Soc.Am.J. 54(1990)1666—1669.
[15]S.Buehler,A.Oberson,I.M.Rao,D.K.Friesen,E.Frossard,Sequential phosphorus extraction of a33P-labeled oxisol under contrasting agricultural systems,Soil Sci.Soc.Am.J.66 (2002)868—877.
[16]Y.X.Huang,Y.Z.Zhang,Y.B.Zou,Study on the fractionation of inorganic phosphates in some paddy soils of Hunan Province,Chin.Rice Res.Newsl.7(1999)8—9.
[17]B.B.Singh,J.P.Jones,Phosphorus sorption and desorption characteristics of soils as affected by organic residues,Soil Sci.Soc.Am.J.40(1976)389—394.
[18]F.S.Watanabe,S.R.Olsen,Test of an ascorbic acid method for determining phosphorus in water and NaHCO3extract from soil,Soil Sci.Soc.Am.J.29(1965)677—678.
[19]I.C.R.Holford,G.E.G.Mattingly,A model for the behavior of labile phosphate in soil,Plant Soil 44(1976)219—229.
[20]S.R.Olsen,L.E.Sommers,Phosphorus,in:A.L.Page,R.H. Miller,D.R.Keeney(Eds.),Methods of Soil Analysis,American Society of Agronomy,Madison,WI 1982,pp.403—430.
[21]S.C.Chang,M.L.Jackson,Fractionation of soil phosphorus,Soil Sci.84(1957)133—144.
[22]J.Murphy,J.P.Riley,A modified single solution method for the determination of phosphorus in natural water,Anal. Chem.Acta 27(1962)31—36.
[23]R.H.Bray,L.T.Kurtz,Determination of total,organic and availableformsofphosphorousinsoils,SoilSci.59(1945)39—45.
[24]D.Dawe,A.Dobermann,P.Moya,S.Abdulrachman,B.Singh,P.Lal,S.Y.Li,B.Lin,G.Panaullah,O.Sariam,Y.Singh,A. Swarup,P.S.Tan,Q.X.Zhen,How widespread are yield declines in long-term rice experiments in Asia?Field Crop Res.66(2000)175—193.
[25]J.K.Ladha,D.Dawe,H.Pathak,A.T.Padre,R.L.Yadav,B. Singh,Y.Singh,Y.Singh,P.Singh,A.L.Kundu,R.Sakal,A.P. Regmi,S.K.Garni,A.L.Bhandari,R.Amin,C.R.Yadav,E.M. Bhattarai,S.Das,H.P.Aggarwal,R.K.Gupta,P.R.Hobbs,How extensive are yield declines in long-term rice—wheat experiments in Asia?Field Crop Res.81(2003)159—180.
[26]S.M.Haefele,M.C.S.Wopereis,M.K.Ndiaye,S.E.Barro,M. Ould Isselrno,Internal nutrient efficiencies,fertilizer recovery rates and indigenous nutrient supply of irrigated lowland rice in Sahelian West Africa,Field Crop Res.80(2003)19—32.
[27]A.Dobermann,K.G.Cassman,C.P.Mamaril,J.E.Sheehy,Management of phosphorus,potassium and sulfur in intensive,irrigated lowland rice,Field Crop Res.56(1998)113—138.
[28]P.Bhattacharyya,A.K.Nayak,S.Mohanty,R.Tripathi,Mohammad Shahid,Anjani Kumar,R.Raja,B.B.Panda,K.S. Roy,S.Neogi,P.K.Dash,A.K.Shukla,K.S.Rao,Greenhouse gas emission in relation to labile soil C,N pools and functional microbial diversity as influenced by 39 years long-term fertilizer management in tropical rice,Soil Tillage Res.129(2013)93—105.
[29]P.Bhattacharyya,S.Neogi,K.S.Roy,P.K.Dash,A.K.Nayak,T. Mohapatra,Tropical low land rice ecosystem is a net carbon sink,Agric.Ecosyst.Environ.189(2014)127—135.
[30]A.Dobermann,P.C.Sta.Cruz,K.G.Cassman,Fertilizer inputs,nutrient balance,and soil nutrient-supplying power in intensive,irrigated rice systems.I.Potassium uptake and K balance,Nutr.Cycl.Agroecosyst.46(1996)1—10.
[31]Y.C.Gu,S.W.Qin,Phosphorus accumulation,transformation and availability under long-term application of phosphorus fertilizer,Chin.J.Soil Sci.29(1997)13—17.
[32]J.P.Schmidt,S.W.Buol,E.J.Kamprath,Soil phosphorus dynamics during seventeen years of continuous cultivation: fractionation analyses,Soil Sci.Soc.Am.J.60(1996)1168—1172.
[33]P.P.Motavalli,R.J.Miles,Soil phosphorus fractions after 111 years of animal manure and fertilizer applications,Biol. Fertil.Soils 36(2002)35—42.
[34]A.Sharpley,Phosphorus availability,in:M.E.Sumner(Ed.),Handbook of Soil Science,CRC Press,New York 2000,pp.18—37.
[35]A.Yadvinder-Singh,Dobermann Bijay-Singh,K.F.Bronson,C.S.Khind,Optimal phosphorus management strategies for wheat—rice cropping on loamy sand,Soil Sci.Soc.Am.J.64 (2000)1413—1422.
[36]F.N.Ponnamperuma,The chemistry of submerged soils,Adv. Agron.24(1972)29—96.
[37]I.R.Willet,The effects of flooding for rice culture on soil chemical properties and subsequent maize growth,Plant Soil 52(1979)373—383.
[38]K.Borling,E.Barberis,E.Otabbong,Impact of long-term inorganic phosphorus fertilization on accumulation,sorption and release of phosphorus in five Swedish soil profiles,Nutr. Cycl.Agroecosyst.69(2004)11—21.
[39]N.S.Varinderpal-Singh,B.S.Brar Dhillon,Influence of long-term use of fertilizers and farmyard manure on the adsorption—desorption behaviour and bioavailability of phosphorus in soils,Nutr.Cycl.Agroecosyst.75(2006)67—78.
[40]K.N.Sharma,H.Singh,A.C.Vig,Influence of continuous cropping and fertilization on adsorption and desorption of soil phosphorus,Fertil.Res.40(1995)121—128.
[41]M.J.Grinsted,M.J.Hedley,R.E.White,P.H.Nye,Plant-induced changesintherhizosphereofrape(Brassicanapusvar.Emerald)seedlings:I.pH change and the increase in phosphorus concentration in the soil solution,New Phytol.91(1982)19—29.
[42]R.E.White,A.W.Taylor,Reactions of soluble phosphates with acid soils:the interpretation of adsorption—desorption isotherm,J.Soil Sci.28(1977)314—328.
[43]K.P.Raven,L.R.Hossner,Sorption and desorption quantity-intensity parameters related to plant-available soil phosphorus,Soil Sci.Soc.Am.J.58(1994)405—410.
*Corresponding author.
E-mail address:pratap162001@yahoo.co.in(P.Bhattacharyya).
Peer review under responsibility of Crop Science Society of China and Institute of Crop Science,CAAS.
http://dx.doi.org/10.1016/j.cj.2015.03.009
2214-5141/©2015 Crop Science Society of China and Institute of Crop Science,CAAS.Production and hosting by Elsevier B.V.This is an open access article under the CC BY-NC-ND license(http://creativecommons.org/licenses/by-nc-nd/4.0/).
17 December 2014
杂志排行
The Crop Journal的其它文章
- Geographical distribution of GmTfl1 alleles in Chinese soybean varieties
- Partitioningbetweenprimaryandsecondarymetabolism of carbon allocated to roots in four maize genotypes under water deficit and its effects on productivity
- Crop rotation-dependent yield responses to fertilization in winter oilseed rape(Brassica napus L.)
- Genomewide association study of Aegilops tauschii traits under seedling-stage cadmium stress
- Genetic diversity and DNA fingerprinting in jute (Corchorus spp.)based on SSR markers
- Field evaluation of durum wheat landraces for prevailing abiotic and biotic stresses in highland rainfed regions of Iran
