Cavitation Bubble Luminescence in Cone-Type Throttle Valve
2015-08-11ZHANGJianJIANGJihai姜继海BAIYunfeng白云峰LIYanjie李艳杰
ZHANG Jian(张 健),JIANG Ji-hai(姜继海),BAI Yun-feng(白云峰),LI Yan-jie(李艳杰)
1 School of Mechatronics Engineering,Harbin Institute of Technology,Harbin 150080,China
2 School of Mechanical Engineering,Shenyang Ligong University,Shenyang 110159,China
Cavitation Bubble Luminescence in Cone-Type Throttle Valve
ZHANG Jian(张 健)1*,JIANG Ji-hai(姜继海)1,BAI Yun-feng(白云峰)2,LI Yan-jie(李艳杰)2
1 School of Mechatronics Engineering,Harbin Institute of Technology,Harbin 150080,China
2 School of Mechanical Engineering,Shenyang Ligong University,Shenyang 110159,China
In light of the light emission from cavitation bubbles under certain conditions, the phenomena ofthe cavitation bubble luminescence in the hydraulic cone-type throttle valve is focused in this paper.Firstly,the software of automatic dynamic incremental nonlinear analysis(ADINA)is applied to studying the flow field of the flow channel of the cone-type throttle valve.And the pressure distribution of the valve flow channel is obtained.The easyhappening area of cavitation in the cone-type throttle valve is also found out by ADINA.Then,the experimental research on the conetype throttle valve is carried out in this paper.The changing law of the hydraulic oil temperature in the corresponding region under different system pressureand thebackpressurecondition are experimentally researched. The relationship between the luminescence intensity and the cavitation intensity,the pressure,and the temperature are also studied.Finally,a summary of the causal relationship between the luminescence and cavitation in the cone-type throttle valve,the cavitation effect on the hydraulic oil temperature,and the method for the inhibition of cavitation bubble luminescence are presented.The results show that the light intensity increases with the increase of the cavitation intensity,and the luminescence can be inhibited by the increase of backpressure.
hydraulic;cone-type throttle valve;cavitation;automatic dynamic incremental nonlinear analysis(ADINA);bubble luminescence
Introduction
Cavitation is a significant engineering phenomenon that occurs in fluid machinery,fuel injectors,marine propellers,nozzles,and underwater bodies,etc[1].There have been more than 100 years since cavitation was studied[2-3].Cavitation usually significantly causes performance loss in the hydraulic system.Cavitation can cause a decrease in the hydraulic pump flow rate,lead the hydraulic pump and valve to produce vibration and noise,and cause cavitation erosion.Serious cavitation erosion may lead to the performance failure of the hydraulic components finally[4-6].The inception of cavitation occurs when the local pressure is below the corresponding saturated vapour pressure of the working liquid at a specific temperature due to many reasons in the hydraulic system,such as the increase of the saturated vapour pressure of the hydraulic oil induced by temperature,the pressure drop induced by the valve closed quickly,and the increase of the hydraulic oil velocity[7-8].The phenomena of cavitation include the process of the bubble inception,the bubble growth,and the bubble collapse.One of the most complex and mysterious effects in the whole process of cavitation is the light emission from cavitation bubbles[2].
The process of the bubble collapse can cause energy concentration,leading to the creation of a hot spot with temperatures of up to tens of thousands of Kelvin.This kind of hot spot finally causes the bubble luminescence[9].In recent years,considerable research on the mechanism of the cavitation bubble luminescence has been conducted by researchers.Gaitan et al.[10]studied sonoluminescence and bubble dynamics for a single and stable cavitation bubble.They pointed out that the bubble internal temperature needed ranges from 2000 K to 3000 K for the bubble luminescence.Barber et al.[11]presented a detailed description of the generation mechanism of sonoluminescence. Thomas et al.[12]pointed out the relationship between the change of bubble radius and bubble sonoluminescence.Li[13]pointed out that the optically thin thermal emission model was unable to match with experimental data mainly due to the reduced temperatures in the bubble.Hong et al.[14]carried out parameters estimation for gas in the bubble sonoluminescence.An[15]found that the mechanism of the cavitation bubble luminescence was the luminescence process of the gas with high velocity,high pressure and high density.Hatanaka[16]studied the sonoluminescence,sonochemistry,and bubble dynamics of the single bubble cavitation.Cui et al.[17]studied the phenomena of sonoluminescence in ethanol aqueous solutions.Zhou et al.[18]researched on the characteristic spectra of the single-bubble sonoluminescence in the rare-earth salt aqueous solutions.An[19]also investigated the spectrum of multi-bubble sonoluminescence in sulfuric acid.Rooze et al.[9]studied the single-bubble and multi-bubble sonoluminescence and analyzed the hot spot caused by bubble collapse.
However,there are only a few researches on the cavitation bubble luminescence in the hydraulic system.And the typical problem of the hydraulic system is cavitation.The hydraulic valve is the main position of producing cavitation in the hydraulic system.Bubble luminescence can occur at the hydraulic valve port,because plenty of the cavitation bubbles collapse at the valve port.The cone-type throttle valve is chosen in this paper to study the phenomena of the cavitation bubble luminescence at the valve port.And the influencing factors of the cavitation bubble luminescence are also analyzed in this paper.The research results in this paper can be used as reference for the research on cavitation bubble luminescence in the hydraulic system.
1 Finite Volume Method Simulation
To investigate the cavitation bubble luminescence in the cone-type throttle valve,the software of ADINA is applied to analyzing the fluid field condition of the valve flow channel in this paper.As the area of the cross section obviously decreases when the hydraulic oil flows through the valve port,the flow velocity will increase obviously and the flow will develop turbulence.Therefore the standard k-ε turbulence model is used in this paper.The sparse solver is used to simulate.The convergence precision of simulation is set to 0.001.
1.1 Basic equation
The standard k-ε turbulence model is


where,ρ is the mixture density(kg/m3);k is turbulent kinetic energy(kg·m2/s2);ε is turbulent kinematic dissipation rate (m2/s3);U is hydraulic oil velocity vector matrix(m/s);μtis turbulent viscosity(Pa·s);S is average strain rate tensor;t is time(s).
The turbulent viscosity is

the coefficients Cμ,σk,σε,C1εand C2εin Eq.(1)-Eq.(3) are adjustable constants;their values are Cμ=0.09,σk=1,σε=1.3,C1ε=1.44 and C2ε=1.92[20].
In ADINA the turbulent kinetic energy k is

where U is the hydraulic oil velocity(m/s);L is the characteristic length(m);the value of L is equal to the pipe diameter;k is chosen as 1.5(0.05U)2in this paper.
The cavitation number is defined as

where poutis the outlet pressure(Pa);pinis the inlet pressure (Pa);pvapis the vaporization pressure of hydraulic oil.
The relationship between mixture density and vapor mass fraction is

where fvis the vapor mass fraction;ρvis the vapor density(kg/ m3);ρlis the hydraulic oil density(kg/m3).
1.2 Simulations
Figure 1 shows the valve core structure of the cone-type throttle valve.Figure 2 shows the valve flow channel condition.
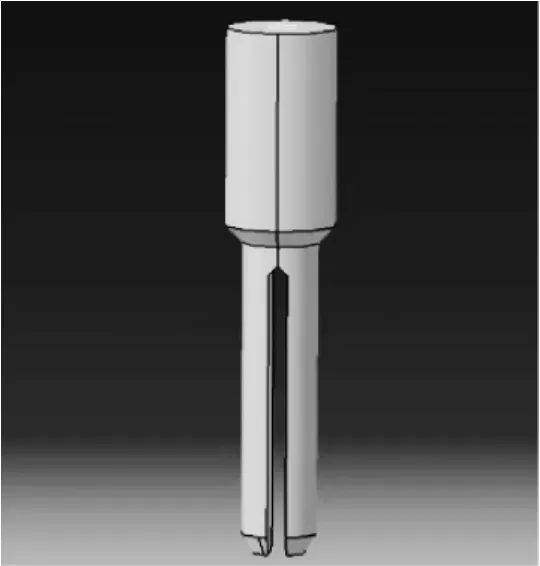
Fig.1 The structure of the valve core
The antiwear hydraulic oil L-HM32 is chosen as the working medium in this paper.The valve body has central symmetry;therefore,half of the body is chosen to carry out for mesh generation,to reduce computation and the computation time.There are five kinds of working conditions chosen for simulations.The openings of the valve are 2 mm,3 mm,5 mm,7 mm,and 10 mm,respectively.The simulation parameters are shown in Table 1.

Fig.2 The schematic diagram of the flow channel of the valve body

Table 1 The simulation parameters
Figure 3 shows the flow velocity distribution of the valve flow channel under five kinds of valve openings(2 mm,3 mm,5 mm,7 mm,and 10 mm).
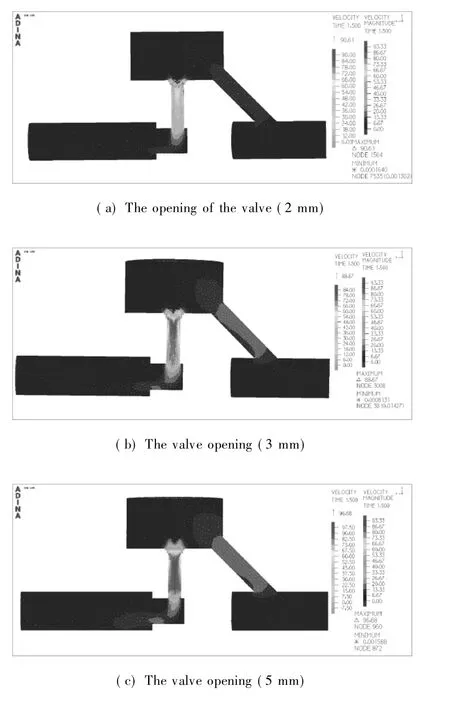
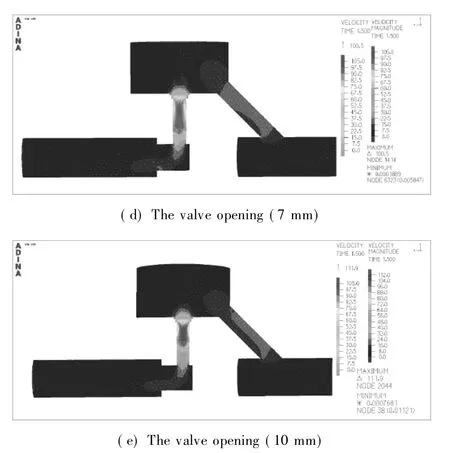
Fig.3 The flow velocity distribution of the valve flow channel
According to Fig.3,the two positions can be derived from the place where the sudden increase of the flow velocity happened due to the sharp change of the cross sections.The two positions are the top and the bottom of valve core opening.Figure 4 is the schematic diagram of the top and the bottom of the valve core.According to Bernoulli equation,the higher the flow velocity is,the greater the decrease is in pressure.Figure 3 also shows that the highest flow velocity at the valve core usually increases with the increase of the valve opening.Meanwhile,the region of the valve core opening generally has a higher flow velocity.As a result,the region of the valve core opening generally has a higher flow velocity,showing that the region of the valve core opening has larger pressure decrease.

Fig.4 The schematic diagram of the top of valve core and the bottom of valve core
The flow velocity distribution is discussed when the valve opening is 2 mm.Figure 3 demonstrates that the maximum flow velocity at the valve opening of 2 mm is higher than the valve opening of 3 mm.But the average of the flow velocity when the valve opening is 2 mm is lower than the average of the flow velocity when the valve opening is 3 mm.The lower valve opening of 2 mm results in a considerable decrease of the fluid flow through the valve core in the cross section,which causes a sharp increase in the fluid flow velocity.However,the flow rate is also low in this condition.Therefore,the whole of the flow velocity when the valve opening is 2 mm is lower than the average of the flow velocity when the valve opening is 3 mm,and the highest flow velocity when the valve opening is 2 mm is higher than the highest flow velocity when the valve opening is 3 mm.
Figure 5 shows the pressure distribution of the valve flow channel under five kinds of the valve openings(2 mm,3 mm,5 mm,7 mm,and 10 mm),indicating that there is a lower pressure at the bottom of the valve core.It shows that cavitation occurs more strongly at the bottom of the valve core.The results are basically in accordance with Fig.3 that shows the flow velocity distribution of the valve flow channel.From the pressure nephogram of Fig.5,it is derived that the larger the valve opening,the larger pressure decrease at the region of the valve core opening under the same inlet pressure.Namely,the cavitation is more significant.Because,after the fluid flows through the lower pressure zone at the bottom of the valve core,the fluid pressure increases rapidly,large numbers of the cavitation bubbles will collapse rapidly and finally disappear.Most of the bubbles observed are concentrated at the bottom of valve core.
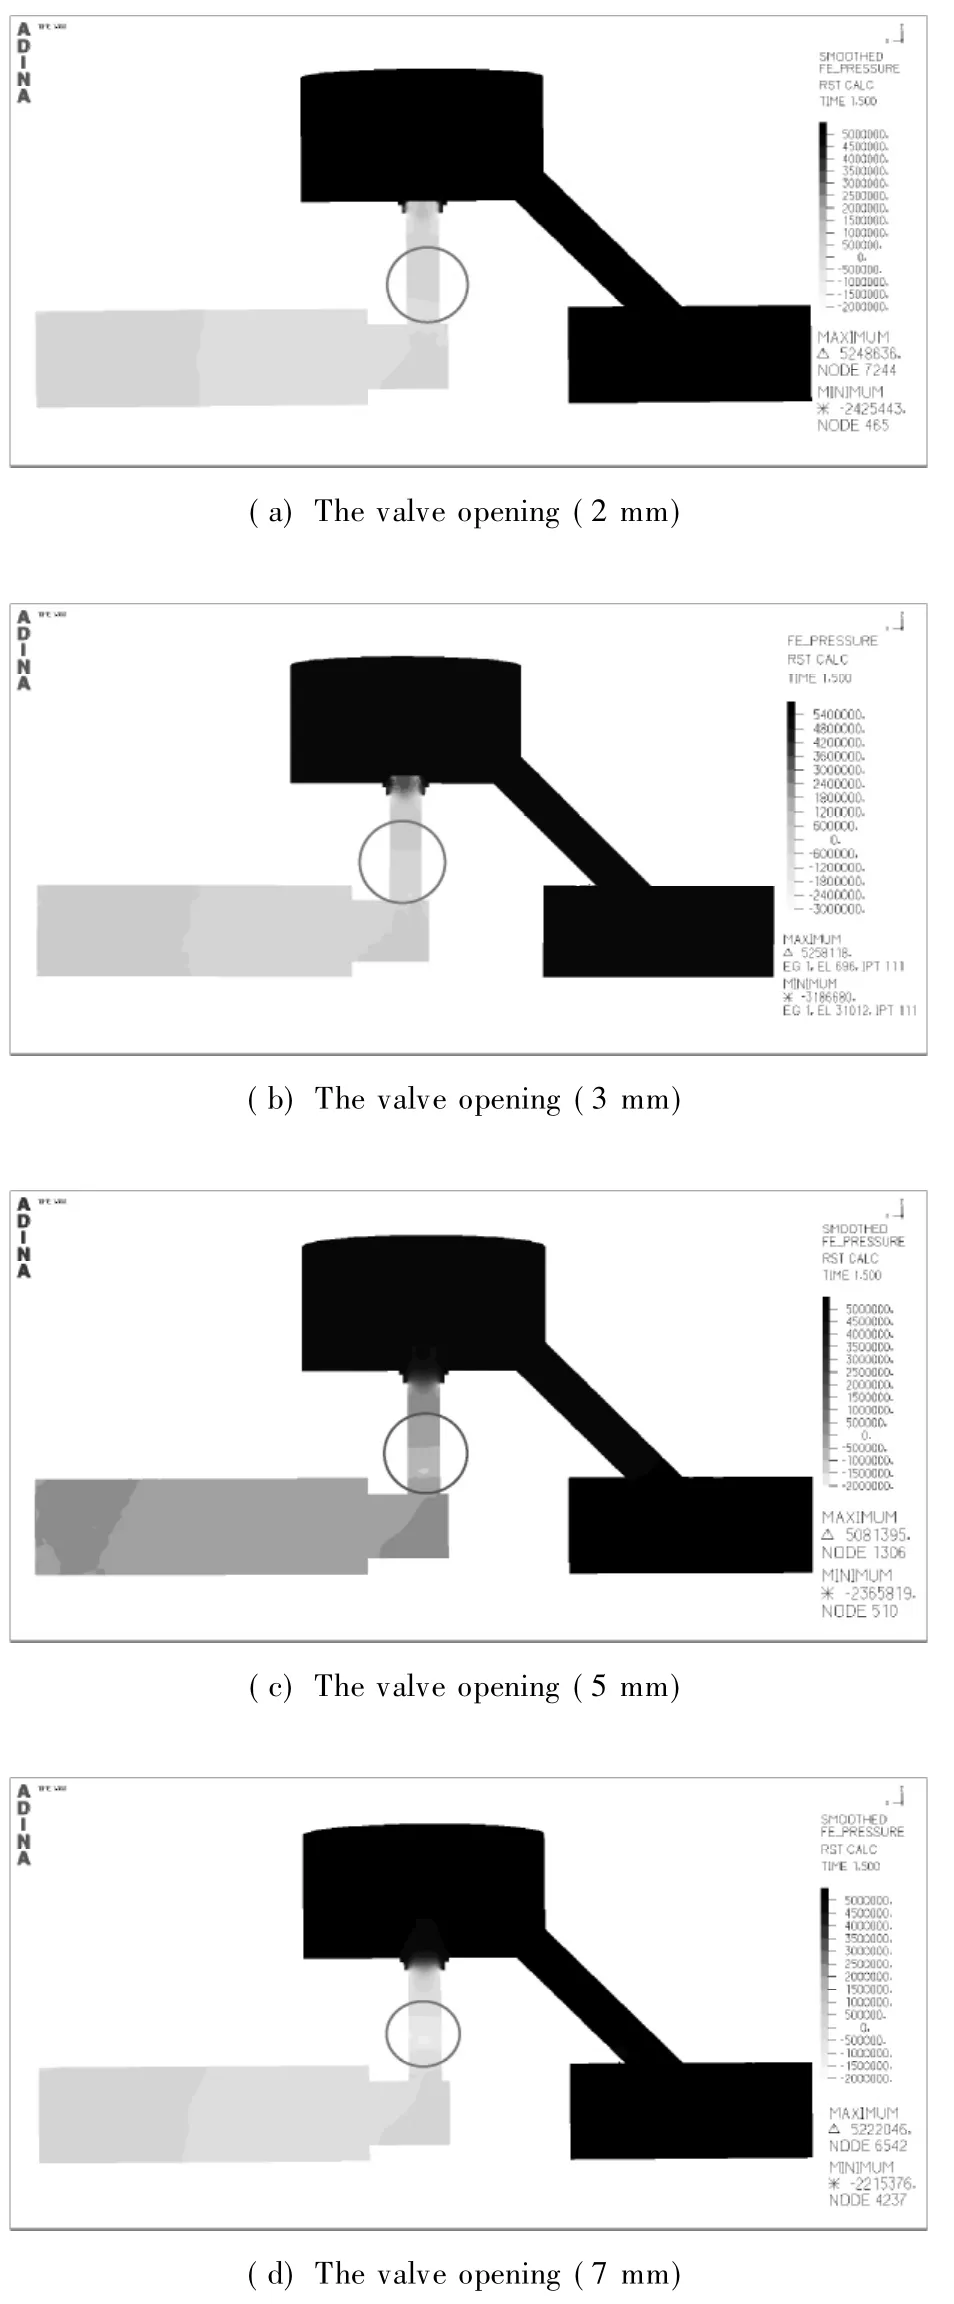

Fig.5 The pressure distribution of valve flow channel
2 Experiments
2.1 Experimental principle
To observe the phenomena of the bubble luminescence in the hydraulic throttle valve and really reflecting the flow channel condition of the practical industrial valve,the polymethyl methacrylate(PMMA)is chosen to build the model valve.The flow channel of the model valve is designed as the flow channel of the real valve.The principle of experimental system is shown in Fig.6.
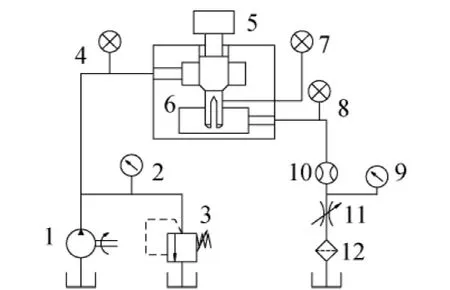
Fig.6 The principle of experimental system
The opening of the valve can be adjusted by Button 5.The inlet pressure and the backpressure of the model valve achieve adjustment through relief valve 3 and throttle valve 11.The pressure values can be the real time displayed on pressure meters 2 and 9.Pressure transducers 4 and 8 collect the pressure in the front of the model valve and the pressure in the planar straight flow channel of the model valve,respectively.Either Pressure transducer or temperature transducer 7 is used to measure the pressure or temperature in the vertical flow channel of the model valve.Flow transducer 10 collects the flow rate of the model valve.The pressure,temperature,and flow rate data are transferred into computer by data acquisition system.
The ambient temperature of experiment is about 20℃.The precision of pressure transducer is 0.1%.The precision of temperature transduceris0.5%.The precision offlow transducer is 0.5%.The nominal pressure of vane pump is 6.3 MPa.The nominal flow rate of vane pump is 25 L/min.
The parameters of the experimental system are shown in Table 2.

Table 2 The parameters of experimental system
The experimental table is shown in Fig.7.

Fig.7 Experimental system
2.2 Analyses of the experimental results
Figures 8-10 show the phenomena of cavitation under the valve opening of 7 mm,10 mm and 12 mm;the system pressure is 1-5 MPa;the backpressure is 0,respectively.
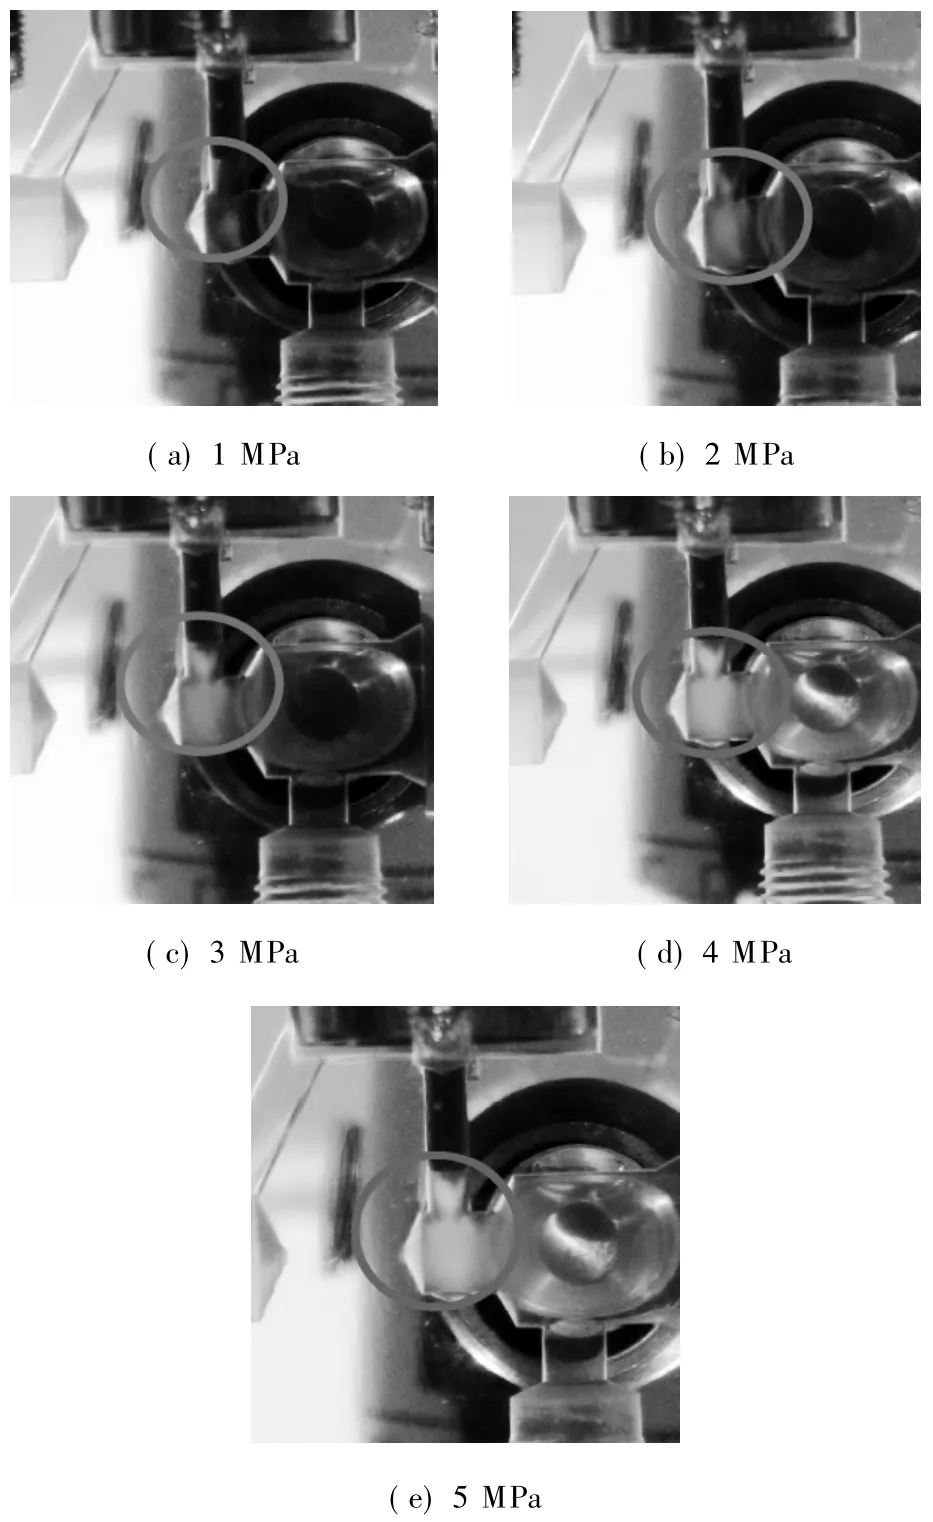
Fig.8 The cavitation pictures under the valve opening of 7 mm(the blue light is found in(d)and(e))

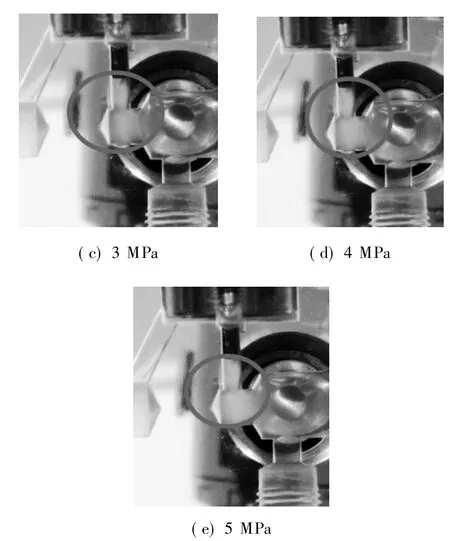
Fig.9 The cavitation pictures under the valve opening of 10 mm(the blue light is found in(d)and(e))

Fig.10 The cavitation pictures under the valve opening of 12 mm(the blue light is found in(b)-(e))
From Figs.8-10,it is derived that with the increase of the system pressure,the phenomenon of cavitation becomes more and more obvious;the cavitation mainly appears at the bottom of the valve core,and the cavitation intensity is gradually weakened at the downstream.The results coincide with the simulation results.It is also derived that with the increase of the valve opening,the cavitation intensity becomes more and more stronger,and the blue light becomes more and more obvious.
Figures 8-10 show that the intensity of the blue light increases with the number of the cavitation bubbles.That is to say,the phenomenon of luminescence is closely related with cavitation.
In order to further verify the causal relationship between the phenomenon of luminescence and cavitation in the throttle valve, the phenomenon of cavitation under different backpressure is investigated in this paper.Figures 11-13 show the cavitation pictures under the backpressure from 0 to 0.5 MPa at the valve openingof 7 mm,10 mm,and 12 mm,respectively.
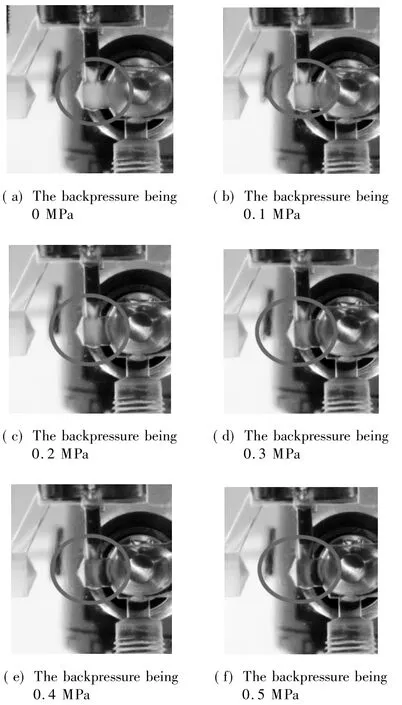
Fig.11 The cavitation pictures under different backpressures at the valve opening of 7 mm(the blue light disappears in(f))
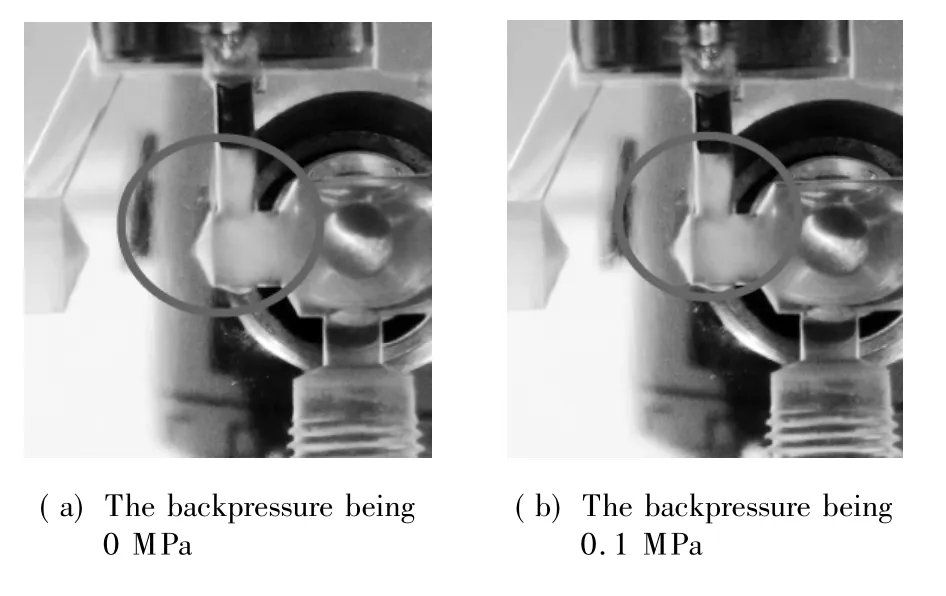
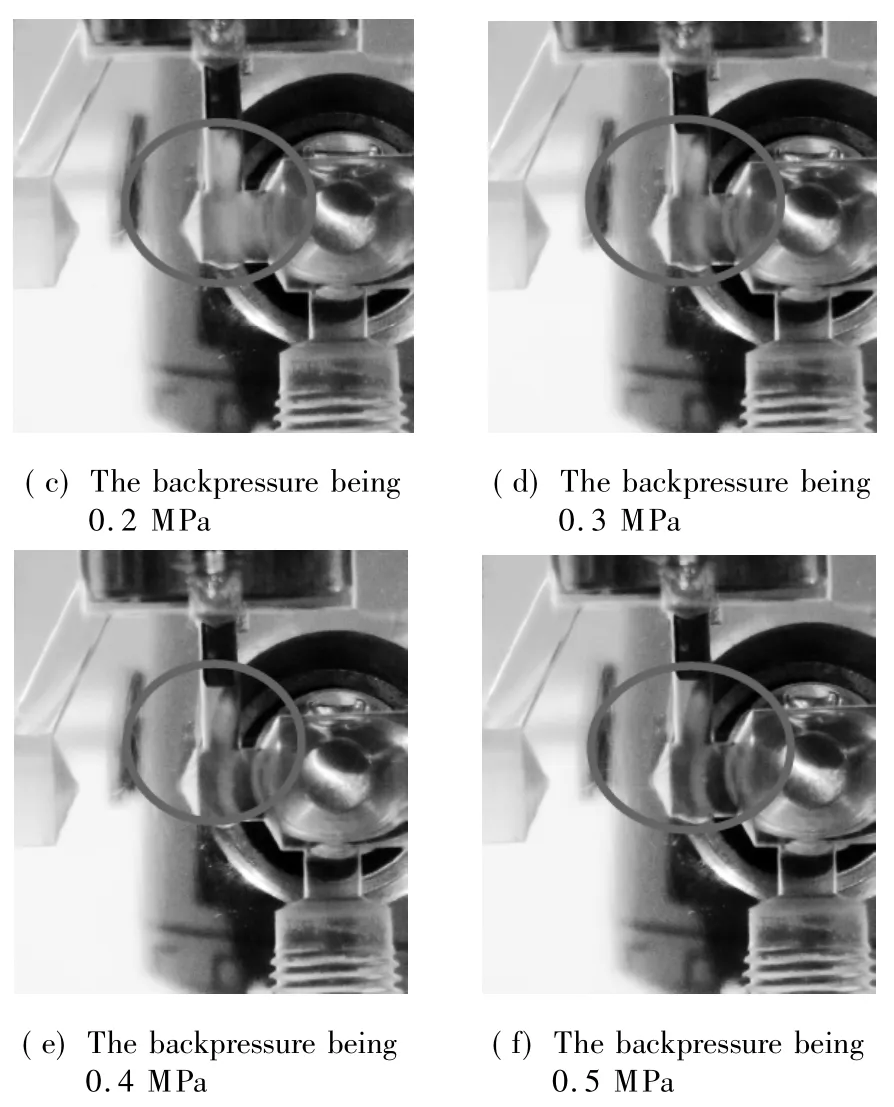
Fig.12 The cavitation pictures under different backpressures at the valve opening of 10 mm(the blue light disappears in(f))

Fig.13 The cavitation pictures under different backpressure at the valve opening of 12 mm(the blue light is found in(a)-(f))
Figures 11-13 show that when the backpressure increases,the cavitation intensity decreases gradually because the pressure difference decreases gradually at the valve core.The blue light intensity is also gradually weakened with the decrease of the cavitation intensity.In other words,the production of the blue light is closely related to the cavitation.The blue light should be a phenomenon of the cavitation bubble luminescence which happens when cavitation bubbles collapse with the pressure increase,and the collapse of bubbles produces the instantaneous rise of temperature.
The collapse of plenty of cavitation bubbles can cause cavitation erosion at the valve core.The cavitation erosion of the valve core is obtained in this paper.Figure 14 presents the valve cores that produce the cavitation erosion.

Fig.14 Cavitation erosion of the valve core
Figure 14 shows that the part of the cavitation erosion of the core occurs near the bottom of the valve core.It also shows that the bottom of the valve core has a very strong cavitation and plenty of bubbles are collapsed,providing an indirect proof that the production of the blue light has a close causal relationship with the bubble collapse.
To verify the relationship between the phenomenon of luminescence in the throttle valve and the cavitation,the change of the pressure and temperature near the bottom of the valve core is discussed when the opening value is 7 mm.The valve openings of 10 mm and 12 mm are measured,respectively.Figure 15 shows that,when the system pressure is 5 MPa,the change of the pressure at the bottom of the valve core under the backpressure is adjusted from 0 to 0.5 MPa.Figure 16 suggests that,when the system pressure is 5 MPa,the change of the pressure difference between the front valve and the bottom of the valve core under the backpressure is adjusted from 0 to 0.5 MPa.Figures 17-18 show the change of the temperature at the bottom of the valve core with 7 mm opening of the valve under the system pressure adjusted from 1 to 5 MPa and from 5 to 1 MPa,respectively.Figure 19 shows the position between the temperature measuring point and the valve core when the opening of valve is 7 mm.Figure 20 shows,when the opening of the valve is 7 mm,the change of temperature at the bottom of the valve core with the backpressure under the system pressure is 5 MPa.The position relationship between the valve core and the temperature transducer under the valve openings of 10 mm and 12 mm is shown in Fig.21,where the temperature transducer has a direct contact with plenty of cavitation bubbles.Figures 22-23 show that the change of the temperature at the bottom of the valve core under the system pressure is adjusted from 1 to 5 MPa and 5 to 1 MPa when the opening of the valve is 10/12 mm,respectively.Figure24 showsthe change ofthe temperature atthe bottom ofthe valve core with the backpressure under the system pressure being 5 MPa when the opening of the valve is 10/12 mm.

Fig.15 The pressure at the bottom of valve core change with backpressure under different valve openings
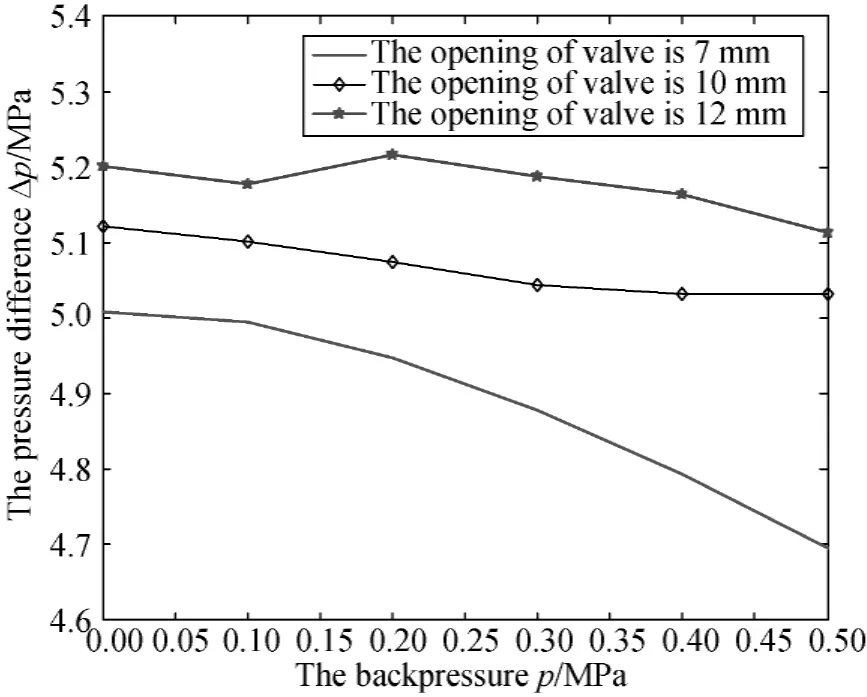
Fig.16 The change of the pressure difference between the front valve and the bottom of the valve core with the backpressure under different valve openings
From Figs.15 and 16,it is derived that the pressure near the bottom of the valve core has a gradual decrement trend with the increase of the backpressure.And the pressure difference between the front valve and the bottom of the valve core also has a gradual decrement trend with the increase ofthe backpressure.The cavitation intensity is gradually decreased with the increase of the backpressure,and the pressure near the bottom of the valve core is gradually decreased with the increase of the opening of the valve.Namely,the phenomenon of cavitation tends to be strong with the increase of the opening of the valve.

Fig.17 The change of temperature at the bottom of the valve core under the system pressure adjusted from 1 to 5 MPa with the valve opening of 7 mm
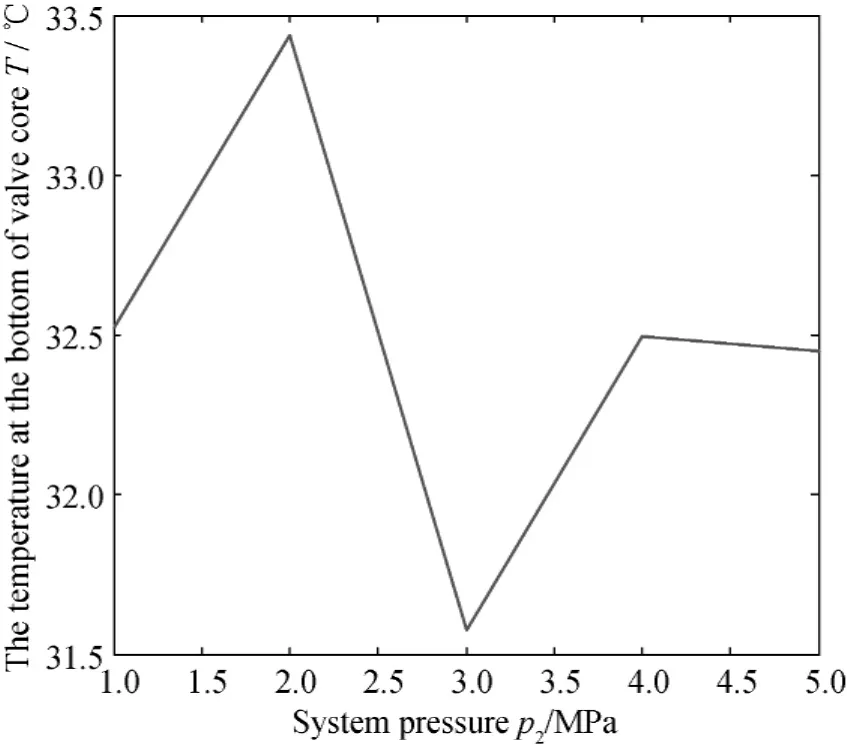
Fig.18 The change of temperature at the bottom of the valve core under the system pressure adjusted from 5 to 1 MPa with the valve opening of 7 mm
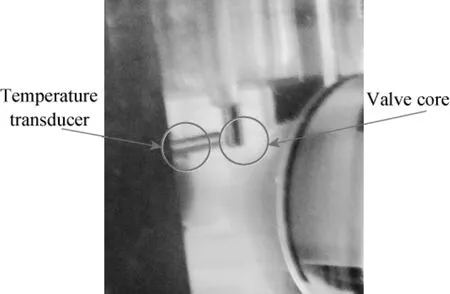
Fig.19 The position relationship between temperature transducer and valve core under the valve opening of 7 mm
From Figs.17 and 18,it is derived that the temperature at the bottom of the valve core obviously changes with the change of the pressure.When the system pressure is 1-2 MPa,a spot of bubbles occurs.Because of the inception of bubbles,the hydraulic oil temperature is gradually decreased.When the system pressure is 3 MPa,the hydraulic oil temperature has the lowest value.Subsequently,the bubbles continuously collapse which causes the increase of hydraulic oil temperature.Under this condition,the temperature measuring point is obstructed by the valve core when the opening of valve is 7 mm,so the temperature transducer does not have a direct contact with bubbles.Figure 18 shows that the hydraulic oil has a higher temperature when the system pressure is 2 MPa.In this case,the bubbles may collapse near the temperature transducer which causes the partial rise of temperature.The general trend of Fig.18 is consistent with that in Fig.17.
From Fig.20,it is derived that the temperature at the bottom of the valve core with the backpressure increases at first and then decreases.It is because,with the increase of the backpressure,the collapse of the bubbles is more concentrated,and the effect of the bubble collapse on the hydraulic oil temperature is strengthened,the hydraulic oil temperature with the backpressure continues to increase.Meanwhile,the increase of the hydraulic oil temperature is also induced by the increase of the flow resistance which is caused by the increase of the backpressure.Subsequently,the pressure difference decreases with the increase of the backpressure which causes the decreasein the cavitation intensity,as shown in Fig.11;the hydraulic oil temperature begins to decrease.
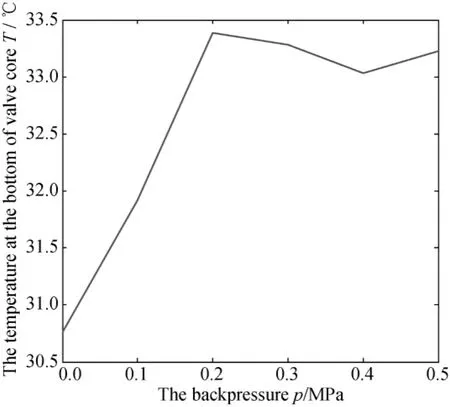
Fig.20 The change of temperature at the bottom of valve core with backpressure under the system pressure of 5 MPa when the opening of valve is 7 mm

Fig.21 The position relationship between the temperature transducer and the valve core under the valve openings of 10 mm and 12 mm

Fig.22 The change of the temperature at the bottom of the valve core under the system pressure adjusted from 1 to 5 MPa with the opening of the valve being 10/12 mm
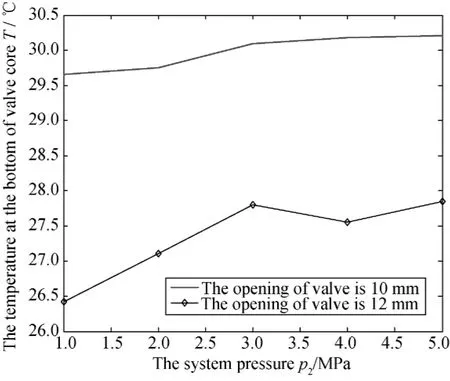
Fig.23 The change of the temperature at the bottom of the valve core under the system pressure adjusted from 5 to 1 MPa with the valve opening of 10/12 mm

Fig.24 The change of temperature at the bottom of valve core with backpressure under system pressure is 5 MPa when the opening of valve is 10/12 mm
From Figs.22 and 23,it is derived that the temperature at the bottom of the valve core basically has an increasing trend.And from Figs.9 and 10,it is derived that cavitation intensity is gradually strengthened with the increase of the system pressure.That is to say,the change of the temperature at the bottom of the valve core has a close relationship with the cavitation.It is also derived that,with the increase of blue light intensity,the cavitation temperature also increases.From Fig.24,it is derived that the temperature at the bottom of the valve core has some increase with the increase of the backpressure in the initial stage.It is because,with the increase of backpressure,bubbles collapse initially,and the bubbles release thermal energy at the concentration region. In addition, the increase of the backpressure causes the increase of the flow resistance.This increasing contributes to the increase of the flow loss,resulting in the increase of the hydraulic oil temperature.Meanwhile,Figs.11 and 12 show that,with the decrease of the cavitation intensity,the blue lightintensity also decreases, which demonstrates that the blue light has a close relationship with the cavitation intensity.
The experimental results show that the phenomenon of luminescence has a relationship with the cavitation in the throttle valve.The blue light is induced by the cavitation bubble collapse.And the intensity of blue light is directly affected by the cavitation intensity.The higher the cavitation intensity is,the higher the intensity of blue light is.
3 Conclusions
With respect to the luminescence in the cone type throttle valve,simulations and experiments are performed in this paper.The following conclusions are drawn.
(1)The phenomenon of the cavitation in the cone-type throttle valve mainly occurs near the bottom of the valve core,and the cavitation erosion can be found in this region.
(2)With the increase of the cavitation intensity,blue light is emitted from the region of the cavitation,and its intensity increases with the increase of the cavitation intensity.
(3)With the occurrence of the cavitation,because the cavitation bubbles need to absorb heat from hydraulic oil,the hydraulic oiltemperature decreasesin theregion ofthe cavitation inception.In this region,the cavitation produces plenty of bubbles.Because of the increase of hydraulic oil pressure atthe downstream,the cavitation bubbleswill collapse,and the bubbles can release heat to hydraulic oil.So the hydraulic oil temperature increases with the increase of the cavitation intensity.
(4)The increase of the system backpressure can inhibit the cavitation bubble luminescence.
[1]Goncalvès E.Numerical Study of Expansion Tube Problems: Toward the Simulation of Cavitation[J].Computers&Fluids,2013,72:1-19.
[2] Margulis M A,Margulis I M.Luminescence Mechanism of Acoustic and Laser-Induced Cavitation[J].Acoustical Physics,2006,52(3):283-292.
[3]Lind S J,Phillips T N.Bubble Collapse in Compressible Fluids Using a Spectral Element Marker Particle Method.Part 2.Viscoelastic Fluids[J].International Journal for Numerical Methods in Fluids,2013,71(9):1103-1130.
[4]Luo X W,Wei W,Ji B,et al.Comparison of Cavitation Prediction for a Centrifugal Pump with or without Volute Casing[J].Journal of Mechanical Science and Technology,2013,27 (6):1643-1648.
[5]Kim S,Murrenhoff H.Measurement of Effective Bulk Modulus for Hydraulic Oil at Low Pressure[J].Journal of Fluids Engineering-Transactions of the ASME,2012,134:0212012.
[6]Zhang L,Luo J,Yuan R B,et al.The CFD Analysis of Twin Flapper-Nozzle Valve in Pure Water Hydraulic[J].Procedia Engineering,2012,31:220-227.
[7]Berg A,Iben U,Meister A,et al.Modeling and Simulation of Cavitation in Hydraulic Pipelines Based on the Thermodynamic and Caloric Properties of Liquid and Steam[J].Shock Waves,2005,14(1/2):111-121.
[8] Chen Q P,Shu H Y,Fang W Q,et al.Fluid Structure Interaction for Circulation Valve of Hydraulic Shock Absorber[J].Journal of Central South University,2013,20(3):648-654.
[9]Rooze J,Rebrov E V,Schouten J C,et al.Dissolved Gas and Ultrasonic Cavitation-a Review[J].Ultrasonics Sonochemistry,2013,20(1):1-11.
[10]Gaitan D F,Crum L A,Church C C,et al.Sonoluminescence and Bubble Dynamics for a Single,Stable,Cavitation Bubble[J].Journal of the Acoustical Society of America,1992,91 (6):3166-3183.
[11] Barber B P,Hiller R A,Löfstedt R,et al.Defining the Unknowns of Sonoluminescence[J].Physics Reports,1997,281(2):65-143.
[12]Thomas C R,Roy R A,Holt R G.Bubble Dynamics near the Onset of Single-Bubble Sonoluminescence[J].Physical Review E,2004,70:066301.
[13]Li Y.Sonochemical Effects on Single-Bubble Sonoluminescence[J].Physical Review E,2005,72(4):046309.
[14]Hong Y Z,Zhang J L,Zhang J S.Parameters Estimation for Gas in Bubble Sonoluminescence[J].Journal of Sichuan Ordnance,2010(8):141-143.(in Chinese)
[15] An Y.Mechanism of Cavitation Bubble Luminescence[J].Scientia Sinica Physica,Mechanica&Astronomica,2011,41 (4):343-349.(in Chinese)
[16] Hatanaka S.Sonoluminescence,Sonochemistry and Bubble Dynamics of Single Bubble Cavitation[C].AIP Conference Proceedings,2012.
[17] Cui W C,Chen W Z,Zhou Chao,et al.Single-Bubble Sonoluminescence under Different Acoustic Pressure in Ethanol Aqueous Solutions[J].Chinese Science Bulletin,2013(2): 141-145.(in Chinese)
[18]Zhou C,Chen W Z,Cui W C.Characteristic Spectra of Single-BubbleSonoluminescence in the Rare-Earth SaltAqueous Solutions[J].Acta Physica Sinica,2013,62(8):510-515.(in Chinese)
[19]An Y.Spectrum of Multi-bubble Sonoluminescence in Sulfuric Acid[J].Applied Acoustics,2013,32(3):205-211.(in Chinese)
[20]Launder B.The Numerical Computation of Turbulent Flows[J].Compute Methods in Applied Mechanics and Engineering,1974,3(2):269-289.
TH137.1
A
1672-5220(2015)03-0363-09
date:2014-03-17
National Natural Science Foundation of China(No.51275123)
*Correspondence should be addressed to ZHANG Jian,E-mail:freezeman007@hit.edu.cn
杂志排行
Journal of Donghua University(English Edition)的其它文章
- Effect of Sludge Retention Time on the Fate of Proteins and Polysaccharides in AAO Process
- Compressive Strength Estimation for the Fiber-Reinforced Polymer(FRP)-Confined Concrete Columns with Different Shapes Using Artificial Neural Networks
- Force-Based Quadrilateral Plate Bending Element for Plate Using Large Increment Method
- Effects of 1,7-Bromine Substitution at Bay Area on Self-assembly Behavior and Photo Physical Properties of Perylene Diimide
- Theoretical and Experimental Analyses of Poisson Ratios for Plain-Woven Fabrics
- Dynamic Engaging Characteristics of Wet Clutch in Automatic Transmission
