Optimal trajectory and heat load analysis of different shape lifting reentry vehicles for medium range application S. Tauqeer ul Islam RIZVI*, Lin-shu HE, Da-jun XU
2015-07-02SchoolofAstronauticsBeihangUniversityBeijing100191ChinaReceived18January2015revised23May2015accepted12June2015Availableonline26July2015
School of Astronautics, Beihang University, Beijing 100191, ChinaReceived 18 January 2015; revised 23 May 2015; accepted 12 June 2015 Available online 26 July 2015
Optimal trajectory and heat load analysis of different shape lifting reentry vehicles for medium range application S. Tauqeer ul Islam RIZVI*, Lin-shu HE, Da-jun XU
School of Astronautics, Beihang University, Beijing 100191, China
Received 18 January 2015; revised 23 May 2015; accepted 12 June 2015 Available online 26 July 2015
Abstract
The objective of the paper is to compute the optimal burn-out conditions and control requirements that would result in maximum down-range/ cross-range performance of a waverider type hypersonic boost-glide (HBG) vehicle within the medium and intermediate ranges, and compare its performance with the performances of wing-body and lifting-body vehicles vis-‵a-vis the g-load and the integrated heat load experienced by vehicles for the medium-sized launch vehicle under study. Trajectory optimization studies were carried out by considering the heat rate and dynamic pressure constraints. The trajectory optimization problem is modeled as a nonlinear, multiphase, constraint optimal control problem and is solved using a hp-adaptive pseudospectral method. Detail modeling aspects of mass, aerodynamics and aerothermodynamics for the launch and glide vehicles have been discussed. It was found that the optimal burn-out angles for waverider and wing-body configurations are approximately 5°and 14.8°, respectively, for maximum down-range performance under the constraint heat rate environment. The down-range and cross-range performance of HBG waverider configuration is nearly 1.3 and 2 times that of wing-body configuration respectively. The integrated heat load experienced by the HBG waverider was found to be approximately an order of magnitude higher than that of a lifting-body configuration and 5 times that of a wing-body configuration. The footprints and corresponding heat loads and control requirements for the three types of glide vehicles are discussed for the medium range launch vehicle under consideration.
Copyright©2015, China Ordnance Society. Production and hosting by Elsevier B.V. All rights reserved.
Keywords:Trajectory optimization; Hypersonic boost-glide; Waverider vehicle; Heat rate limit; Pseudospectral method; Hypersonic missile; Wing-body; Liftingbody; Medium range; Down-range; Cross-range
E-mail address: rizvi.aeng@gmail.com (S.T.I. RIZVI).
Peer review under responsibility of China Ordnance Society.
http://dx.doi.org/10.1016/j.dt.2015.06.003
2214-9147/Copyright©2015, China Ordnance Society. Production and hosting by Elsevier B.V. All rights reserved.
1. Introduction
Waverider configuration, originally intended for hypersonic cruise vehicle (HCV) has become extremely popular because of DARPA's X-41 common aero vehicle (CAV) program [1] and the Boeing X-51 scramjet engine demonstrator waverider program [2]. The waverider configuration has an immense aerodynamic advantage because of highest possible trim liftto-drag ratio of greater than 3.0 in the hypersonic regime [3] as compared to trim lift-to-drag ratio of greater than 2.0 for wing-body configuration [4,5] and that of slightly greater than one for lifting-body design [6-8]. Common examples of lifting body designs include X-33, X-38 and HL-20 vehicles while shuttle orbiter and X-37B orbital test vehicle (OTV) are the examples of wing-body vehicles. The larger nose radius of lifting-body and the wing-body design have a better volumetric efficiency and also allow the use of conventional nosemounted terminal sensors such as millimeter wave radar. The lifting-body and wing-body vehicles are subject to maximum heat rate on the fin leading edges. With advancement of the material technology (carbon-carbon materials) capable of bearing a temperature up to 2900 K [9], the utility of wingbody and lifting-body designs for medium and intermediate range military applications cannot be ignored.
Reentry studies performed on lifting-body configuration have focused mainly on crew return vehicles (CRVs) [4], while the research on wing-body configuration is focused on orbital space planes and maneuverable reentry vehicles [10-13]. Li et al. [14,15] carried out trajectory optimization of a boostglide hypersonic missile waverider configuration using the shooting technique, and calculated the footprint of an HBG missile from 5000 km to 15,000 km down-range and 5000 km cross-range once boosted from a Minuteman III boost vehicle to a speed of approximately 6.5 km/s at a burn-out angle of nearly zero degree. Rizvi et al. [16] computed the optimal trajectories of waverider type hypersonic boost-glide vehicle for medium range applications, and showed that the integrated heat load can be reduced by as much as 50 percent with penalty of only 10 percent in the overall down range. The research carried out by Rizvi et al. [16] shows the dependency of the integrated heat load on the burn-out conditions. The optimal burn-out conditions and subsequent optimal reentry trajectories under constraint heat rate with the objective to maximize the down-range and cross-range performance for medium to intermediate range applications are not available in literature.
For a ballistic vehicle with a particular burn-out speed and a fixed reentry vehicle shape and wing loading, the critical parameter is the burn-out angle. Low burn-out angles imply a small free-flight range but a higher reentry range and vice versa. Longer flight time at a shallow reentry angle also results in the increase in the total heat load [17]. The heat rate problem is more severe for small size vehicle because of small nose/leading-edge-radius (for wing-body and lifting-body designs). Limiting the heat rate restricts the reentry angle and lowers the down-range/cross-range performance of a reentry vehicle. Sharper re-entry angle results in high decent rates and the vehicle quickly approaches the heat rate boundary, resulting in infeasible trajectories.
The importance of the burn-out angle therefore necessitates it to be optimized. The approach used to optimize the burn-out conditions is to model the boost phase. The multiphase optimization problem is solved using a hp-adaptive pseudospectral method. For the free-flight and the glide phase, the path limits include the heat rate limit of 4 MW/m2which can either be at the nose or at a fin-tip, as well as dynamic pressure constraint of 320,000 Pa corresponding to the terminal constraint. The heat rate limit corresponds to the temperature limit of 2900 K which the reinforced carbon-carbon material can sustain [9]. Ablative materials are not suitable for lifting vehicle because of significant reduction in aerodynamic properties with modification in the body shape [18].
The aim of the numerical study is therefore to compute the optimum burn-out altitudes and the flight path angles for the ballistic vehicle, and the best angle-of-attack and bank angle profile for the waverider, wing-body and lifting-body vehicles which would result in maximum down-range/cross-range of the vehicles under heat rate and dynamic pressure constraints.
The planform loading of lifting-body, wing-body as well as waverider configurations is assumed to be 400 kg/m2which is consistent with that of fighter aircrafts as well as MaRRV data considered in Ref. [19]. The non-linear optimal control problem is solved using hp-adaptive pseudospectral method implemented in Gauss pseudospectral optimization software (GPOPS) [20].
2. Definition of phases
The various phases include:
1) The first 5s of first stage boost phase, during which pitch maneuver does not take place.
2) The first stage boost phase, after the first 5s, during which the launch vehicle pitches down using angle-of-attack control.
3) The second stage boost phase during which the flight path angle is changed to meet the burn-out conditions.
4) The free flight and the reentry stage during which the glide vehicle is steered to an optimal down-range or cross-range distance with the help of angle-of-attack and bank angle control.
The states at the end of the third phase, which includes the burn-out angle, burn-out altitude and the burn-out speed, are treated as free parameters and can be optimized. The fourth phase includes the free flight phase as well as the reentry phase.
3. Physical model
3.1. Earth and atmosphere
The earth is assumed to be a perfect, non-rotating sphere. The acceleration due to gravity is given by Newton's inverse square law

The density variation with altitude is assumed to be exponential and given by the relation

where ρ0is the sea level density; and β is a constant that represents the inverse of density scale height and is given in Table 2.
3.2. Ballistic vehicle and reentry vehicle data
The data of the launch vehicle and the two types of reentry vehicles under consideration as well as the physical constants are summarized in Tables 1 and 2, respectively. The liftingbody and wing-body vehicles have same spherical nose radius denoted by RND, of which the fin radius and fin sweep angle are denoted by RFand Λ, respectively. The bi-conic reentry vehicle is assumed to have the same mass as that of the lifting vehicles with a ballistic coefficient of approximately 2900 kg/m2.
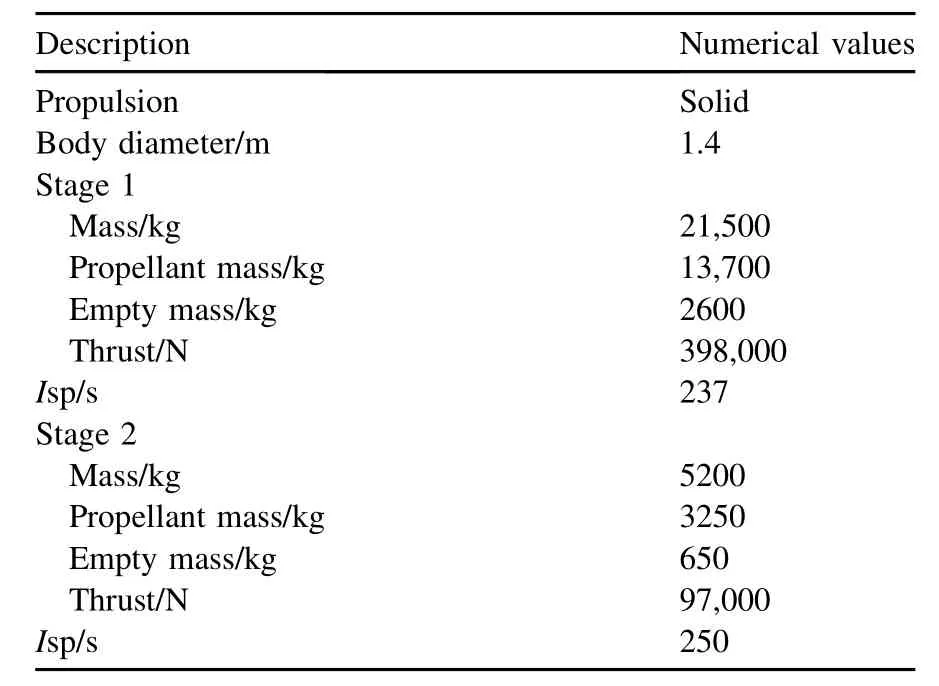
Table 1Boost vehicle data.
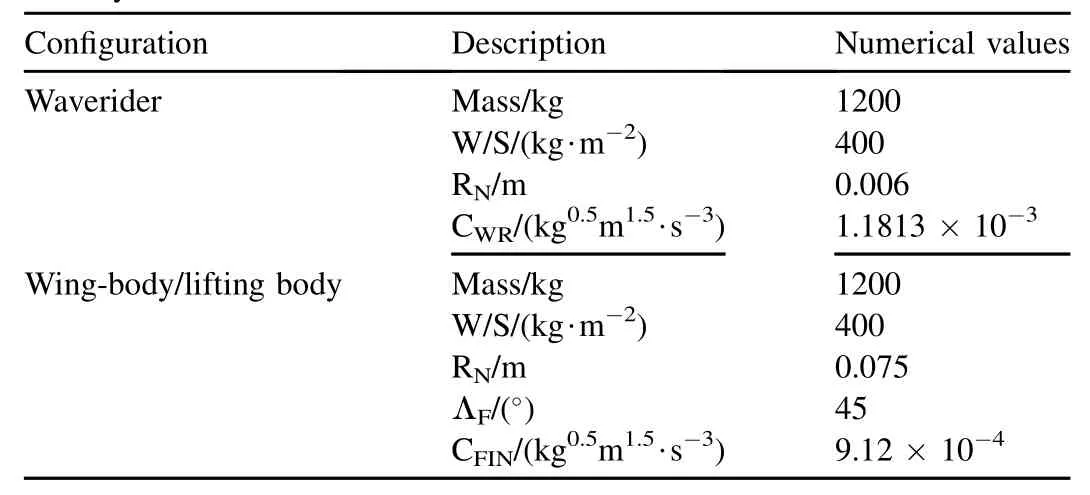
Table 2Reentry vehicle data.
The boost vehicle does not resemble any particular vehicle and is not an optimized vehicle for the purpose. It is because of this reason that the control deflections of the boost vehicle are not discussed and are not considered important for the purpose of the current research. The boost vehicle is a two stage vehicle with a burn-out velocity in vicinity of 3.7 km/s. The burn-out time of each rocket motor is about 80 s.
3.3. Aerodynamic model
An integrated waverider has a lift-to-drag ratio close to 4 at Mach 4.0 [3]. Philips [21] given a detailed overview of CAV-H and CAV-L concepts of Boeing waverider designs and also provided aerodynamic data which indicates a lift-to-drag ratio of greater than 3.0 at hypersonic mach number range for a typical high performance CAV design. This high aerodynamic performance is not without any limitation. The NASA Ames and Sandia's slender aerodynamic research probe (SHARP L1) has a nose leading edge radius of 3-6 mm [18] and experiences very high heating rates during the reentry phase. The waverider technology is still undergoing test and trial in the form of X-41 [1] vehicle by DARPA.
The aerodynamic model for the waverider configuration was obtained using the experimental data in Ref. [3]. The lift curve slope was adjusted to that of a flat plate at hypersonic speeds obtained using Newtonian flow theory [22]. This is done since the data provided in Ref. [3] is valid only till Mach 4.5. Eqs. (3) and (4) represent the aerodynamic model of the waverider experimental data is represented in Fig. 1.The wing-body design is a compromise that allows for a spacecraft to perform a lifting reentry while still managing the extreme heat during this phase. In hypersonic flow, the blunt bodies tend to produce a strong detached normal shockwave at the nose. The detached shockwave causes a significant portion of the kinetic energy from a high-speed flow to be swept away by the cross-flow, so the majority of the energy never reaches the surface of the body. Awing-body vehicle has a lift-to-drag ratio close to 2.0. Whitmore et al. [18] compared the data of shuttle, X-20 Dynasoar, X-34 and X-15 in their analysis. The details of the MaRRVaerodynamic data were given by Parish-II [19] while Bornemann et al. [23] and Surber et al. [5] presented the trim aerodynamic data of shuttle orbiter. The trim aerodynamic data in Refs. [4, 5, 19] was used to obtain Eqs. (5) and (6). The comparison of aerodynamic model with experimental data is shown in Fig. 2.


Fig. 1. The Variations of CL, CDand lift-to-drag ratio with angle-of-attack for a waverider aeromodel and their comparison with wind tunnel data in Ref. [3] at Mach 4.0.


The lifting-body aerodynamics has extensively been studied for crew return vehicle (CRV) design. The detailed wind tunnel tests were carried out in the range of Mach 0.3-20 at NASA Langley Research Center. The wind tunnel data indicates that HL-20 has an untrimmed maximum lift-to-drag ratio of 1.4 in hypersonic region [8]. Trim analysis carriedout by Whitmore et al. [4] indicates that the HL-20 configuration has a maximum lift-to-drag ratio of 1.2 at an angle of attack close to 15°. The trim lift-to-drag ratio of 1.2 for a lifting-body vehicle is comparatively twice as much as that of a bi-conic reentry body and therefore gives higher cross-range performance as compared to a conventional bi-conic reentry body design. An equation set given below represents a simplified aerodynamic model of HL-20 vehicle in hypersonic range. The corresponding lift, drag and lift-to-drag ratio are represented in Fig. 3.


Fig. 2. The variation of CL, CDand lift-to-drag ratio with angle-of-attack for a wing-body configuration and their comparison with shuttle trim data [5] and MaRRV Data [19].
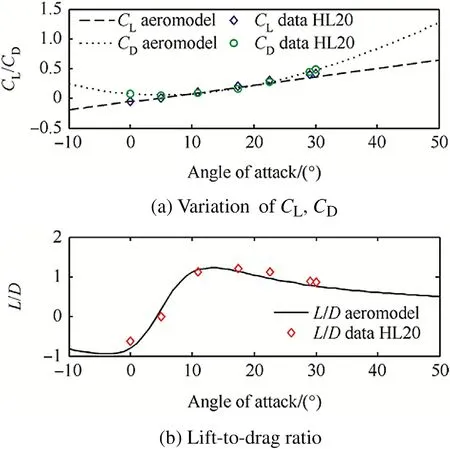
Fig. 3. The variation of CL, CDand lift-to-drag ratio with angle-of-attack for a lifting-body configuration and their comparison with HL-20 trim aerodynamic data [4] at Mach 6 to10.
3.4. Equations of motion
The following set of equations of motion is used for three degree of freedom (DOF) point mass model. The equations have been extensively used in the study of reentry vehicle and their guidance systems [10,14-16].


where r is the radial distance from the center of the earth to the reentry vehicle;Θ and φ are the longitude and latitude, respectively; V is the total velocity of the vehicle;γ and ψ are the flight path angle and the azimuth angle, respectively; and m is the mass. The terms L and D are defined as L = 0.5CLρV2S and D = 0.5CDρV2S. Thrust is assumed to be zero during the reentry flight. CLand CDare assumed to be function of angle of attack (α) only. This is true in hypersonic region in which the aerodynamic coefficients do not vary with Mach number.
3.5. Stagnation point heat rate
The stagnation point heat rate is modeled by using the equation given by Scot et al. [15]. The convective heat transfer rate is given by

The convective heat transfer at the fin tip or wing leading edge is calculated using Eq. (17), which is valid for swept cylinder with cylinder radius RFinclined at a sweep angle,ΛFto the flow [24]. It was assumed in Eq. (17) that the enthalpy atthe wall is very small as compared to that at infinity, which is true for no-slip condition. For slip condition, lesser heat is generated because of lesser skin friction. This implies that using Eqs. (16) and (17) in the current form is a conservative approach.The total heat load at the stagnation point is calculated using the relationship


where t0and tfare the initial and final times in the free-flight and re-entry phases, respectively.
3.6. Normal acceleration
For a winged body the normal acceleration is of greater importance as compared to the total deceleration load. The normal acceleration is computed using the following relation

3.7. Controls
The waverider, wing-body vehicles and lifting-body vehicles have angle-of-attack and bank-angle control. The waverider and wing-body vehicles are assumed to have angle-ofattack trim capability from -10 to 50°. On the other hand, the lifting-body vehicle is assumed to have maximum angleof-attack trim capability up to 30°. All vehicles have a bank angle control of±90°. The angle-of-attack control modulates the lift and the heat rate. The bank angle results in a lateral force which causes the sideward motion of the spacecraft. The boost vehicle also has angle-of-attack control. The angle-ofattack range during the boost phase is set between±20°.

3.8. Boundary conditions
The initial conditions are the conditions of the missile at the launch pad

m = m0
The terminal boundary conditions correspond to the penetration requirements of a conventional warhead. It is desirable that the warhead may be able to strike a target at maximum possible velocity and a high impact angle close to 90°. For biconic re-entry shapes, the impact velocity is close to 700-1000 m/s. Impact speed of 1300 m/s is the material limit beyond which the warhead becomes plastic [25]. Use of lifting reentry vehicles gives the military planners to strike a particular target at the desired angle and speed. Too high impact speed improves the performance of the warhead alone but raises the maximum dynamic pressure limit of the reentry body. This implies a higher structural limit and higher empty weight. For the current study the maximum terminal speed is considered to be 720 m/s at an impact angle of 80°. The requirement was modeled as a terminal constraint.3.9. Constraints

A dynamic pressure limit corresponds to the maximum stagnation pressure which the vehicle structure can bear in presence of high acceleration loads. The terminal constraints imply that the vehicle would sustain a dynamic pressure of approximately 320 KPa close to impact. The dynamic pressure constraint of 320 KPa has been imposed as a path constraint during the entire flight. The dynamic pressure constraint is kept equivalent to the dynamic pressure experienced by the vehicle in terminal phase.The heat rate constraint is directly linked with the surface temperature if the surface is assumed to be in radiative equilibrium with the surroundings. The carbon-carbon composite material can retain its properties till temperature of 2900 K [9]. The temperature corresponds to a heat rate limit of approximately 4.0 MW/m2.


where σ is the Stefan-Boltzmann constant which is equal to 5.67×10⁻⁸W/(m2.K4); and Є is the surface emissivity which is close to 0.9.
3.10. Objective functions
The objective is to find the angle-of-attack and bank angle control deflections that would maximize the down-range/ cross-range of the reentry vehicle. Maximizing down-range and cross-range is similar to maximizing longitude and latitude at final time tfof phase-4. The problem is a Mayers problem and can be expressed aswhere(xf(2))4and(xf(3))4represent the maximum values of second state (i.e., longitude) and third state (i.e., latitude) at final time tfof the fourth phase, respectively.

4. Pseudospectral method
Pseudospectral method was used to solve the nonlinear, multiphase, constraint optimal control problems. In the pseudospectral method, the time interval of the optimal control problem is split into a prescribed number of subintervals. The end points are called nodes, and the entire distribution of nodes can be referred to as a grid within the time domain. The points within the nodes are called collocation points and are governed by strict quadrature rules. The method is based on the theory of orthogonal collocation where the collocation points are the Lagrange-Gauss (LG) points. The state equations and the control constraints are transformed into the algebraic equations by using the properties of the Lagrange polynomials. In this way, the optimal control problem is reduced to a non-linear programming problem.
In h method, the low order polynomials are used to approximate the state vector. The mesh is refined till the required accuracy of the solution is obtained. In p method, a single interval is used and the accuracy is improved by increasing the order p of the polynomial. In a hp adaptive method, the required accuracy is achieved by increasing the number of nodes as well as the degree of polynomial. Additional nodes are introduced, where the curvature is sharp, and therefore the method is called the hp-adaptive pseudospectral method [13]. The hp-adaptive pseudospectral method is implemented in Gauss pseudospectral optimization software(GPOPS®) [20].
The optimal control reentry problem for unconstraint heat load is expressed as to determine the state vector [r(t),Θ(t),Φ(t),V(t),γ(t),ψ(t),m(t)]and the control vector [α(t),σ(t)]that minimizes the cost function subject to the dynamic constraints of Eqs. (9)-(15), the initial and terminal flight path conditions given in Eq. (21) and Eq. (22), and the path constraints given by Eqs. (23) and (25). The nonlinear optimal control problem is solved using open source Gauss pseudospectral optimization software version 4.0. The program utilizes hp-adaptive Radau pseudospectral method (RPM) for solving optimal control problem. RPM is an orthogonal collocation method where the collocation points are the Legendre-Gauss-Radau points. The number of mesh intervals and the number of collocation points are determined iteratively at the end of iteration. The mesh refinement continues till a solution, which satisfies the error tolerances, is obtained [13]. The details of the hp-adaptive algorithm are given in Refs. [26, 27]. For the current research the maximum number of mesh iterations was set to 12 with 4-10 nodes between the collocation points. The error tolerance was set to 1e-3. The nonlinear programming (NLP) derivatives were computed using finite difference scheme.

Table 3Numerical results for lifting vehicle performance with heat rate constraints.
5. Results
5.1. Discussion of results for waverider configuration
Table 3(a) gives the numerical results for the waverider cross-range performance corresponding to the unconstraint and constraint down-range performance. The results indicate that the maximum cross-range is obtained corresponding to burn-out angle of zero degree at 53 km altitude. The maximum cross-range obtained is approximately 1628 km with a downrange of 1534 km. Optimal cross-range performance was also obtained for constrained down-ranges of 2000, 2500 and 3000 km. The results indicate that the cross-range decreases with the increase in down-range, reducing to approximately 900 km corresponding to the down-range of 3000 km. The maximum down-range of 3321 km is obtained corresponding to burn-out angle of 5.17°and burn-out altitude of 62 km for the launch vehicle under study.
The best control strategy is to optimize the cross-range for minimum value of down-range by increasing the burn-out angle which results in an increase in down range during thefree flight phase (Figs. 5(a) and 6(a)) and reducing the bank angle which results in lesser heading change and greater down-range. Lower bank angle (Fig. 11(b)) produces a lesser change in heading (Fig. 7(b)) and the vehicle meets the downrange requirement while maximizing the cross-range performance (Fig. 5(b)). The bank angle goes to zero once the desired optimal heading is achieved. For maximum crossrange, the change in heading is 90°which reduces as the down-range requirement is increased (Fig. 7(b)). For a constraint down-range of 3000 km, the maximum cross-range that can be achieved is approximately 900 km with a heading change of 55°. The burn-out angle in this case is 4.13°(Table 3(a)) which maximizes the down-range and cross-range performances (Figs. 5 and 6) simultaneously. The initial angle-ofattack goes to 25°(Fig. 11) in this case so as to dissipate energy quickly enough to avoid the heat rate boundary (Fig. 9(a)). The variation of speed with time is shown in Fig. 8. The bank angle in this case also remains low to attain the down-range constraint.
Fig. 4 shows the optimal trajectory of the boost vehicle as well as the reentry vehicle for maximum cross-range on an altitude versus velocity map. Fig. 4 also shows the dynamic pressure and heat rate constraint lines and indicates that none of the constraints is violated. The constraint variables are also shown as a function of time in Fig. 9.
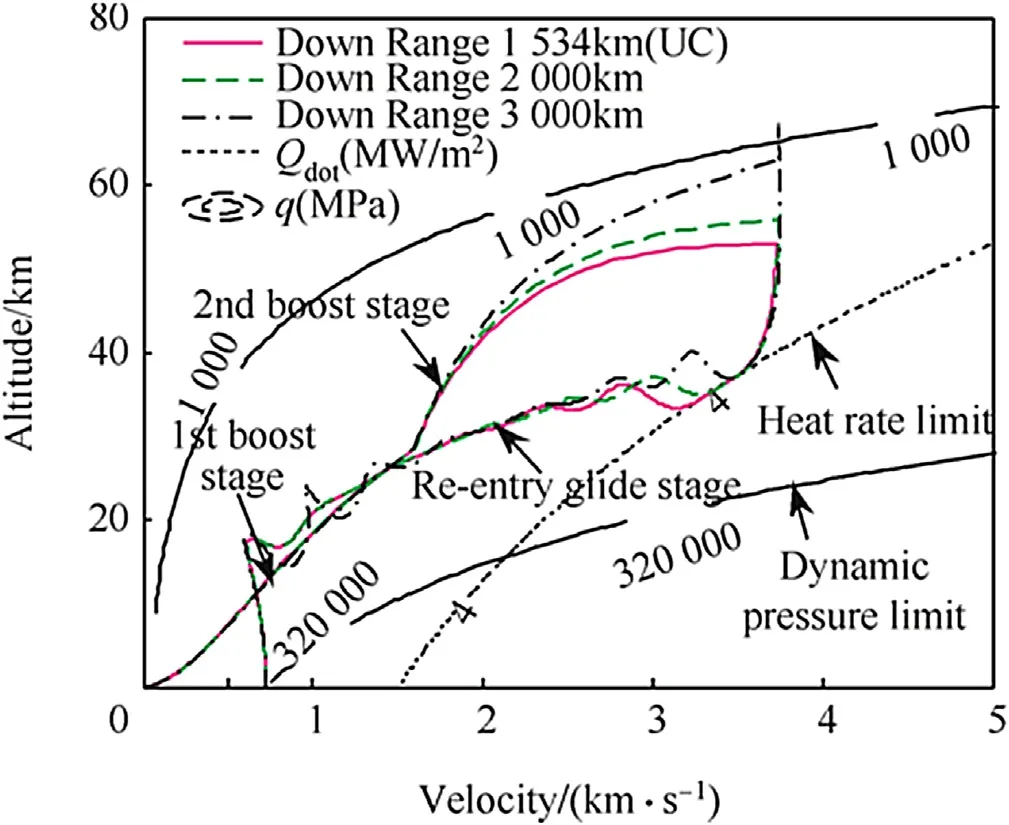
Fig. 4. Trajectory of small-sized waverider vehicle at burn-out speed of 3.7 km/s, and constraint down-ranges on an altitude versus velocity map.

Fig. 5. Altitude and cross-range variation with down range for waverider vehicle.

Fig. 6. Altitude and cross-range variation with time for waverider reentry vehicle.
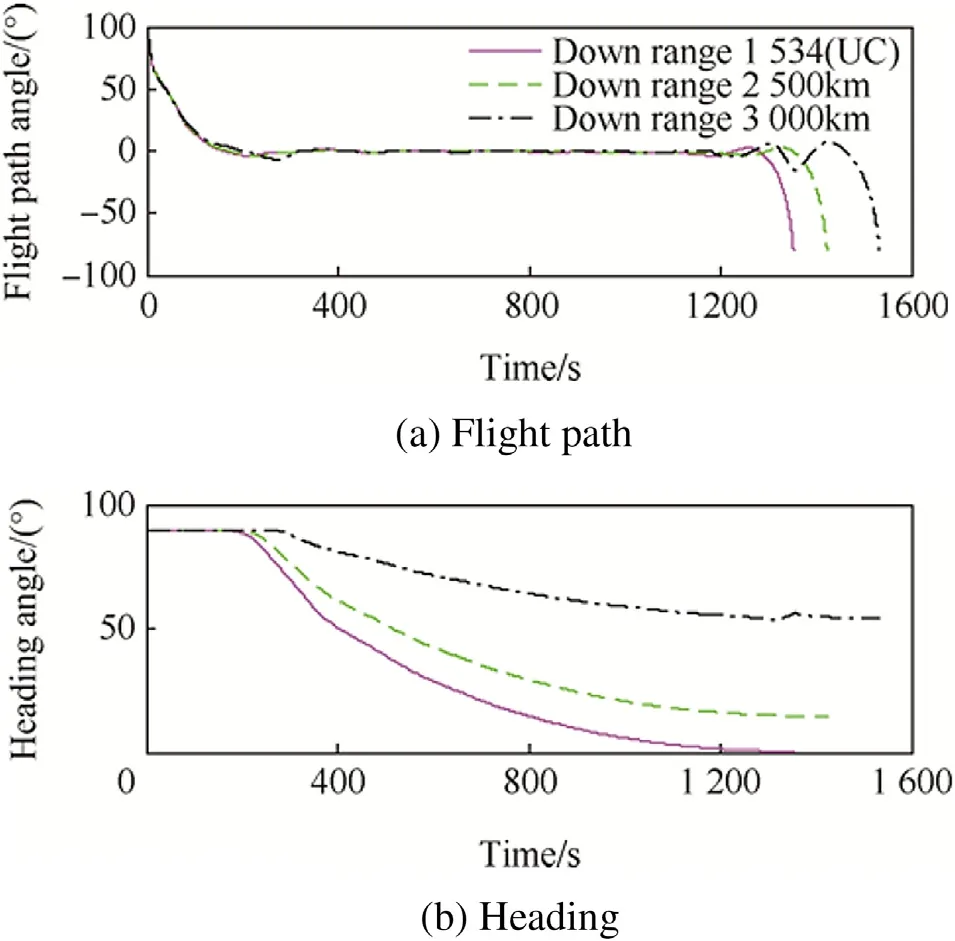
Fig. 7. Flight path and heading angle variation with time for waverider configuration at burn-out speed of 3.7 km/s.
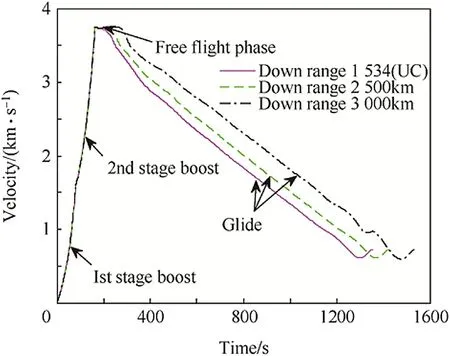
Fig. 8. Velocity variation with time for waverider configuration at burn-out speed of 3.7 km/s.
Fig. 10 shows the variation of normal and tangential accelerations with time. The acceleration values remain within the limits.
5.2. Discussion on comparative performance
Table 3(b) and (c) show the cross-range results of wingbody and lifting-body configurations. The wing-body configuration has 23 percent and 50 percent lower down-range and cross range performance as that of waverider vehicle respectively. The cross-range performances with different constraint down-range values for waverider, wing-body and lifting-body configurations are also given in Table 3(a), (b) and (c). The results are summarized in Fig. 12 which shows the deterioration of optimal cross-range performance with the increase in down-range.
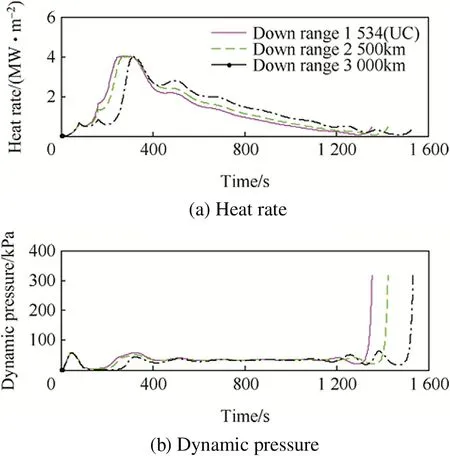
Fig. 9. Heat rate and dynamic pressure variation with time for waverider configuration at burn-out speed of 3.7 km/s.

Fig. 10. Normal load factor and tangential acceleration variation with time for waverider configuration at burn-out speed of 3.7 km/s.

Fig. 11. Angle-of-attack and bank angle vs. time histories for waverider vehicle.
Fig. 13 shows the comparison of trajectory shapes on the altitude versus velocity map. The comparison of trajectories is given for the cases where the cross-range for waverider, wingbody and lifting-body vehicles is maximized corresponding to constraint down-range of 1600 km. The comparative performance as a function of lift-to-drag ratio is shown in Fig. 15. Fig. 15 shows that the cross-range increases linearly with liftto-drag ratio. The results indicate that the waverider design has the best cross-range performance of approximately 1627 km atburn-out angle of zero degree. The wing-body and lifting-body designs depict the cross-ranges of 736 km and 121 km corresponding to the burn-out angles of 5.42 and 13.6°, respectively (Fig. 16). The burn-out angle also changes linearly with lift-to-drag ratio, as shown in Fig. 17. Fig. 13 shows that the lifting-body configuration looses energy quickly to drag force after reentry and is only able to execute a single skip before meeting the terminal constraint. The loss in speed is because of higher parasite drag. The vehicle encounters a minimum altitude of around 20 km before skipping to higher altitude. The normal acceleration during this phase goes to 10 g while as the vehicle faces tangential deceleration of approximately 5 g as can be seen from Fig. 19. For wing-body configuration, the energy lost to drag force is less as compared to lifting-body configuration and as a result the wing-body vehicle skips thrice before meeting the terminal velocity constraint of 0.72 km/s. The waverider configuration shows a smooth glide trajectory (Figs. 13 and 14) and looses speed at a very slow rate (Fig. 18) because of very low parasite drag as compared to wing-body and lifting-body configurations. The flight path angle also remains between±1°for waverider configuration during the glide stage before diving down to meet the terminal constraint of -80°flight path angle (Fig. 16(a)). The flightpath fluctuates between +10 and -10°for wing-body configuration after reentry whereas it fluctuates between ±19°for the lifting-body configuration.
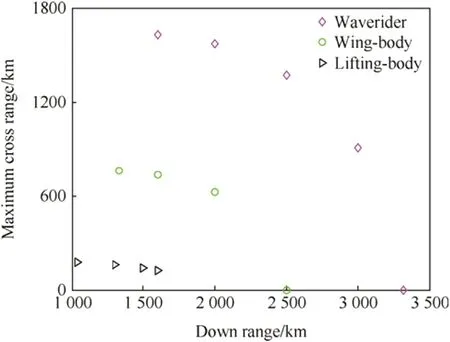
Fig. 12. Maximum cross-range variation with down-range for lifting bodies with burn-out speed of 3.7 km/s.
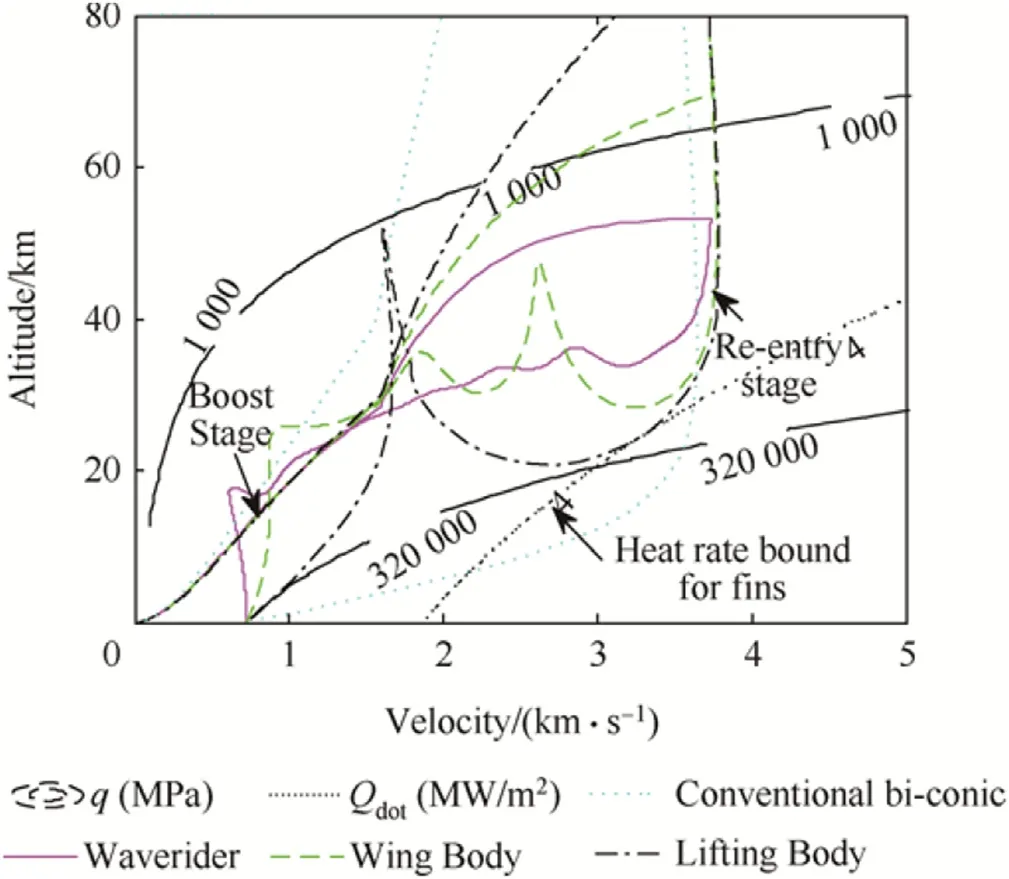
Fig. 13. Trajectory of lifting-body reentry vehicle with burn-out speed of 3.7 km/s and constraint down range of 1600 km on an altitude versus velocity map.
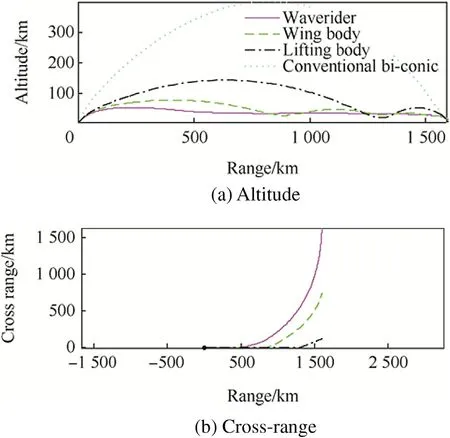
Fig. 14. Altitude and cross-range variation with down range for different reentry vehicle types with constraint down-range of 1600 km and burn-out speed of 3.7 km/s.
Trajectory results show that, for optimal down-range of 1600 km, the bi-conic reentry body goes to 400 km altitude and faces immense heating rates up to 14 MW/m2as it enters the atmosphere. The dynamic pressure also goes beyond 1000 KPa (Fig. 19), resulting in tangential deceleration ofmore than 25 g (Fig. 20). For lifting configurations, the heat rate, dynamic pressure, and normal and tangential accelerations all remain within the limits (see Fig. 21).
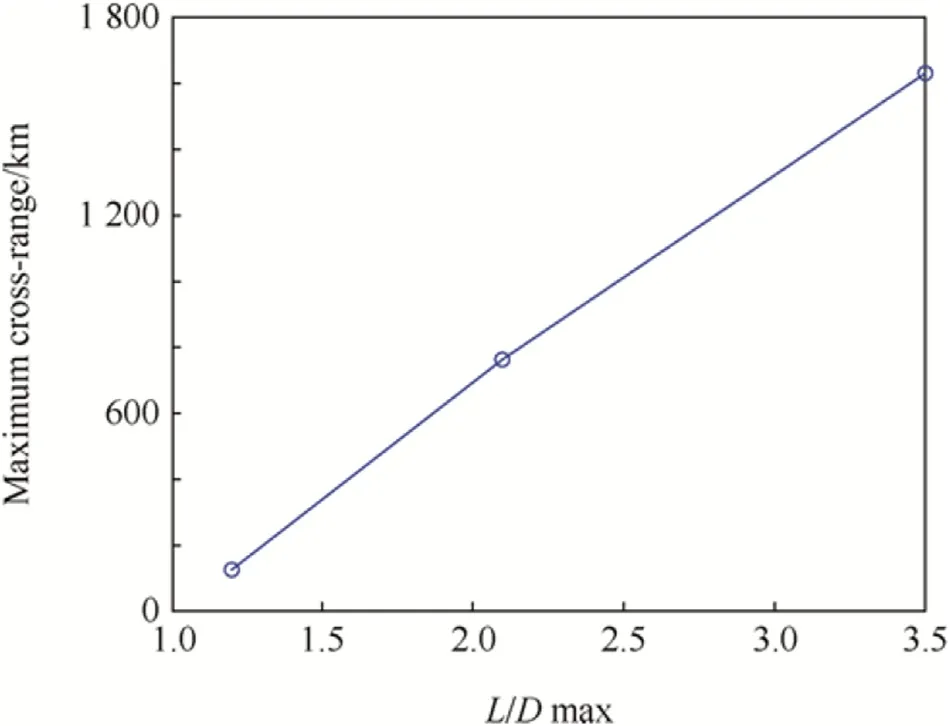
Fig. 15. Max. cross-range variation with lift-to-drag ratio with down-range of 1600 km and burn-out speed of 3.7 km/s.
The integrated heat load values (Table 3) indicate that the total heat flux for lifting-body is approximately the same as that for the conventional configuration. The heat flux value for wing-body configuration is almost twice that of biconic reentry vehicle, whereas the heat flux for the waverider configuration is approximately 8.5 times the heat load experienced by the conventional bi-conic design. The integrated heat load values are plotted against lift-to-drag ratio in Fig. 22. The plot shows that the integrated heat load increases exponentially with lift-to-drag ratio. This is because of an increase in atmospheric flight time with the increase in lift-to-drag ratio (Table 3). The integrated heat load value is an important parameter as it determines the material thickness of the thermal protection system (TPS) and is also related to the empty weight fraction of the vehicle.

Fig. 16. Flight path and heading angle variation with time different lifting reentry vehicles and with constraint down range of 1600 and burn-out speed of 3.7 km/s.

Fig. 17. Optimal burn-out angle variation with lift-to-drag ratio with downrange of 1600 km and burn-out speed of 3.7 km/s.

Fig. 18. Velocity variation with time for conventional vehicle and lifting-body vehicle with constraint down-range of 1600 km and burnout speed of 3.7 km/s.
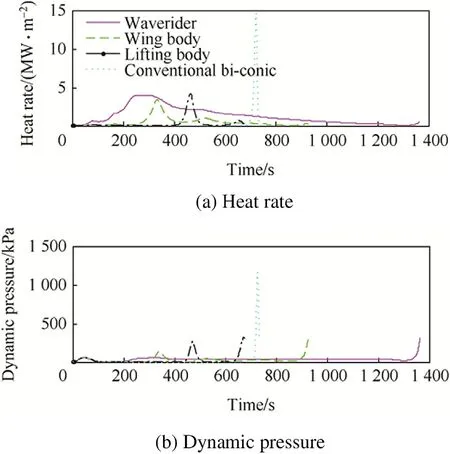
Fig. 19. Velocity variation with time for conventional vehicle and lifting-body vehicle with constraint down-range of 1600 km and burn-out speed of 3.7 km/s.
6. Conclusion
The problem of optimal trajectory design for waverider, wing-body and lifting-body vehicles has been considered for medium range applications with the objective to compute the optimal burn-out conditions, optimal glide path and the corresponding control deflections under the constraint heat rateenvironment. Detail modeling aspects of mass, aerodynamics and aerothermodynamics were discussed. The burn-out angle and cross-range were found to vary almost linearly with lift-todrag ratio, whereas the integrated heat load is an exponential function of lift-to-drag ratio for a fixed cross-range.
The footprints of the hypersonic boost-glide missiles for the three configurations were discussed for medium range application. It has been found that the down-range performance and cross range performance of hypersonic boost-glide waverider are 33 percent higher and twice more than as compared to those of hypersonic boost-glide wing-body missile respectively. The integrated heat load experienced by the HBG waverider was found to be approximately an order of magnitude higher than that of a conventional/lifting body configuration and 5 times that of a wing-body configuration. The results further indicate that the maximum down-range for the waverider configuration is obtained corresponding to the burnout angle of approximately 5°. The optimal burn-out angle for wing-body configuration is 14.8°within the medium range at the constraint heat rate of 4 MW/m2. The normal load factor remains within the limit.

Fig. 20. Normal load factor and tangential acceleration as a function of time for different lifting entry vehicle with constraint down range of 1600 km and burn-out speed of 3.7 km/s.

Fig. 21. Angle-of-attack and bank angle vs. time for lifting-body vehicles with constraint down-range of 1600 km and burn-out speed of 3.7 km/s.

Fig. 22. Heat flux variation with lift-to-drag ratio with down-range of 1600 km and burn-out speed of 3.7 km/s.
Acknowledgments
I would like to acknowledge the Chinese Scholarship Council for supporting the research.
References
[1]“X-41 Common Aero Vehicle,”available at: http://www.globalsecurity. org/space/systems/x-41.htm.
[2]“X-51 Scramjet Engine Demonstrator - WaveRider,”available at: http:// www.globalsecurity.org/military/systems/aircraft/x-51.htm.
[3] Crockrell CE, Huebner LD, Finley DB. Aerodynamic performance and flow field characteristics of two wave-rider derived hypersonic cruise vehicles. In: AIAA 33rd aerospace science meeting and exhibit Reno, NV: AIAA paper 95-0736; 1995.
[4] Whitmore SA, Banks Daniel W, Andersen BM, Jolley PR. Direct-entry, aerobraking, and lifting aerocapture for human-rated lunar return vehicles. In: 44th AIAA aerospace science meeting and exhibit Reno, Nevada: AIAA-1033; 2006.
[5] Surber TE, Oslen DC. Shuttle orbiter aerodynamic development. J Spacecr 1978;15:40-7.
[6] Murphy KJ, Nowak RJ, Thompson RA, Hollis BA. X-33 hypersonic aerodynamic characteristics. J Spacecr Rockets 2001;38:674-82.
[7] Cambell C, Caram J, Berry S, DiFulvioi M, Horvath T. Overview of the X-38 hypersonic wind tunnel data and comparisons with numerical results. In: 35th aerospace science meeting Renovo, NV: AIAA paper 97-0576; 1997.
[8] Ware GM, Cruz CI. Aerodynamic characteristics of the HL-20. J Spacecr Rockets September-October 1993;30.
[9] Ley W, Klaus W, Willi H. Handbook of space technology, vol. 22. John Wiley & Sons; 2009.
[10] Zimmermann F, Calise AJ. Numerical optimization study of aeroassisted orbital transfer. J Guid Control Dyn 1998;21:127-33.
[11] Hull DG, Speyer JL. Optimal reentry and plane change trajectories. J Astronautical Sci 1982;30:117-30.
[12] Gogu C, Matsumura T, Haftka RT, Rao AV. Aeroassisted orbital transfer trajectory optimization considering thermal protection system mass. J Guid Control Dyn 2009;32(3):927-38.
[13] Darby CL, Rao AV. Minimum-fuel low-earth-orbit aeroassisted orbital transfer of small spacecraft. J Spacecr Rockets 2011;48(4):618-28.
[14] Li Y, Cui N, Rang S. Trajectory optimization for hypersonic boost glide missile consideringaeroheating. Aircr Eng Aerosp Technol 2009;81:3-13.
[15] Li Y. Optimal attack trajectory for hypersonic boost glide missile in maximum reachable domain. In: International conference on mechatronics and automation, Changchun, China; 2009.
[16] Rizvi STI, Linshu H, Dajun X. Optimal trajectory analysis of hypersonic boost-glide waverider with heat constraint. Aircr Eng Aerosp Technol 2015;87(1):67-78. http://dx.doi.org/10.1108/AEAT-04-2013-0079.
[17] Rizvi STI, Linshu H, Nasimullah. Vehicle performance tradeoff study of small size lifting re-entry vehicle. In: 10th international Bhurban conference on applied sciences & technology. Islamabad: National Centre for Physics, Quaid-i-Azam University; 2013. p. 154-62. http:// dx.doi.org/10.1109/IBCAST.2013.6512149. IEEE.
[18] Whitmore SA, Dunbar BJ. Orbital space plane: past, present, and future. In: IAA/ICAS international air and space symposium and exposition Dayton, Ohio: AIAA-2718; 2003.
[19] Parish-II MS. Optmality of aeroassisted orbital plane changes. Naval Postgraduate School. vol. Maters of Science Thesis Monterey, CA. 1995.
[20] Rao AV. User's manual for GPOPS version 4.0. August, 2011.
[21] Phillips TH. A common aero vehicle (CAV) model, description, and employment guide. Schafer Corporation for AFRL & AFSPC; 2003.
[22] John J, Anderson D. Hypersonic and high temperature gas dynamics. In: Hypersonic and high temperature gas dynamics. McGraw-Hill Book Company; 1989. p. 291-2.
[23] Bornemann WE, Surber TE. Aerodynamic design of the space shuttle orbiter. 1979.
[24] Tauber ME. A review of high speed convective heat transfer, computational methods. NASA TP-2914. 1989.
[25] Richie G. The common aero vehicle: space delivery system of the future. In: AIAA space technology conference & exposition Albuquerque, NM: AIAA paper 99-4435; 1999.
[26] Garg D, Patterson MA, Darby CL, Francolin C, Huntington GT, Hager WW, Rao AV. Direct trajectory optimization and costate estimation of finite-horizon and infinite horizon optimal control problems using a Radau pseudospectral method. Comput Optim Appl 2009;49(2):335-58.
[27] Garg D, Patterson MA, Hager WW, Rao AV, Benson DA, Huntington GT. A unified framework for the numerical solution of optimal control problems using pseudospectral methods. Automatica 2010;46:1843-51.
* Corresponding author.
杂志排行
Defence Technology的其它文章
- Heat treatment optimization for tensile properties of 8011 Al/15% SiCp metal matrix composite using response surface methodology V. VEMBU*, G. GANESAN
- Tuning the particle size and morphology of high energetic material nanocrystalsRaj KUMARa, Prem Felix SIRILa,*, Pramod SONIb
- Hypersonic sliding target tracking in near space
- Microstructure, mechanical and corrosion behavior of high strength AA7075 aluminium alloy friction stir welds - Effect of post weld heat treatment P. Vijaya Kumara, G. Madhusudhan Reddyb, K. Srinivasa Raoc,*
- An experimental investigation of wire electrical discharge machining of hot-pressed boron carbide Ravindranadh BOBBILI*, V. MADHU, A.K. GOGIA
- Multi-layer protective armour for underwater shock wave mitigationA hmed HAWASS, Hosam MOSTAFA, Ahmed ELBEIH*
