基于重抽样分布的一类模糊累积和控制图
2015-06-23王达布希拉图黄惠婷张秋芸
王达布希拉图,黄惠婷,蒋 翠,张秋芸
(广州大学a.经济与统计学院;b.岭南统计科学研究中心;c.数学与信息科学学院,广东广州 510006)
基于重抽样分布的一类模糊累积和控制图
王达布希拉图a,b,黄惠婷c,蒋 翠c,张秋芸c
(广州大学a.经济与统计学院;b.岭南统计科学研究中心;c.数学与信息科学学院,广东广州 510006)
过程变量在代表产品或服务过程信息时并非完美,而使用模糊数可能是另一较好途径.文章进一步完善模糊累积和控制图,其中使用中心和扩展具有重抽样分布的模糊随机变量,并给出模拟例证.
控制图;模糊数据;重抽样
0 Introduction
Statistical Process Control(SPC)is a very importantmethod for bringing processes into control and maintaining them in such a state.Control charts are the principle tools that have been designed and applied for the purposes of SPC[1].Cumulative Sum(CUSUM)control chart proposed by PAGE[2]is one used in process quality controlwidespread.
The traditional control charts were established for monitoring exact data from process.However,sometimeswe are not able to obtain exact numerical data,butwe dealwith imprecise(fuzzy)or even linguistic data,e.g.,the food taste data given by the customers,the quality data obtained through the evaluation of inspectors,the data for describing human perceptions,etc.There have been some papers dedicated for the design of control charts with linguistic data or fuzzy data.WANG[3]proposed the representative values control charts with both probability rule and membership function decision rules,for which the linguistic data(fuzzy data)are transformed into scalars referred to as representative values of the fuzzy data.In their paper four kinds of transformation formula have been proposed:fuzzy mode,fuzzy midrange,fuzzy median and fuzzy average.YU,et al[4]proposed a sequential probability ratio test(SPRT)control scheme for linguistic data based on KANAGAWA,et al's estimated probability densityfunction,which lays a base for constructing a CUSUM chart with linguistic data.However,in their approach fuzzy data have to be transformed into their respective representative values.WANG[5]presented a CUSUM control chartwith fuzzy data by using a novel representative value that is a sum of central value of the fuzzy data with its fuzziness value. GÜLABY[6-7]present a direct fuzzy approach to construct a control chart with fuzzy data.FARAZ,et al[8]present a Shewhart chart with trapezoidal fuzzy data by using the concept of fuzzy random variables. GRZEGORZEWSKI[9]presented an outlook for statistical process control with fuzzy data and proposed a fuzzy Shewhart control chart in which the necessity index of strict dominance(NSD)proposed by DUBOIS is applied formaking decisions.
Most of the works mentioned above considered the control charts with representative values of fuzzy data.Since the representative value of a fuzzy data may result in losing important information included in original data,it is desirable to develop a suitable direct fuzzy way without using representative values.A sort of nonparametric CUSUM chart for LR-fuzzy data had been proposed in Ref.[10],on which we further consider some improvement and present some simulation.
1 Fuzzy data and sam plemoments
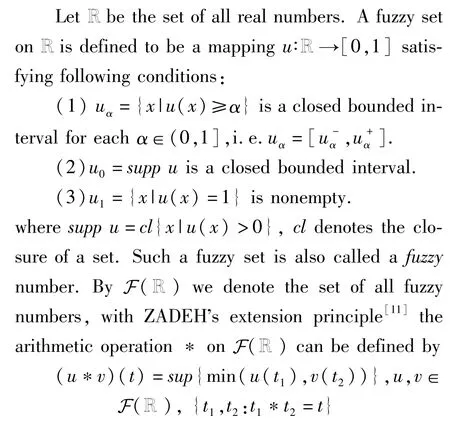
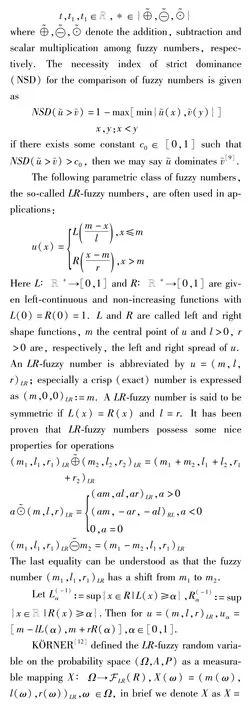
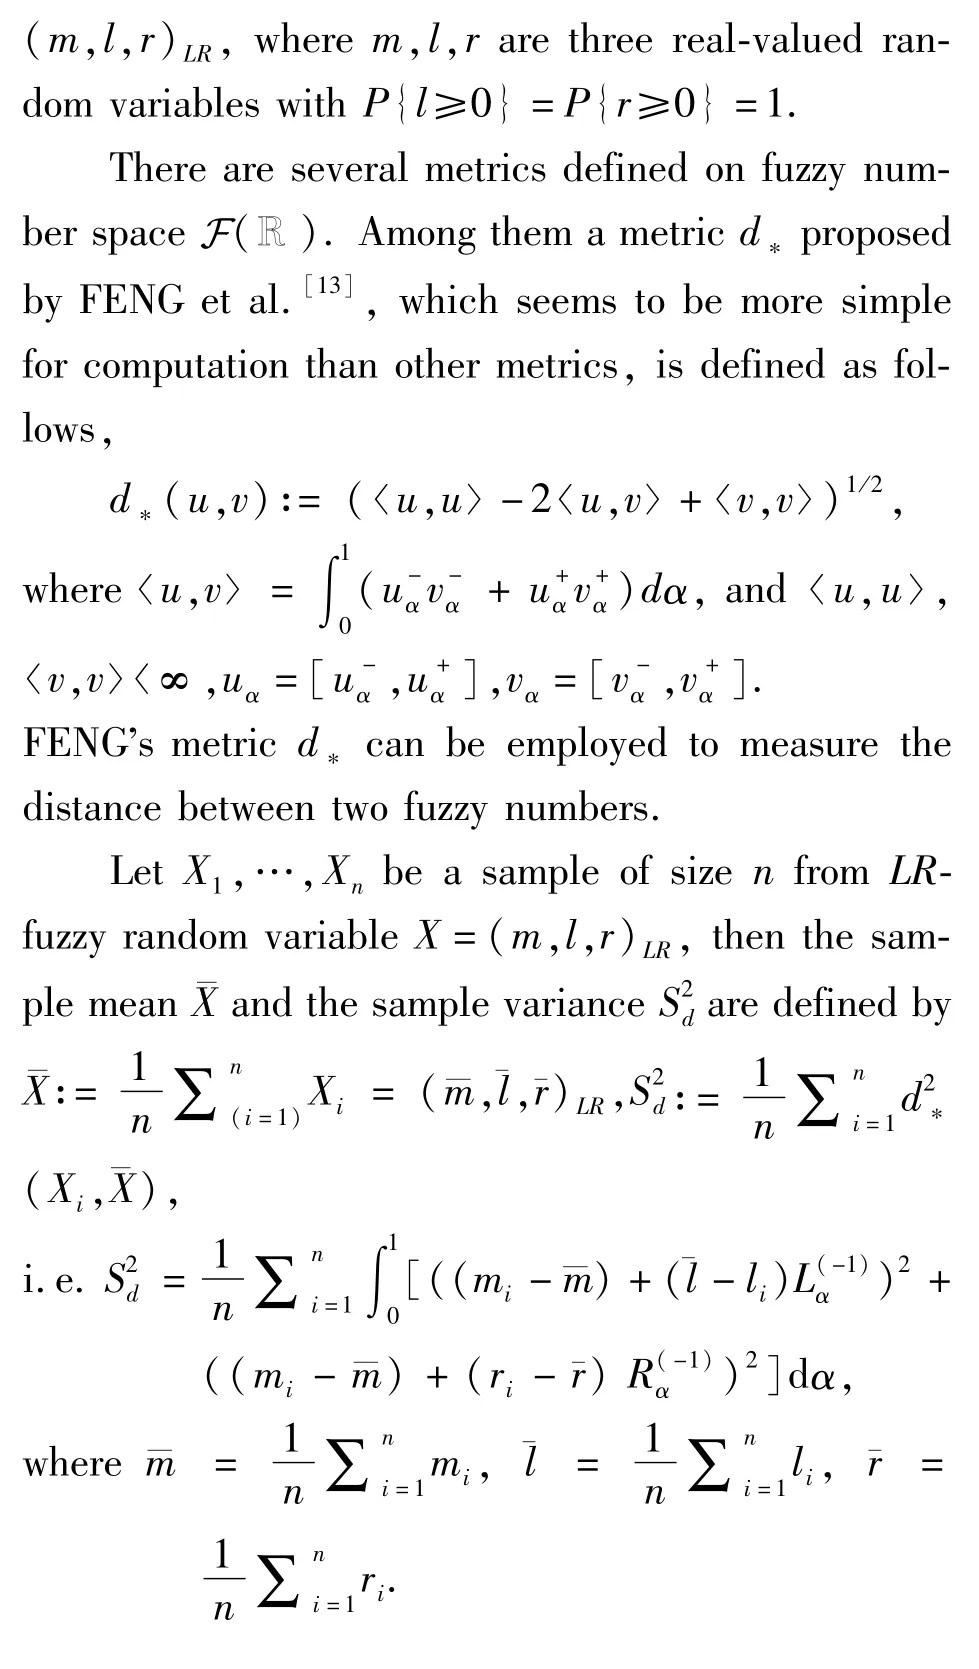
2 Some fuzzy approach for CUSUM
The conventional CUSUM chart is usually used formonitoring real valued quality characteristics data.For a given sequence of crisp observations{Xn,n=1,2,…}on normal population,themonitored parameter of interest is typically the processmean,μn=E(Xn).When the purpose is to detect a small change in the process mean,one might specify the levelsμ0andμ1>μ0(orμ1<μ0)such that under normal conditions the values ofμishould fall below(or above)μ0,and the values ofμnabove(or below)μ1are considered undesirable and should be detected as soon as possible.The CUSUM chart can be used tomonitor the abovementioned processwith the cumulative sum test-statistics Sn=max{0,S(n-1)+Xn-K}(or Tn=min{0,T(n-1)+Xn+K})and signal if Sn>h(or Tn<-h),where h is the control limit derived from a confidence interval assuming a Gaussian distributed observation,which usually equals four or five times the standard deviation of sample,Xn(n≥1)are the samplemeans at time tn,S0=T0=0,and K is the reference value.
Assume that in the phase I stage of amonitored processwe can obtain the“in control”fuzzy process mean value˜μ0and the measurement value Sd0of the fuzzy process variability based on a k group independent symmetric LR-number valued sample of size m,
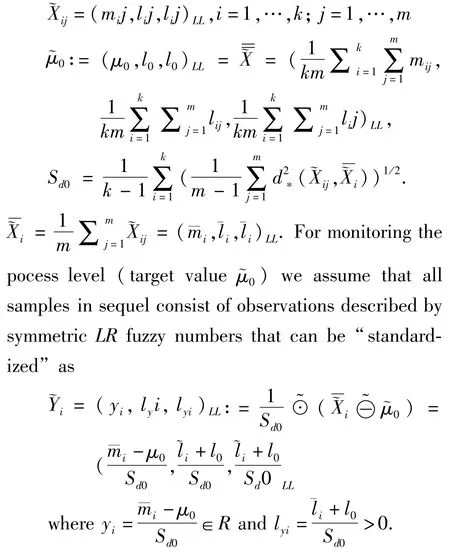
Note thathere the“standardized”procedure is a formally standardization of a random variable,and of the“standardized”result(yi,lyi,lyi)LLthe center variable yiis an approximate standardization of the original center variable m,however,the spread variable lyimay be not an approximate standardization of the original spread variable l.
The test statistics Sn,Tnof a two-sided CUSUM chart then will be expanded to case of fuzzy data(fuzzy quantities)depending upon the samplesi,i=1,…,k.By Extension principle[11],the fuzzy version of the test statistic can be defined as

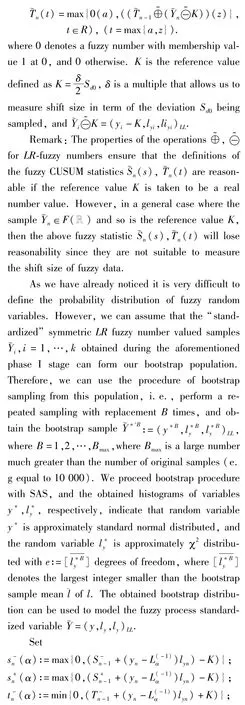
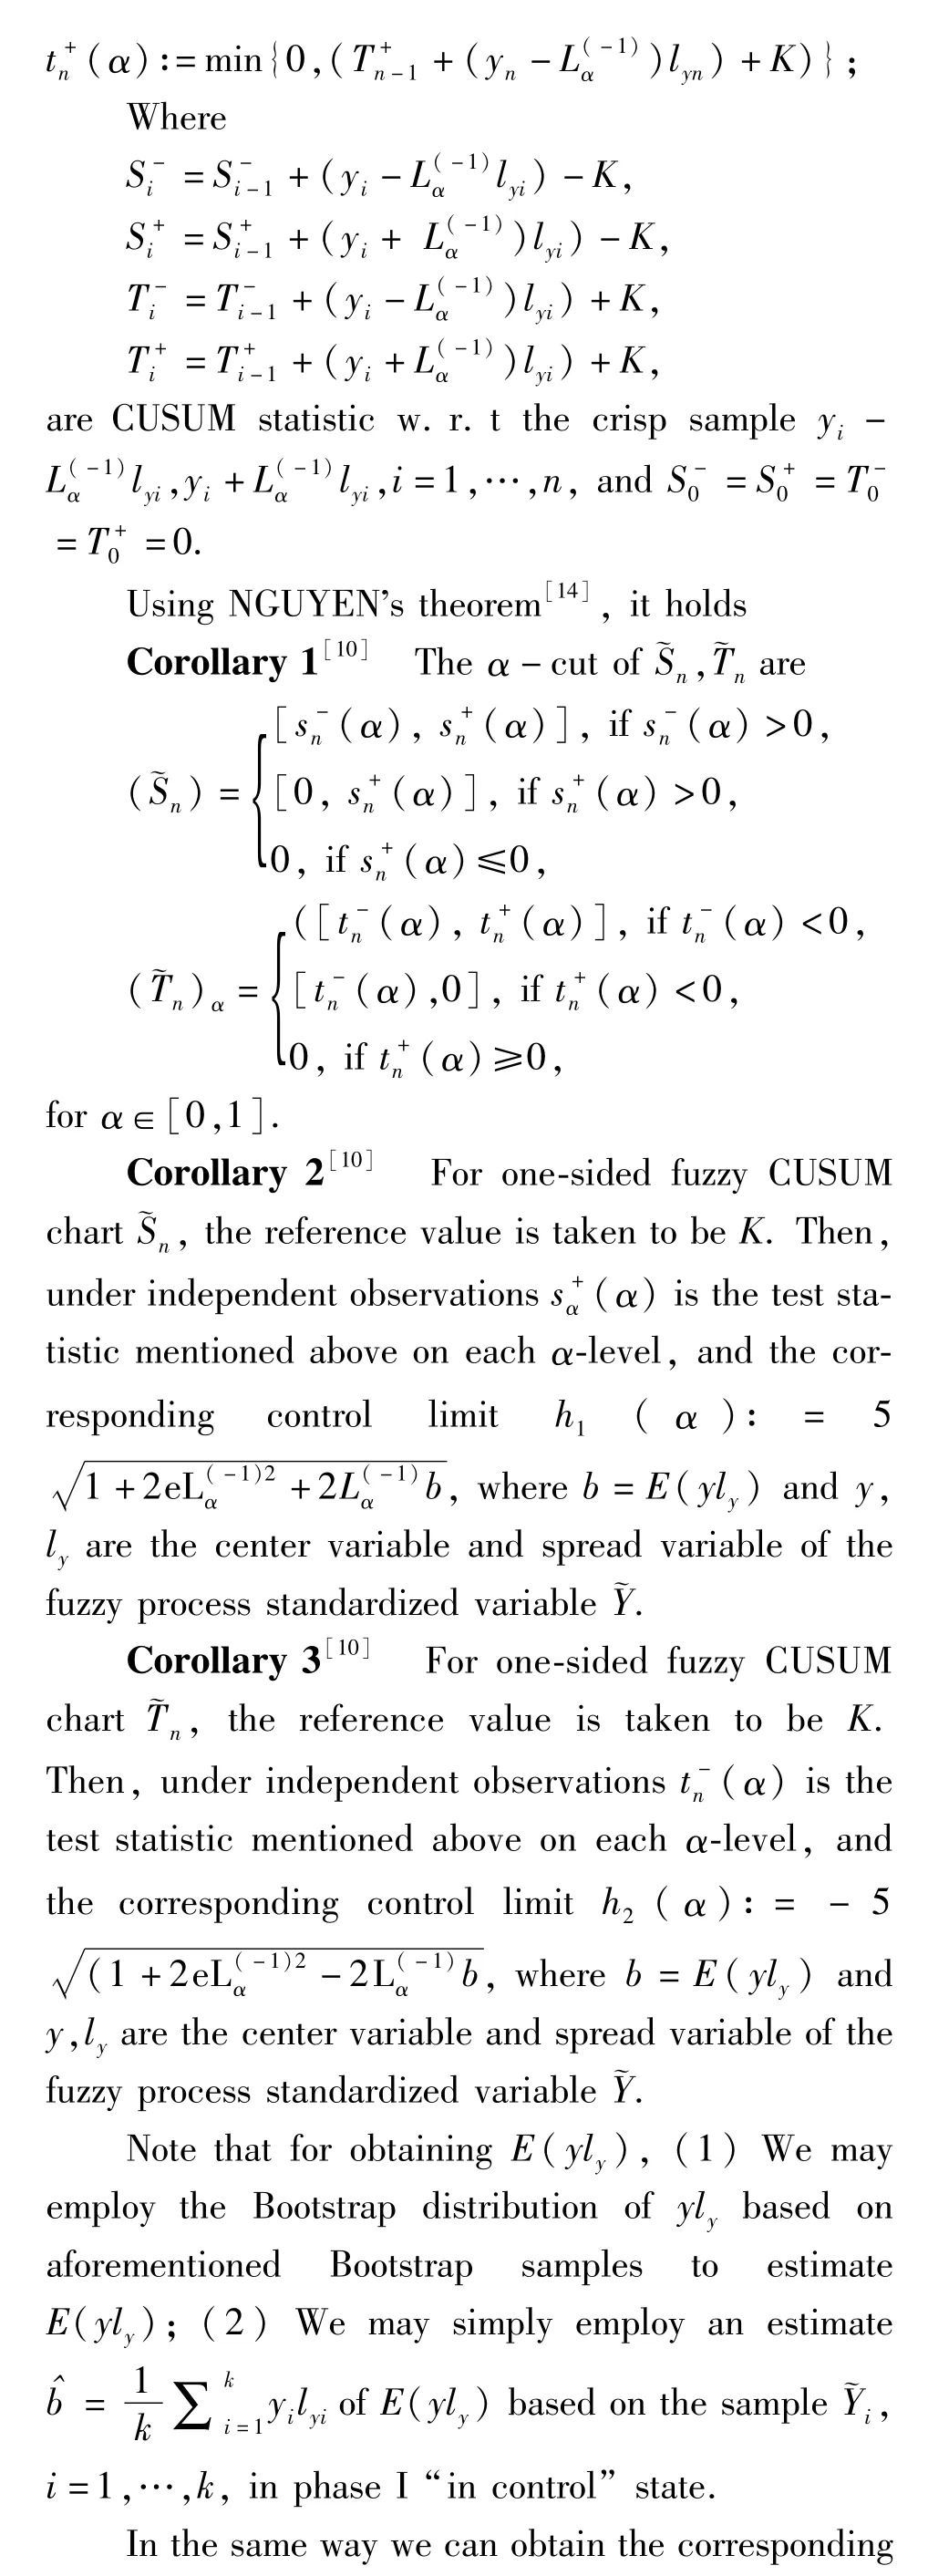
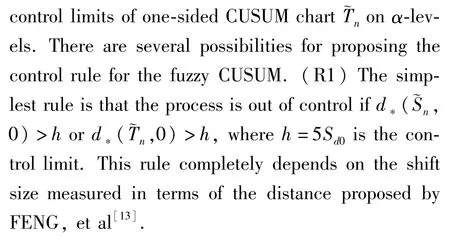
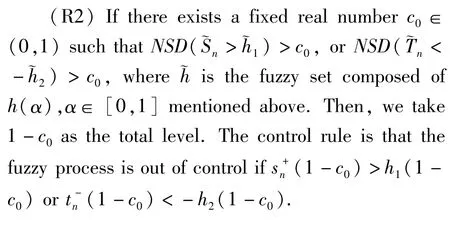
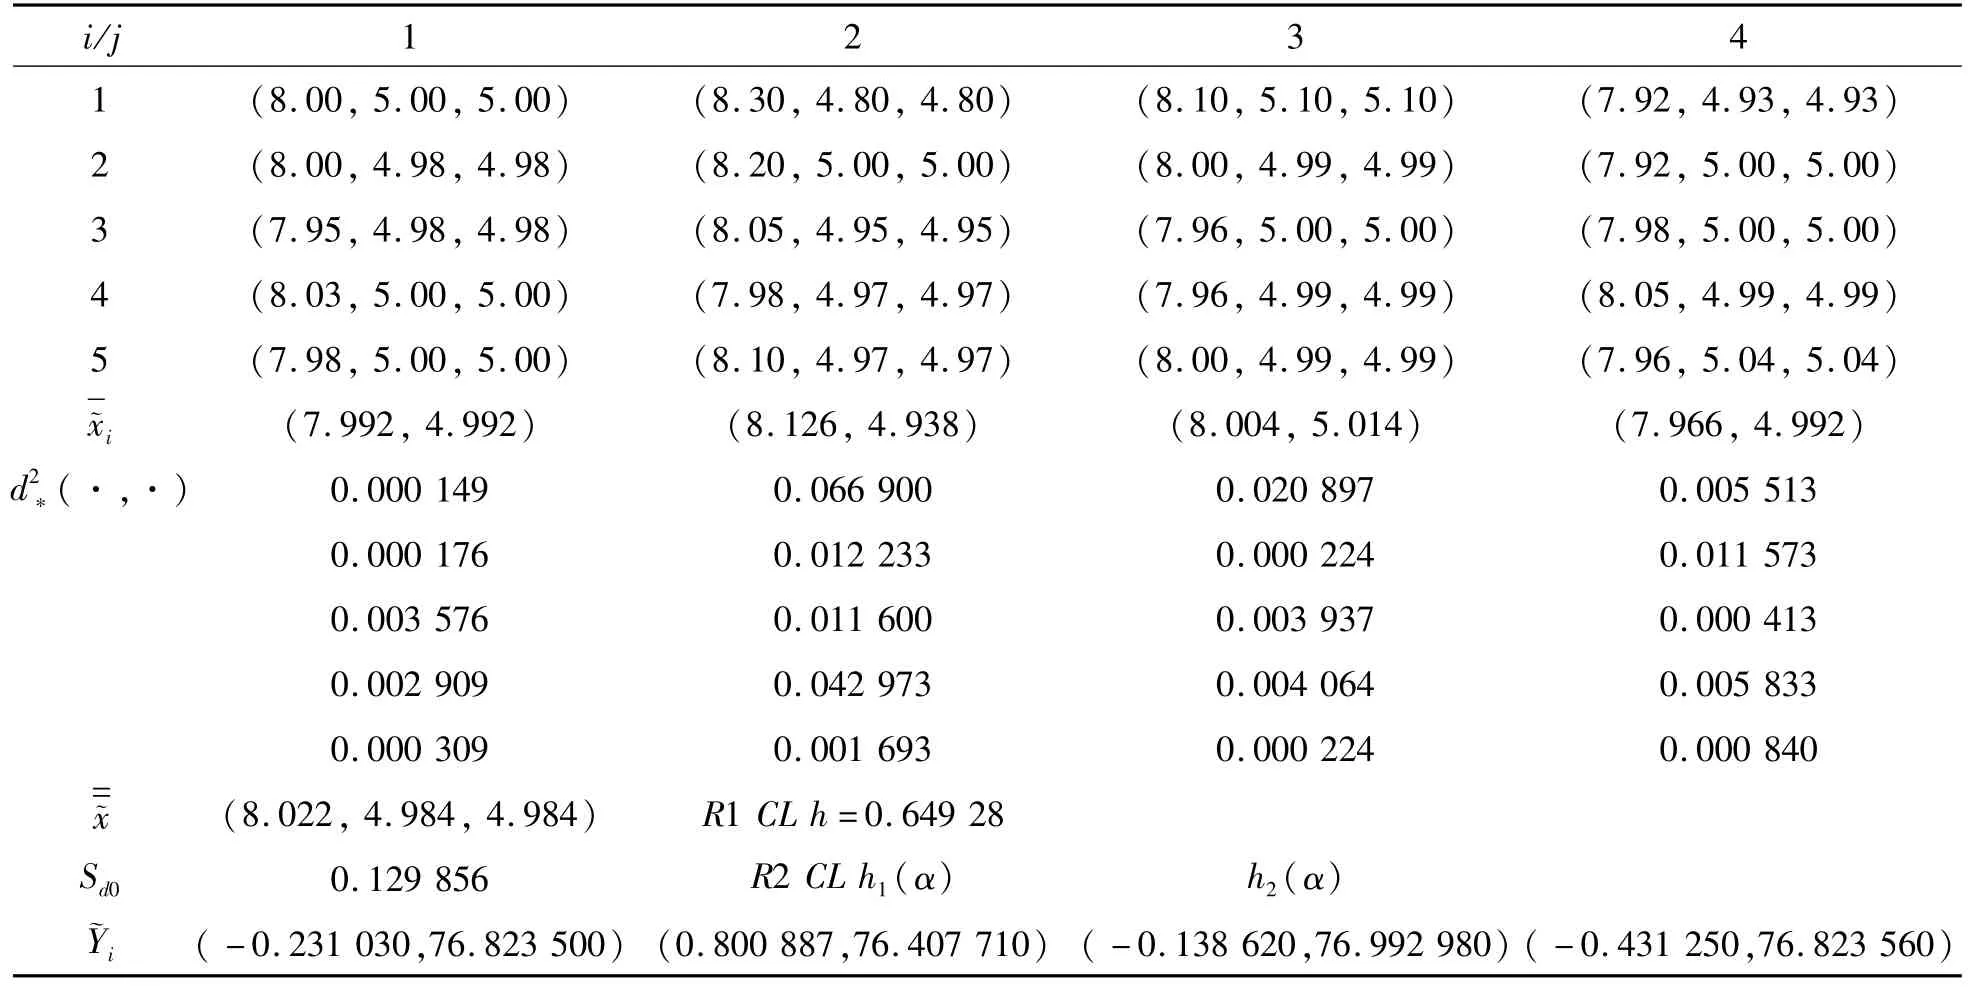
Table 1 The 4 group of size 5 symmetric triangular fuzzy sample data in phase I
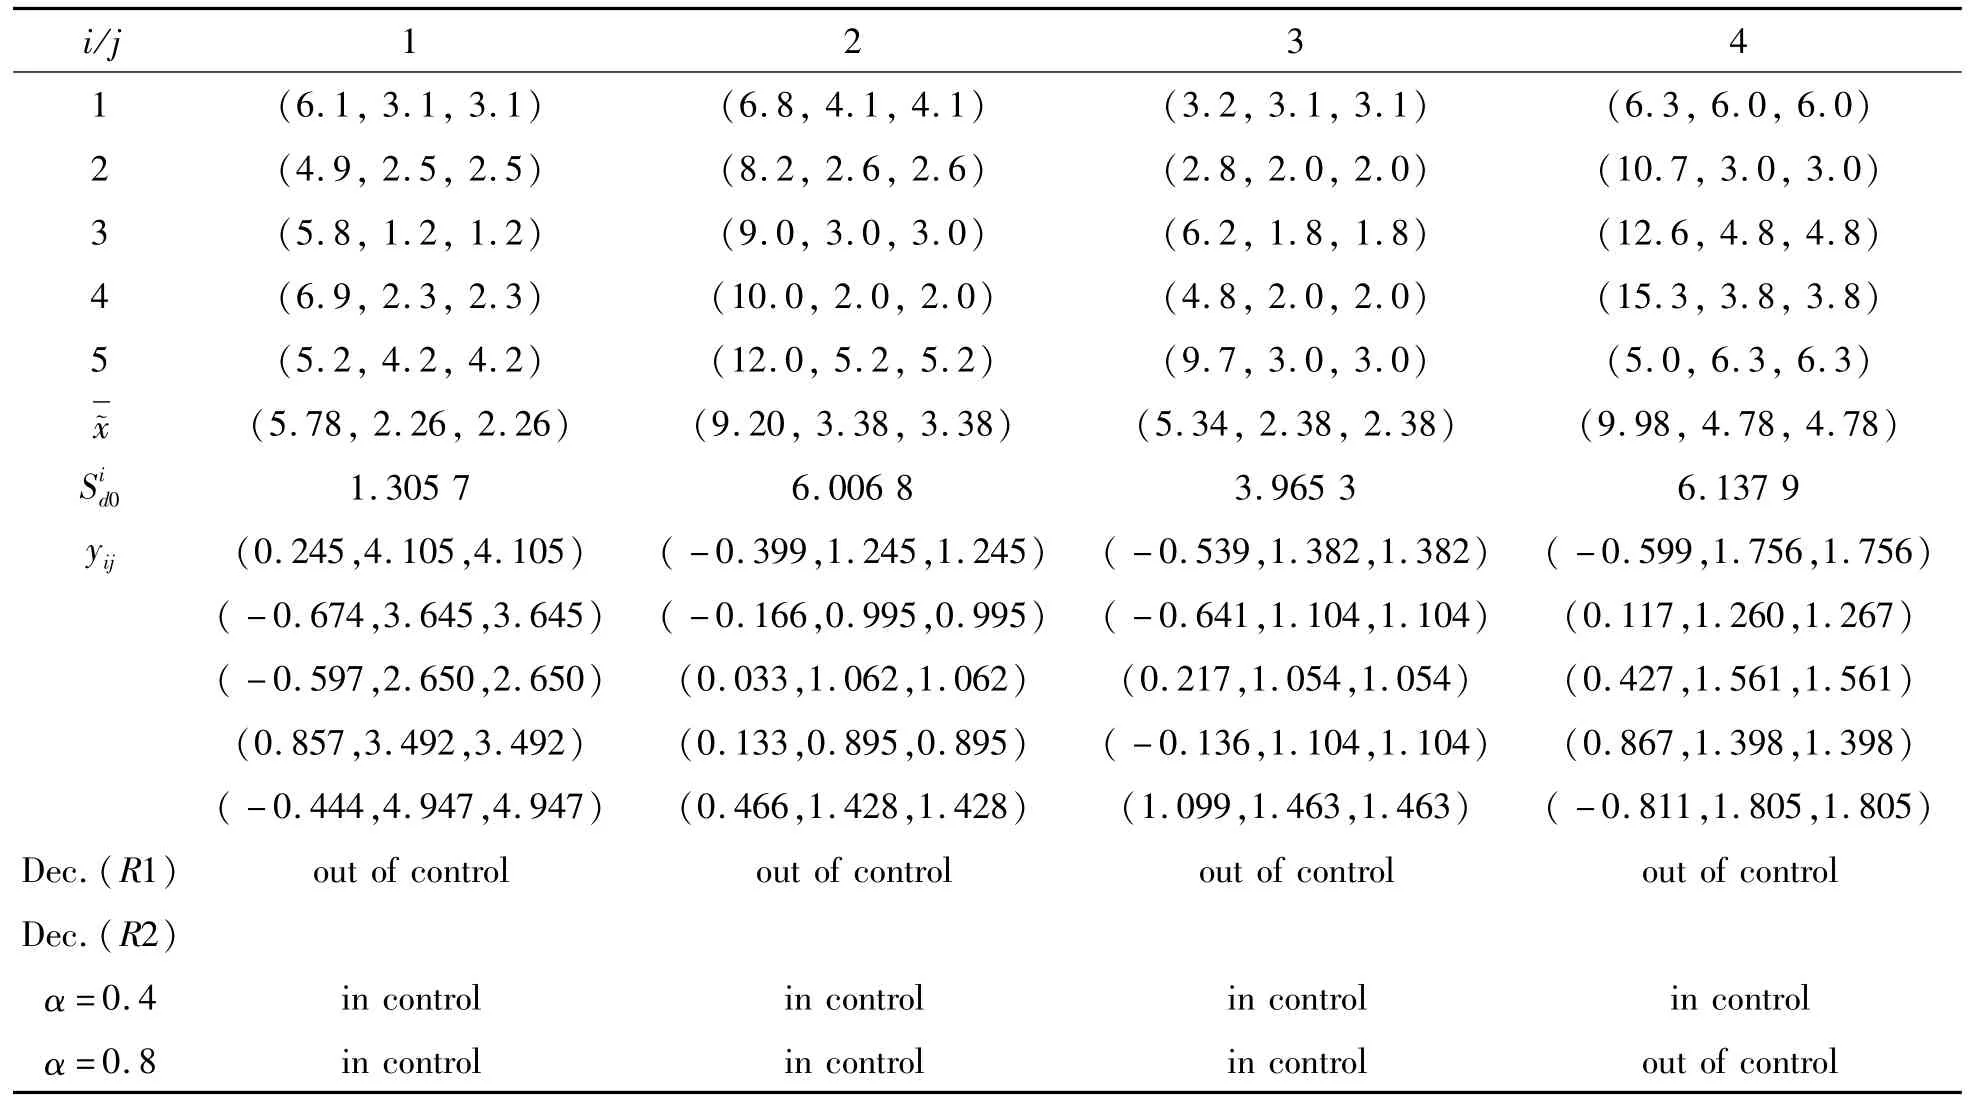
Table 2 The 4 group of size 5 fuzzy data in phase IIand the control status with R1 and R2(K=0.3)
3 Exam ple of simulation

[1] WETHERILLG,BROWN D.Statistical process control[M].London:Chapman and Hall,1991.
[2] PAGE E.Continuous inspection schemes[J].Biometrika,1954,41:100-114.
[3] WANG J,RAZ T.On the construction of control charts using linguistic variables[J].Int JProd Res,1990,28:477-487.
[4] YU F,LOW C,CHENG S.A design for an SPRT control scheme based on linguistic data[J].Int JProd Res,2003,41(6):1299-1309.
[5] WANG D.A CUSUM control chart for fuzzy quality data[C]∥Advances in Soft Computing,Berlin,Heidelberg:Springer Verlag,2006,37:357-364.
[6] GÜLABY M,KAHARAMAN C.An alternative approach to fuzzy control charts:Direct fuzzy approach[J].Inf Sci,2007,177:1463-1480.
[7] GÜLABY M,KAHARAMANC.Developmentof fuzzy process control charts and fuzzy unnatural pattern analysis[J].Compu Stat Data Anal,2006,51:433-445.
[8] FARAZ A,SHAPIRO A.An application of fuzzy random variables to control charts[J].Fuz Set Sys,2010,161:2684-2694.
[9] GRZEGORZEWSKIPP,HRYNIEWICZO.Softmethods in statisticalquality control[J].ContCyber,2000,29:119-140.
[10]WANG D,HRYNIEWICZO.The design of a CUSUM control chart for LR-fuzzy data[C]∥Proceedings of the 2013 Joint IFSAWorld Congress NAFIPSAnnual Meeting,Edmonton,Canada,June 24-28,2013:175-180.
[11]ZADEH L.The concept of a linguistic variable and its application to approximate reasoning Parts 1~3[J].Inf Sci,1975(8):199-249;1975(8):301-357;1975(9):43-80.
[12]KÖRNER R.An asymptoticα-test for the expectation of random fuzzy variables[J].JStat Plan Infer,2000,83:331-346.
[13]FENG Y,HU L,SHU H.The variance and covariance of fuzzy random variables and their applications[J].Fuz Set Sys,2001,120:487-497.
[14]NGUYEN H.A note on the extension principle for fuzzy sets[J].JMath Anal Appl,1978,64:369-380.
【责任编辑:周 全】
A fuzzy CUSUM control chart based on bootstrap distribution
WANG Dabuxilatua,b,HUANG Hui-tingc,JIANG Cuic,ZHANG Q iu-yunc
(a.School of Economics and Statistics;b.Lingnan Research Centre for Statistical Science;
c.School of Mathematics and Information Sciences,Guangzhou University,Guangzhou 510006,China)
The process variables are sometimes imperfect in representing the observed process information about products or services.Fuzzy numbers are recommended to be used in above cases.We further improve a fuzzy Cumulative Sum(CUSUM)control chart,in which fuzzy data are viewed as a fuzzy random variable with a bootstrap distribution for the center and two spreads.A simulation example is given.
control chart;fuzzy data;bootstrap
O 213.1;O 159
A
date:2015-02-08; Revised date:2015-03-07
s:Research supported by NNSF of China(11271096)
O 213.1;O 159
A
1671-4229(2015)03-0004-06
Biography:WANG Dabuxilatu(1959-),male,professor.E-mail:wangdabu@gzhu.edu.cn
