基于BOS技术的密度场测量研究
2015-06-23张俊,胥頔,张龙
张 俊, 胥 頔, 张 龙
(中国空气动力研究与发展中心, 四川 绵阳 621000)
基于BOS技术的密度场测量研究
张 俊, 胥 頔, 张 龙
(中国空气动力研究与发展中心, 四川 绵阳 621000)
背景纹影技术是一种基于图像的大视场、非接触的定量流场测试技术,在流场测量中有着广阔的应用前景。详细介绍了背景纹影技术的基本原理,并从理论上对系统灵敏度以及空间分辨率进行了深入分析。根据背景纹影技术原理,深入设计了背景斑点图案,搭建了密度场测量系统,基于火焰流场和喷流流场开展了定量测量研究,并给出了流场密度和温度分布测量结果。结果表明,背景纹影技术可以便捷、有效地实现流场密度测量和温度测量,为实现大视场定量的流场密度测量提供了一种简洁有效的方法。
背景纹影;密度测量;流场显示;非接触;定量测量
0 引 言
对于现代工业应用和发动机研发而言,喷流结构和热力学特性研究是一项重要的课题。实际上,诸多的物理参数均依赖于气体的密度和温度特性。因此,密度和温度是最基本的实验数据。例如,燃气涡轮机排出气体的密度场分布剖面内含了发动机和喷嘴的性能信息。对于军用飞行器而言,温度特征就意味着明显的红外特征[1]。在风洞实验中,模型绕流流场的密度场信息是飞行器气动外形优化的重要数据,其定量测量也一直是流场研究的重点[2]。
目前,用于流场密度测量的技术主要包括纹影技术、干涉技术等。传统纹影技术是一项用于流场密度显示的重要技术。虽然纹影技术的实现有多种方式,但是通常只是将其作为一种定性显示的手段,而缺乏定量测量的能力。干涉测量虽然可以提供定量的测量结果,但是其对光路布置、风洞光学接口等有着较为苛刻的要求,不易实现。因此,基于密度场定量测量的需求,Meier GEA等人在流场测量领域进行了长期试验和理论积累后,发展了背景纹影测量技术(Background Oriented Schlieren,BOS)[3-4]。它是将用于流场测量的PIV技术和纹影技术结合起来创造的一种流场测量的全新技术,结合了PIV的粒子示踪、粒子图像处理技术和传统纹影技术的基本原理。它可以像PIV技术一样进行较大视场的流场测量,但是又不需要使用传统纹影技术中的大量精密的光学仪器,能更好的满足工程需要。例如,可实现风洞测量、叶片旋流测量、气体射流测量、爆炸流场测量等[5-8]。之外,采用高帧频相机记录流场图像,还可以实现流场的时间演化特征测量。相比于传统纹影技术,由于测量视场扩大,BOS技术空间分辨率有所降低。 BOS技术不仅实验布置相对简单,而且通过算法重构可定量获取流场密度场分布信息。近十几年来,国外研究单位频繁使用BOS技术进行流场定性分析和定量测量的实例证明[9-11],BOS技术作为流场显示和定量测量的先进技术,在流动研究中有着极大的应用价值,是一项重要的流场测量的基本手段。但国内相关研究才刚开展[12-13],可进一步深入开展BOS技术的探索研究。
为了适应风洞发展的需要,满足风洞流场测量技术精细化、多样化的要求,开展了BOS技术原理性研究,详细介绍了BOS技术的测量原理,深入设计了背景斑点图案,搭建了密度场测量系统,基于火焰流场和喷流流场开展了定量测量研究,并给出了初步的流场密度和温度分布测量结果。
1 BOS技术测量原理
正如经典纹影技术一样,背景纹影技术揭示了气体的折射率与密度之间的关系。当一束光线入射进入一种存在折射率梯度的介质中时,光线会向着折射率增大的方向偏折,如图1所示。由格拉斯通-戴尔定律可知,气体折射率与密度的关系可用下式表示:
(1)
式中,n为气体折射率,ρ为气体密度,KG-D为格拉斯通-戴尔常数,取决于气体的特性,如组分等。同时,KG-D与光波长有关,但光波长对其影响较小。对于空气而言,二者之间存在如下关系:
(2)
式中,λ为光波长。穿过的光线轨迹的曲率半径可表示为折射率梯度,如下式:
(3)
式中,R为光线轨迹的曲率半径,n为折射率。那么,光线的偏折角可由下式给出:
(4)
式中,L为光线穿过的路径长度,ρ为密度梯度。上式表明,光线的偏折角正比于气体介质的密度梯度。
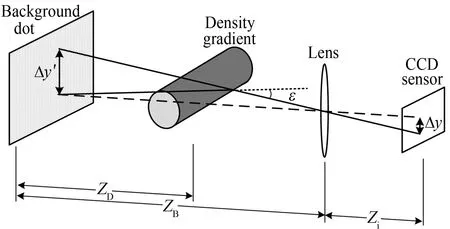
图1 背景纹影测量原理图
测量时,为了获得流场显示结果,需要拍摄获得两幅背景点图案的图像。一幅为停风状态的图像,即不存在密度梯度情况(图像无畸变);另一幅为吹风状态时的图像,存在密度梯度,相应的背景图案存在变形。采用互相关算法可解算出两幅图像的互相关情况,并计算得出两幅图像中背景斑点的位移矢量。当光线穿过测量体积内的有密度梯度的区域时,位移矢量就代表了光线在该处的偏折情况。从位移矢量可获得水平和竖直两个方向的分量,那么就可重绘类似纹影的图像,从而得到定性的流场显示结果。从另一个角度来看,背景某点的位移矢量反映了该处的折射率梯度。
当光线在非均匀介质中传输时,根据费马原理,如果光线偏移量远远小于流场宽度,则有[14-15]:
(5)
其中,C为常数,与实验配置相关;Δx、Δy为测量获得的不同方向的斑点位移量。对整个位移矢量场的x和y方向求偏导,则可以获得如下的泊松方程[10]:
(6)
对于给定的位移矢量场,以及给定的边界条件,式(6)可通过有限差分或有限元方法求解,进而获得测量区域的投影积分效果的定量折射率场分布,并通过格拉斯通-戴尔公式,计算求出定量密度场信息。如果条件允许,能够搭建多相机图像采集系统,获得多个方向的投影数据,那么,通过复杂的滤波反投影算法求解,可获得流场三维密度场的定量测量结果。
2 系统灵敏度与分辨力
如图1所示,由于光束的偏折包含了空间折射率梯度场沿光程的积分效应,因此,图像斑点发出光线的偏折角可表示为:
(6)
式中,ZD为测量流场的半宽度。由图1的几何关系可知,图像平面斑点位移量Δy与虚拟图像平面斑点位移量Δy′之间关系可表示为:
(7)
假设相机镜头焦距为f,则有:
(8)
因此,对于小偏折角而言,可得偏折角表示如下:
(9)
进一步,可得图像平面的位移量表达式如下:
(10)
从上式可知,流场中心与背景的距离越大,斑点位移量越大,则系统灵敏度越高,越容易实现流场低密度梯度的探测。但是,随着系统灵敏度的极大提升,由于气动光学效应,会使得背景斑点在CCD相机光敏面上成像模糊,使得系统分辨力降低,从而导致互相关算法探测斑点位移的计算精度下降;另一方面,位移量增大,要求互相关算法设置的查询子窗口相应的增大,会导致空间分辨率的降低。因此,实际中需根据流场情况以及测量环境实现灵敏度与分辨力的有机统一。
3 实验研究
背景纹影测量系统如图2所示,测量系统包括背投式LED阵列光源、背景图案、CCD相机、被测流场4个部分。首先,通过背投式LED阵列光源对背景图案板进行均匀照明,然后通过CCD相机拍摄获取无流场时与有流场时的背景图案照片。而后,通过斑点位移探测算法进行数据处理,求取背景斑点发出光线由于受流场密度梯度影响发生的偏移量。通过求解泊松方程获得带积分效应的平均折射率场,并获得定量的密度场投影结果。

图2 背景纹影测量系统示意图
在背景纹影测量中,背景图案的选取和制作,极大地影响着测量结果。因此,必须对其进行优化设计。根据互相关算法解算斑点位移的原理,一般地,背景斑点在图像中大小约3pixel为宜,而点与点之间的间距在2~4pixel之间最好[16]。而背景斑点的形状对于密度场求取影响较小,并且一般采用黑底白点或者白底黑点的对比形式,以提高图像对比度,保证图像处理的高质量。
背景图案的制作可根据实际工程运用场合采用不同的方案。在实验室中,可采用Matlab中的Pseudo Random算法打印获得,可在纸上或带背胶的纸上实现。实际中,也可通过机械加工获得多孔的金属模板,将模板覆盖在塑料上,进行油漆喷涂获得背景图案。在一些高速大尺寸风洞实验中,还采用了在洞壁上喷涂油漆形成背景的方法。因此,制作方便实用的背景图案,也是使得背景纹影技术更为高效简洁的一个重要方面。实验采用的背景图案如图3所示。
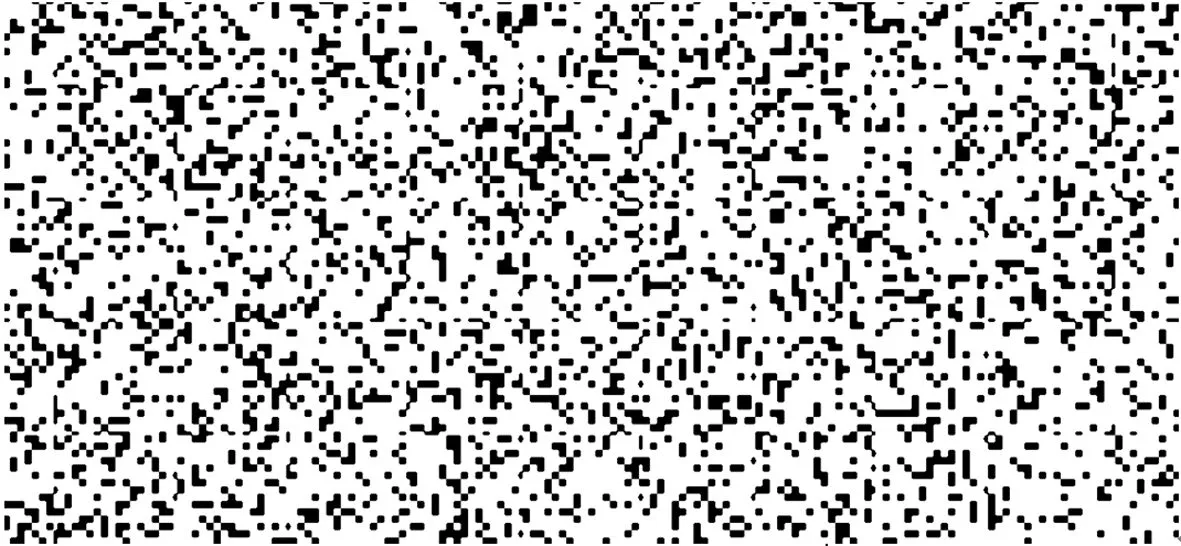
图3 采用的背景斑点图案
实验中,分别采用平面火焰炉、电吹风模拟三维流场情况,进行了背景纹影测量实验研究,通过研究获取了其上方热流流场的精细流场结构以及带积分效果的定量密度场投影分布结果,并根据气体状态方程在近似条件下的使用,给出了温度场分布信息。
4 实验结果及分析
4.1 平面火焰炉上方流场测量
测量时,采用逐行扫描CCD进行图像采集,分辨率2048pixel×2048pixel,光源为120W白光LED阵列,实验对象为平面火焰炉上方热流流场。CCD相机与流场距离约735mm,背景与流场距离约400mm。图4~8分别给出了对平面火焰炉上方流场测得的斑点位移矢量图、位移云图、折射率场分布、密度场分布、温度场分布。可见,该流场下部靠近火焰炉部分结构对称,流场上部由于对流存在,导致了对称结构的破坏。结果表明,BOS技术不仅能够获得清晰细腻的流场结构分布,而且获得了带积分效果的投影折射率场、密度场、温度场定量的分布信息。

图4 平面火焰炉上方流场位移矢量图
Fig.4 Displacement field of the thermal convection flow over the plane flame furnace

图5 平面火焰炉上方流场位移云图
Fig.5 Displacement nephogram of the thermal convection flow over the plane flame furnace
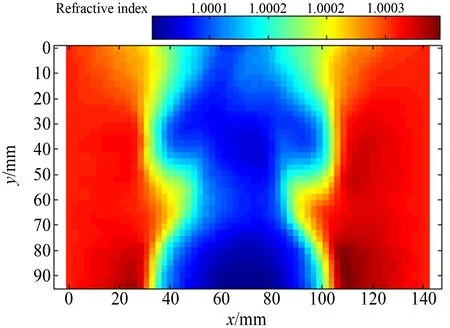
图6 平面火焰炉上方流场折射率场分布
Fig.6 Refractive index field of the thermal convection flow over the plane flame furnace

图7 平面火焰炉上方流场密度场分布
Fig.7 Density field of the thermal convection flow over the plane flame furnace
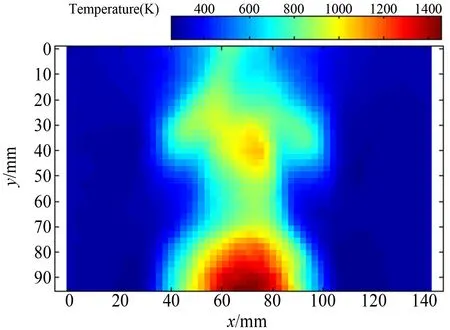
图8 平面火焰炉上方流场温度场分布
Fig.8 Temperature field of the thermal convection flow over the plane flame furnace
4.2 喷流流场测量
采用4.1节中相同实验配置,实验对象为电吹风热对流流场。CCD相机与流场距离约900mm,背景与流场距离约1030mm。图9~13分别给出了对电吹风流场测得的斑点位移矢量图、位移云图、折射率场分布、密度场分布、温度场分布。可见,该流场自喷嘴向外扩展,且结构较为对称,反映了喷流流场的细腻结构。

图9 电吹风流场的位移矢量图
Fig.9 Displacement field of the thermal convection flow from the heat gun
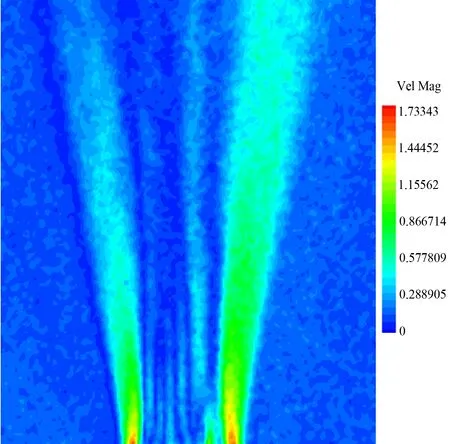
图10 电吹风流场的位移云图
Fig.10 Displacement nephogram of the thermal convection flow from the heat gun

图11 电吹风流场的折射率场分布
Fig.11 Refractive index field of the thermal convection flow from the heat gun
5 结 论
背景纹影测量技术是一种应用纹影原理、基于数字摄像机和互相关算法的流场密度场定量测量的技术,在流场测量中有着巨大的应用潜力。利用平面火焰炉和电吹风模拟流场开展了BOS技术测量研究,成功获得了定量的流场密度和温度分布测量结果。实验结果表明,BOS技术实验配置简单,容易实现,背景制作方便,视场大小可通过摄像系统进行针对性选择,在工程应用中有得天独厚的优势。BOS技术能够方便有效地实现流场密度测量和温度测量,为实现大视场定量的流场密度测量提供了一种简洁有效的方法。

图12 电吹风流场的密度场分布
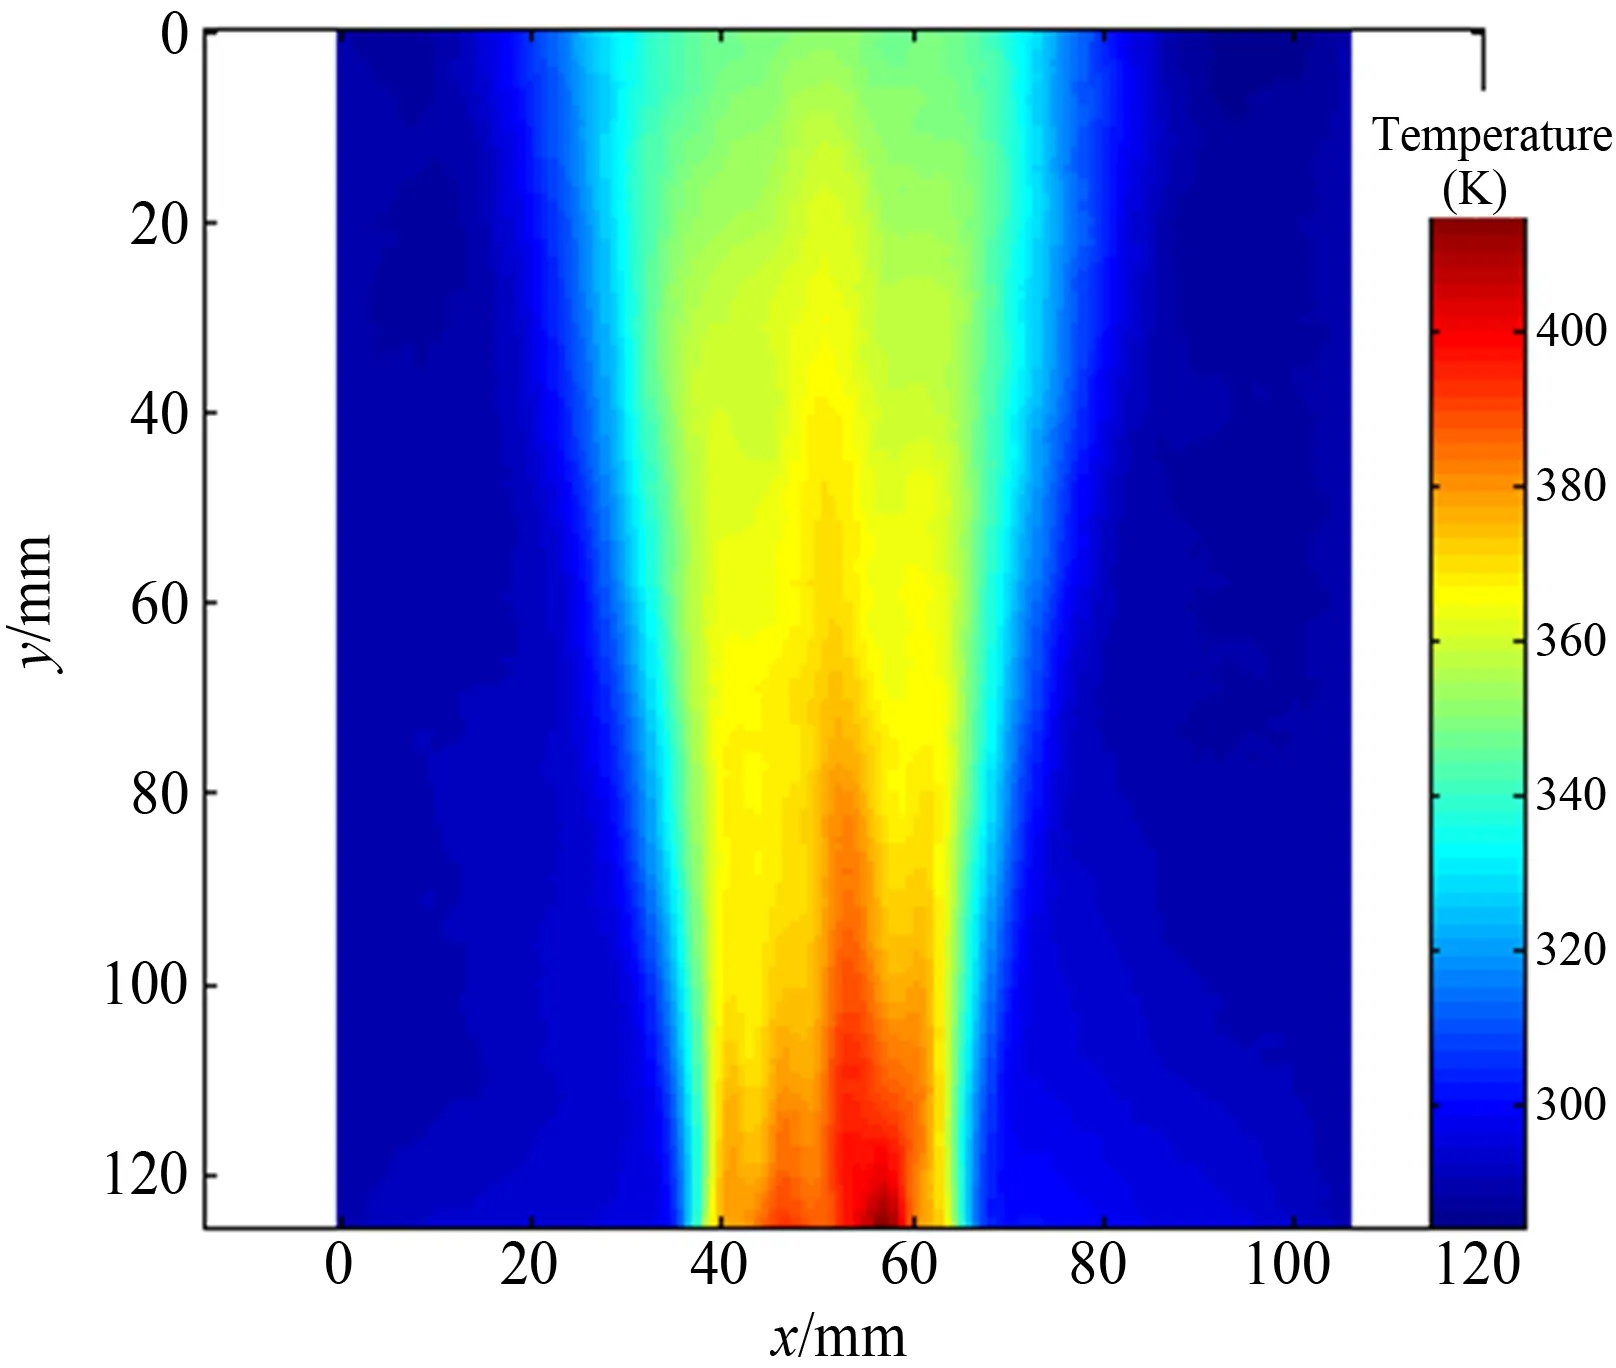
图13 电吹风流场的温度场分布
Fig.13 Temperature field of the thermal convection flow from the heat gun
[1] Vasudeva G, Honnery D R, Soria J. Non-intrusive measurement of a density field using the Background Oriented Schlieren(BOS) method[C]. Fourth Australian Conference on Laser Diagnostic in Fluid Mechanics and Combustion, 2005.
[2] 郭隆德, 杨建军, 吴运刚. 利用光学层析技术重构超声速绕流流场密度分布[J]. 实验流体力学, 2009, 23(2): 69-72.
Guo Longde, Yang Jianjun, Wu Yungang. Reconstruction of density distribution in the supersonic flow field with optical computerized tomograph[J]. Journal of Experiments in Fluid Mechanic, 2009, 23(2): 69-72
[3] Meier G E A. New optical tools for fluid mechanics[C]//Proc 8th International Symposium on Flow Visualization, Sorrento, 1999.
[4] Meier G E A. Computerized background oriented schlieren[J]. Exp Fluids, 2002, 33:181-187.
[5] Reinholtz C K, Heltsley F L, Scott K E. Plume visualization of orion launch abort vehicle jettison motors using background-oriented schlieren[R]. AEDC-TR-09-T-13, 2010.
[6] Richard H, Raffel M, Rein M. Demonstration of the applicability of a background oriented schlieren(BOS) method[C]. 10th Int Symp Appl Laser Techniques to Fluid Mechanics, Lisbon, Portugal, 2000.
[7] Venkatakrishnan L. Density measurements in an axisymmetric underexpanded jet using Background Oriented Schlieren technique[R]. AIAA2004-2603.2004.
[8] Venkatakrishnan L, Suritanarayanan P, Jagadeesh G. Velocity and density field measurements of a micro-explosion[C]. 15th International Symposium on Flow Visualization,2012.
[9] Friedrich L, Masanori O, Daniel K. Reconstruction of the unsteady supersonic flow around a spike using the colored background oriented schlieren technique[J]. Journal of Flow Control, Measurement & Visualization, 2013, (1): 69-76.
[10] Venkatakrishnan L, Meier GEA. Density measurements using background oriented schlieren technique[J]. Experiments in Fluids, 2004,37(2):237-247.
[11] Todoroff V, Plyer A, Lebesnerais G. 3D reconstruction of the density field of a jet using synthetic BOS images[C]. 15th International Symposium on Flow Visualization, 2012.
[12] 何霖, 易仕和, 赵玉新, 等. BOS技术在流动测量中的应用[J]. 国防科技大学学报, 2010, 32(1):1-5
He Lin, Yi Shihe, Zhao Yuxi, et al. The application of BOS in flow measuremen[J]. Journal of National University of Defense Technology, 2010, 32(1):1-5
[13] 周昊, 吕小亮, 李清毅, 等. 应用背景纹影技术的温度场测量[J]. 中国电机工程学报, 2011,31(5):63-67
Zhou Hao, Lü Xiaoliang, Li Qingyi, et al. Temperature measurements using the background oriented schlieren technique[J]. Proceedings of the CSEE, 2011,31(5):63-67
[14] Dalziel S B, Hughes G O, Sutherland B R.Whole field density measurements by ‘synthetic schlieren’[J]. Exp Fluids, 2000,28:322-355
[15] Merzkirch W. Flow Visualization[M]. Academic Press,1974.
[16] Jeffery E H. Background oriented schlieren pattern optimization[D]. Graduate School of Engineering and Management, Air Force Institute of Technology, Air University, America, 2011.
(编辑:张巧芸)
Research on density measurement based on background oriented schlieren method
Zhang Jun, Xu Di, Zhang Long
(China Aerodynamics Research and Development Center, Mianyang Sichuan 621000, China)
Background Oriented Schlieren method(BOS) is a new technique for flow field measurement based on image with remarkable advantages, such as a big field of view, non-intrusive, and quantitative measurement. It has extensive application prospects in flow field measurement. The BOS experimental setup mainly consists of a structured background pattern of random dots, a LED light source and a CCD camera. It needs two images. One is obtained without the density gradient effect as the reference image. The other one is obtained when there is disturbance in the flow and is stored as the refracted image. The displacement of the background dots is extracted by performing mathematical correlation analysis on a cluster of particles within each interrogation region between the two frames. The displacement vector field represents the gradient of the refractive index which is further integrated to calculate the line-of-sight integrated refraction index via the solution of Poisson equation. This paper describes the implementation of the BOS technique to realize the quantitative visualization of the density in a flow. The basic principle of BOS is expatiated, and the sensitivity and resolution are analyzed. It is shown that the shift of the background dots and the sensitivity increase with increasing distance of the background field from the object of interest. But on the other hand, improving the sensitivity means reducing the physical resolution, as the interrogation size used in the correlation algorithm would have to be correspondingly larger. And the aero optics effect is getting more prominent at the same time. According to the principle of BOS, the background dot pattern is designed. In the experiment, the size of dots is about 3 pixels. In the later experiment, the dot pattern fits well with the displacement field’s extracting algorithm. And also a density measure system is constructed. Based on the flame flow and jet flow, through the detection of the deflection of a number of light beams passing the flow field, the density depending on the refractivity is obtained. And the preliminary results for the flame flow and the typical jet flow are presented, such as the refractive index field, the density field, and the temperature field. The experimental results show that the density and temperature distribution can be obtained quantitatively by BOS method expediently, effectively and in a compact way.
background oriented schlieren;desity measurement;visualization of flow field;non-intrusive measurement;quantitative measurement
1672-9897(2015)01-0077-06
10.11729/syltlx20140029
2014-03-15;
2014-05-22
ZhangJ,XuD,ZhangL.Researchondensitymeasurementbasedonbackgroundorientedschlierenmethod.JournalofExperimentsinFluidMechanics, 2015, 29(1): 77-82. 张 俊, 胥 頔, 张 龙. 基于BOS技术的密度场测量研究. 实验流体力学, 2015, 29(1): 77-82.
O353.5
A

张 俊(1982-),男,四川中江人,硕士,工程师。研究方向:流场显示与流场测量。通信地址:四川省绵阳市中国空气动力研究与发展中心(621000)。E-mail:zhangjun4117@163.com
