不同生长环境下水稻氮、磷、钾利用相关性状的QTL定位分析
2015-06-12杨树明曾亚文普晓英
杨树明, 曾亚文, 王 荔, 杜 娟, 普晓英, 杨 涛
(1云南省农业科学院生物技术与种质资源研究所, 云南昆明 650205;2农业部西南农业基因资源与种质创制重点实验室, 云南昆明 650223;3云南省农业生物技术重点实验室, 云南昆明 650223; 4云南农业大学农学与生物技术学院, 云南昆明 650201)
不同生长环境下水稻氮、磷、钾利用相关性状的QTL定位分析
杨树明1,2, 曾亚文1, 3*, 王 荔4*, 杜 娟1, 普晓英1, 杨 涛1
(1云南省农业科学院生物技术与种质资源研究所, 云南昆明 650205;2农业部西南农业基因资源与种质创制重点实验室, 云南昆明 650223;3云南省农业生物技术重点实验室, 云南昆明 650223; 4云南农业大学农学与生物技术学院, 云南昆明 650201)

水稻(OryzasativaL.); 近等基因系; 养分吸收; 数量性状基因座; QTL多效性

1 材料与方法
1.1 作图群体
以云南孕穗期强耐冷(2级)地方稻种丽江新团黑谷与十和田杂交、回交,并结合耐冷鉴定培育的包含105个株系的孕穗期耐冷性近等基因系(十和田4//丽江新团黑谷/十和田)BC4F8群体[23-24]。
1.2 试验设计


表1 不同生态点土壤理化性质Table 1 Physical and chemical properties of soils from three eco-sites
1.3 测定指标与方法
1.3.1 产量测定 成熟期,除边行株外,各小区随机选取代表性植株10兜齐地收割、风干,分成稻谷和稻草两部分,测定单株籽粒干重、单株稻草干重和干物质总量,并留作氮、磷、钾测定样。每个家系以该10株的平均值为统计单元进行QTL分析。
1.3.2 叶片硝态氮含量及硝酸还原酶活性测定 孕穗至抽穗期,取每个家系和亲本的剑叶装入塑料袋封口,立即放入冰盒,保存于-80℃超低温冰箱中。硝态氮含量和硝酸还原酶活性(NR)测定参照李合生等[25]的方法进行。
1.3.3 植株氮、磷、钾含量测定 将上述测定产量时备留的稻谷和稻草样品,分别用不锈钢碾槽和微型植物粉碎机粉碎并过0.3mm筛,获得的样品用浓H2SO4-H2O2消煮,测定氮、磷和钾含量。氮采用凯氏定氮法、磷为矾钼黄比色法、钾为火焰光度计法[26]。每个样品重复测定2次,取其平均值为性状表型值。
1.3.4 氮、磷和钾吸收利用效率有关参数计算 3种养分的吸收利用效率有关参数计算参照文献[27]进行。磷、钾的计算公式与氮素相同,以氮为例,计算如下:
氮总吸收量(Total N accumulation,TNA)=稻谷产量×稻谷含氮量+稻草产量×稻草含氮量;
每100 kg籽粒需氮量(N absorption of 100-kg seeds)= 氮总吸收量/稻谷产量×100;
氮素干物质生产效率(N dry matter production efficiency,NDMPE)=干物质积累量/氮总吸收量;
氮素稻谷生产效率(N grain production efficiency,NGPE)=稻谷产量/氮总吸收量;
氮素收获指数(N harvest index,NHI)=稻谷氮吸收量/氮总吸收量×100%。
1.4 基因型鉴定
1.4.1 田间取样与DNA提取 在水稻分蘖期,对亲本及BC4F8群体每个株系选1个单株(挂牌),取叶片上半部(5 g左右),按CTAB法[28]提取水稻全基因组DNA。
1.4.2 SSR标记检测 按Temnykh等[29]方法进行SSR检测。将模板DNA浓度调整到25 ng/μL,扩增反应体系为10 μL,含Taq酶0.2 μL(5 U/μL),Primer 1 0.5 μL,Primer 2 0.5 μL,10×PCR Buffer(含MgCl2) 1.5 μL,dNTPs 0.4 μL,DNA 2.0 μL,ddH2O 4.9 μL。PCR扩增程序为:94℃预变性5 min,94℃变性30 s,55℃退火40 s,72℃延伸45 s,35个循环后再72℃延伸5 min。扩增产物采用8%聚丙烯酰胺凝胶电泳分离,银染检测。
1.5 连锁图谱构建与QTL分析
应用QTL IciMapping V3.2软件进行试验数据的统计并构建遗传连锁图谱进行QTL分析,共180个SSR标记,比较均匀分布于12个连锁群。用MapDraw V2.1软件绘图,按Kosambi函数计算遗传距离,构建的连锁图谱总共覆盖水稻基因组约1820.6 cM,标记间平均距离为15.67 cM。参照王建康[30]的完备区间作图法(Inclusive Composite Interval Mapping, ICIM),即ICIM-ADD,以P<0.005和LOD值>3.0为阈值来判断QTL的存在。QTL的命名原则遵循McCouch[31]方法。
2 结果与分析
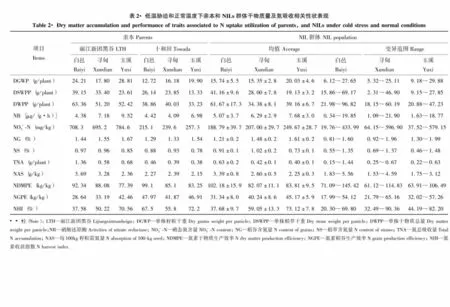
2.1 低温胁迫和正常温度下亲本和NILs群体干物质量及氮素吸收利用相关性状的表型分析
由表2可知,‘丽江新团黑谷’在单株籽粒干重、稻草干重、干物质总量、硝酸还原酶、硝态氮含量、稻谷和稻草含氮量、N总吸收量、每100 kg籽粒需氮量上为高值亲本;而‘十和田’在氮素干物质生产效率、氮素稻谷生产效率和氮素收获指数上均高于‘丽江新团黑谷’。BC4F8各性状的平均值基本介于双亲之间,而白邑、寻甸的单株籽粒干重、硝酸还原酶活性、硝态氮含量、稻谷含氮量、氮素稻谷生产效率和氮素收获指数低于玉溪,说明低温环境对干物质积累及氮吸收利用影响较大。从变异范围看,各性状均出现一定数量的超亲类型,而同一性状的极值则低温胁迫的变异度大于正常条件。正态分布检验表明,偏度除寻甸的硝酸还原酶活性、硝态氮含量以及玉溪的氮素收获指数,而峰度除寻甸的硝酸还原酶活性、硝态氮含量、每100 kg籽粒需氮量以及玉溪硝酸还原酶活性、稻谷氮含量、稻草氮含量和氮素收获指数绝对值略大于1外,其他性状偏度和峰度绝对值都小于1,说明多数性状呈类似正态的连续分布,适合QTL定位。
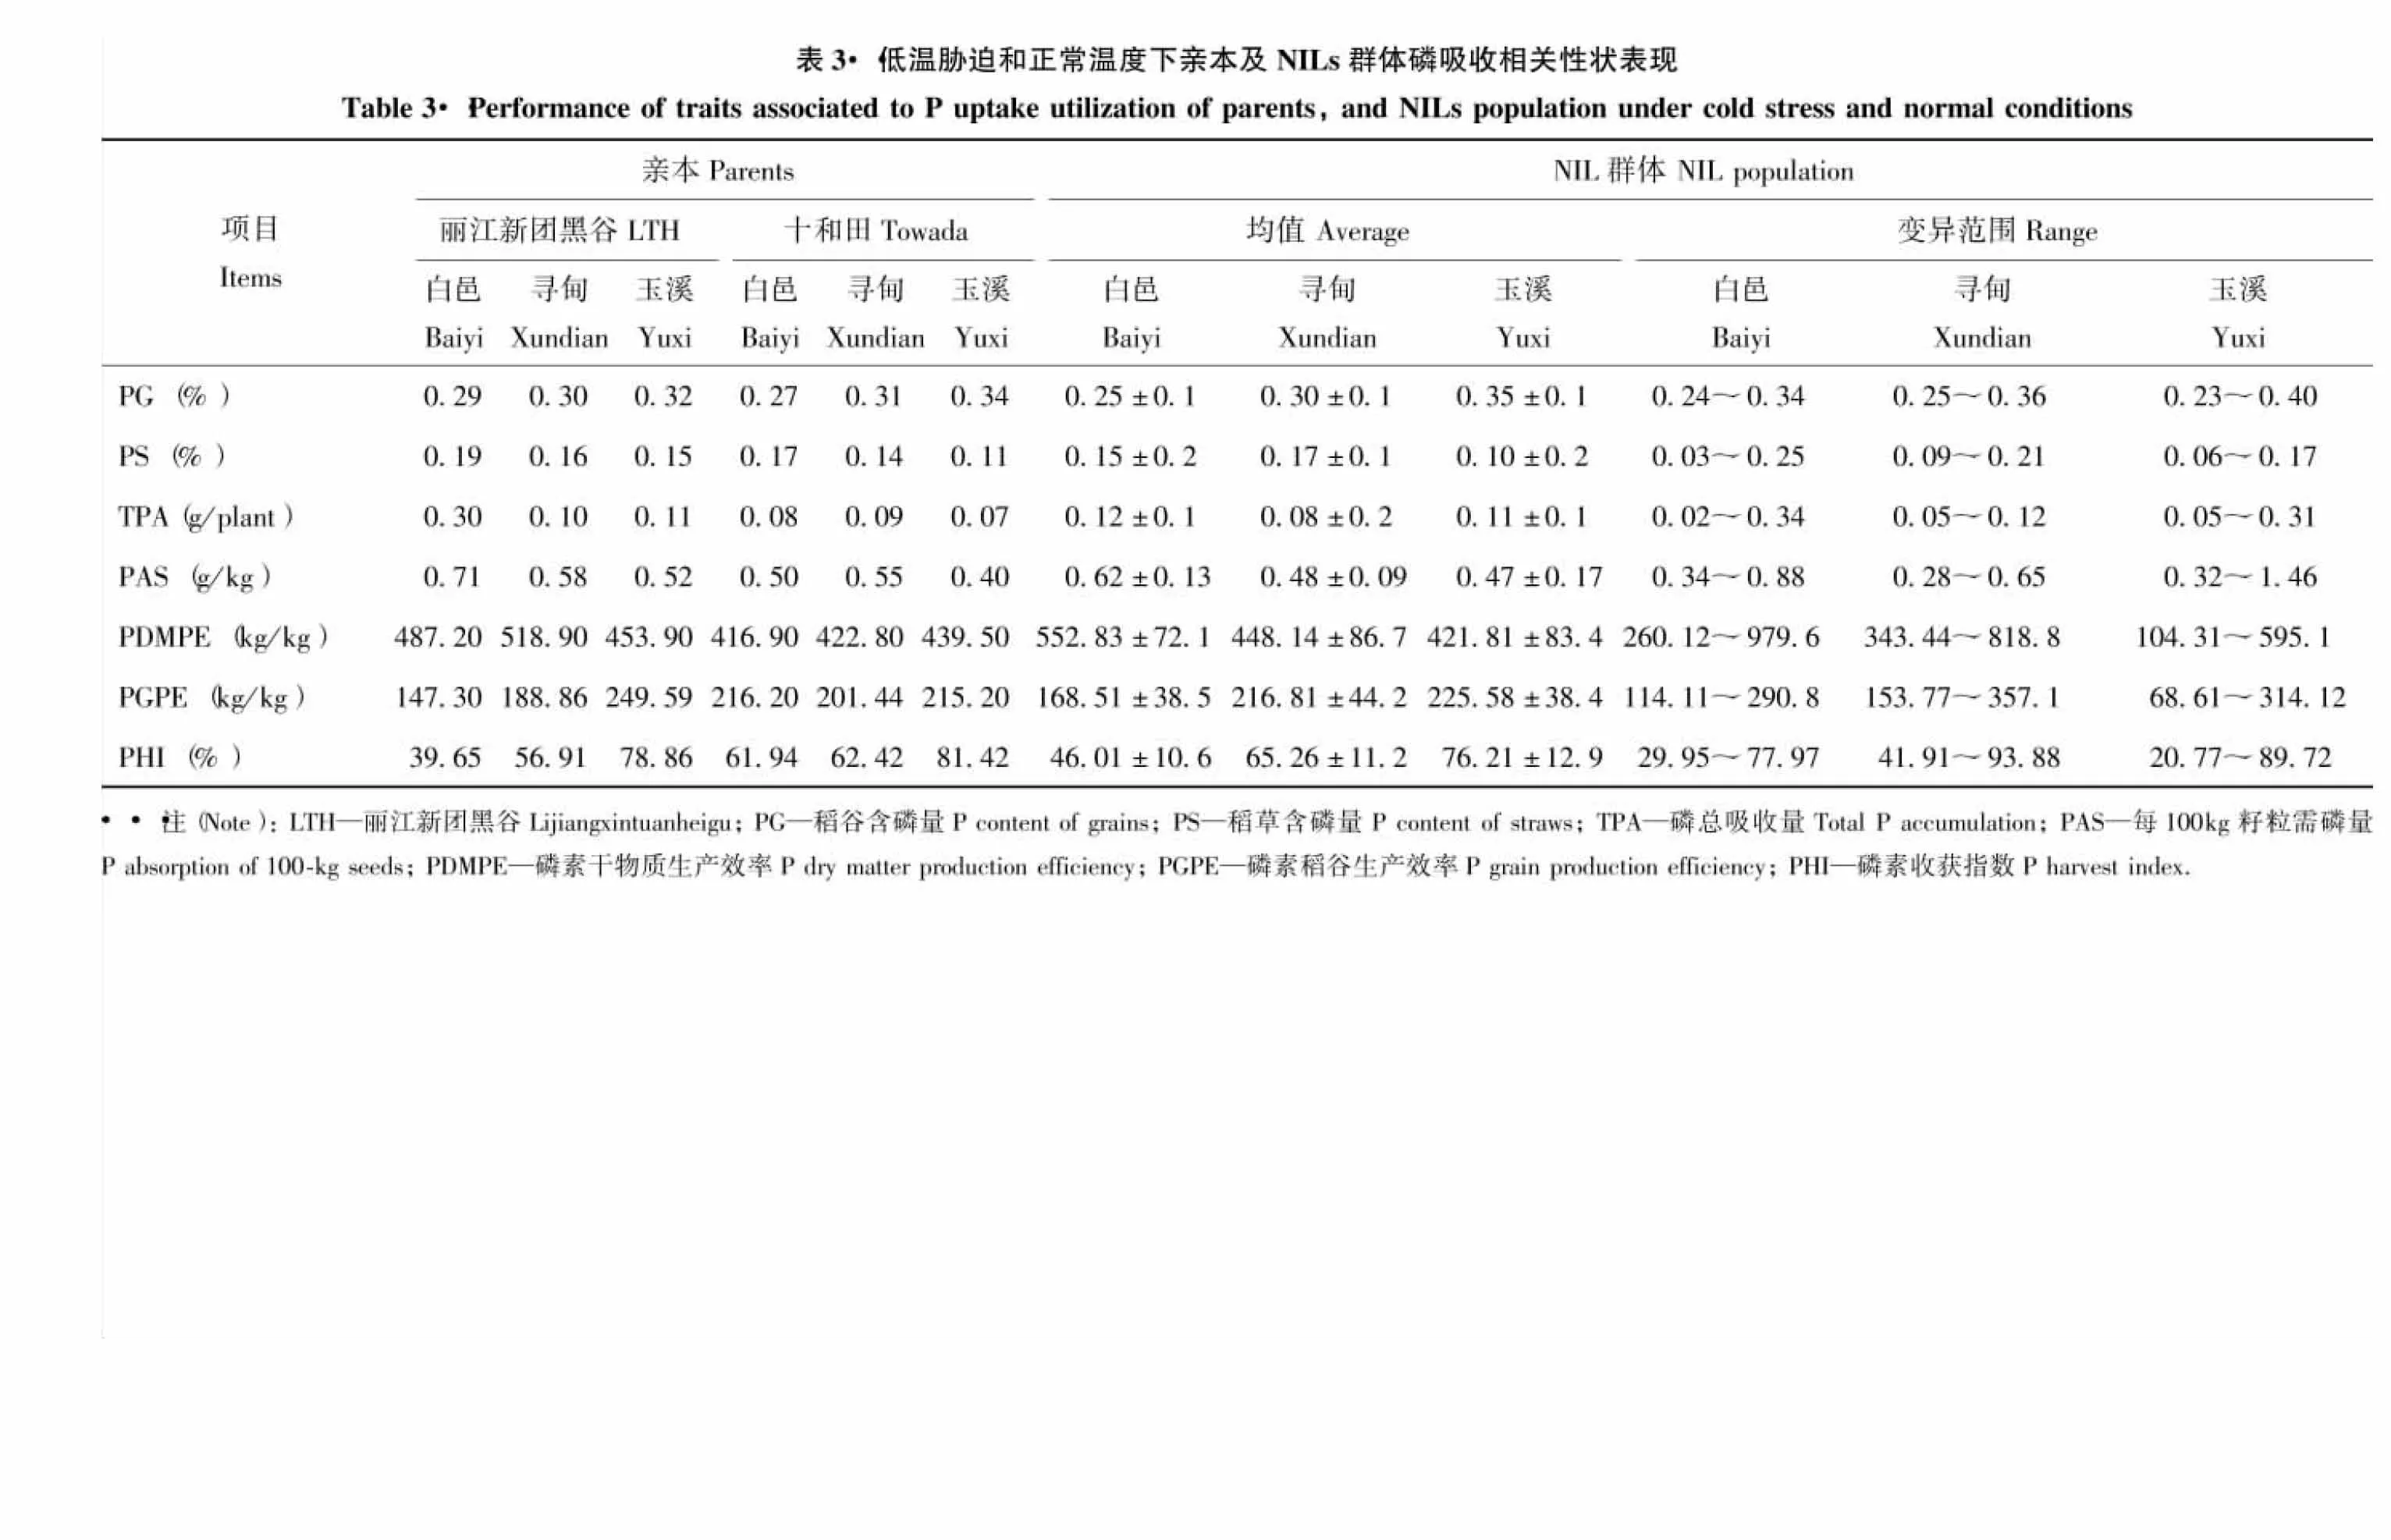
2.2 低温胁迫和正常温度下亲本及NILs群体的磷素吸收利用相关性状的表型分析
由表3可知,‘丽江新团黑谷’在稻草含磷量、磷总吸收量、每100 kg籽粒需磷量和磷素干物质生产效率上均明显高于‘十和田’。BC4F8绝大多数指标的均值介于双亲之间,两种低温环境下的稻谷含磷量、每100 kg籽粒需磷量、磷素稻谷生产效率和磷素收获指数均低于正常环境。从各性状分布范围看,同一性状的极值呈现低温胁迫变异更大的趋势。偏度和峰度分析表明,偏度除白邑的稻谷磷含量、磷总吸收量和玉溪的磷总吸收量、每100 kg籽粒需磷量、磷素干物质生产效率、磷素稻谷生产效率、磷素收获指数,而峰度除白邑的稻谷磷含量、磷总吸收量和寻甸的磷素干物质生产效率,以及玉溪的磷总吸收量、每100 kg籽粒需磷量、磷素干物质生产效率、磷素稻谷生产效率、磷素收获指数绝对值略大于1外,其他性状偏度和峰度的绝对值都小于1,说明多数性状表型呈正态分布。
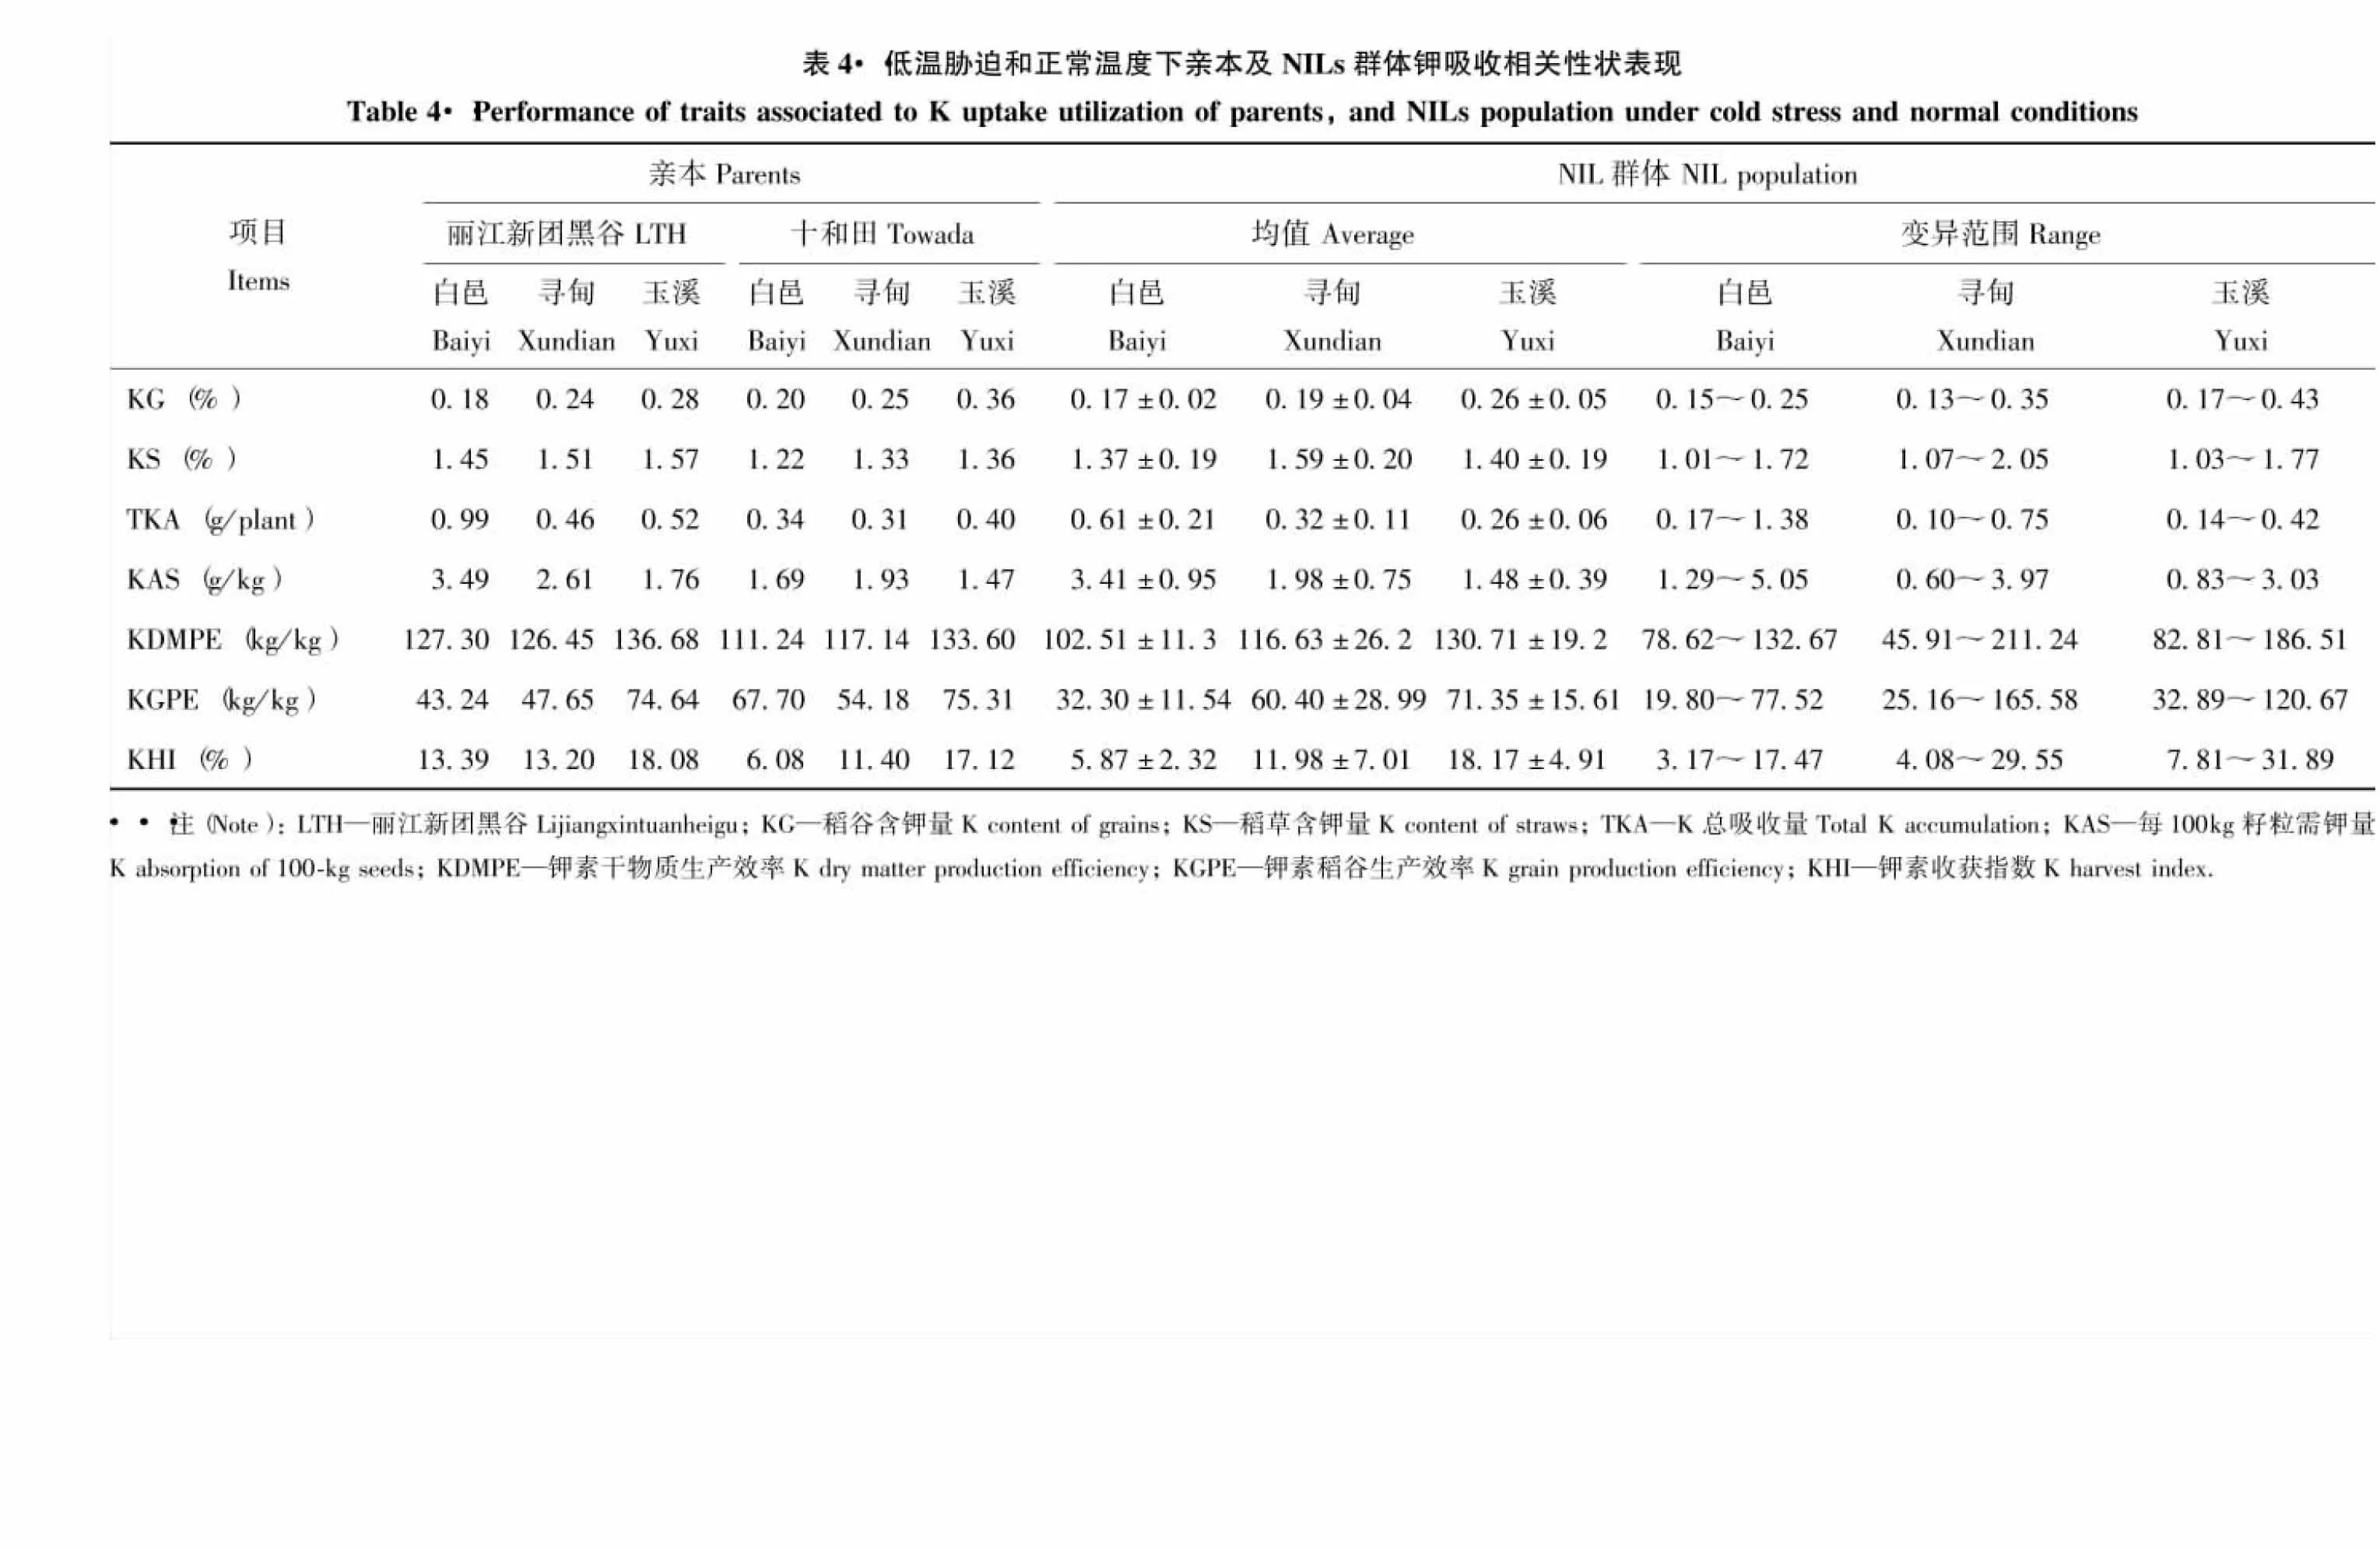
2.3 低温胁迫和正常温度下亲本及NILs群体的钾素吸收利用相关性状的表型分析
由表4可知,水稻吸收钾主要集中在稻草中。在两种冷害胁迫下,稻草钾含量、钾素干物质生产效率、钾素稻谷生产效率、钾素收获指数降低,其他指标则明显增加。双亲的7个性状差异明显,其中‘丽江新团黑谷’的稻草含钾量、钾总吸收量、每100 kg籽粒需钾量、钾素干物质生产效率和钾素收获指数均高于‘十和田’。从群体的表型均值看,绝大多数性状均值介于双亲之间。从各性状变异范围看,同一性状的极值在不同环境中差异较大,但均呈连续变异,并存在明显的双向超亲分离。偏度除白邑稻谷钾含量、钾素稻谷生产效率、钾素收获指数,寻甸钾素稻谷生产效率及玉溪每100 kg籽粒需钾量,而峰度除白邑和寻甸的稻谷钾含量、钾总吸收量、钾素稻谷生产效率,以及玉溪每100 kg籽粒需钾量绝对值略大于1外,其他性状偏度和峰度的绝对值都小于1,说明多数性状表型呈正态分布。
2.4 氮、磷和钾吸收利用相关性状的QTL定位分析

2.4.1 叶片硝态氮 在白邑、玉溪各检测到1个QTL,分布在第1、6染色体上,LOD值为3.55和4.11,加性效应为-53.05和97.02,增效基因分别来自十和田和丽江新团黑谷,贡献率为35.19%、 27.07%。



2.4.5 氮素收获指数 在玉溪、寻甸各检测到1个QTL,分别位于第1、6染色体的RM3652-RM6324和RM541-RM7555区间,LOD值分别为3.51、3.09,加性效应为-3.02、-8.54,贡献率分别为14.47%和31.85%,增效基因均来自十和田。
2.4.6 稻谷磷含量 仅在白邑点检测到1个QTL,位于第1染色体RM3252-RM7180区间,LOD值为4.15,贡献率为27.89%,加性效应为0.03,增效基因来自丽江新团黑谷。


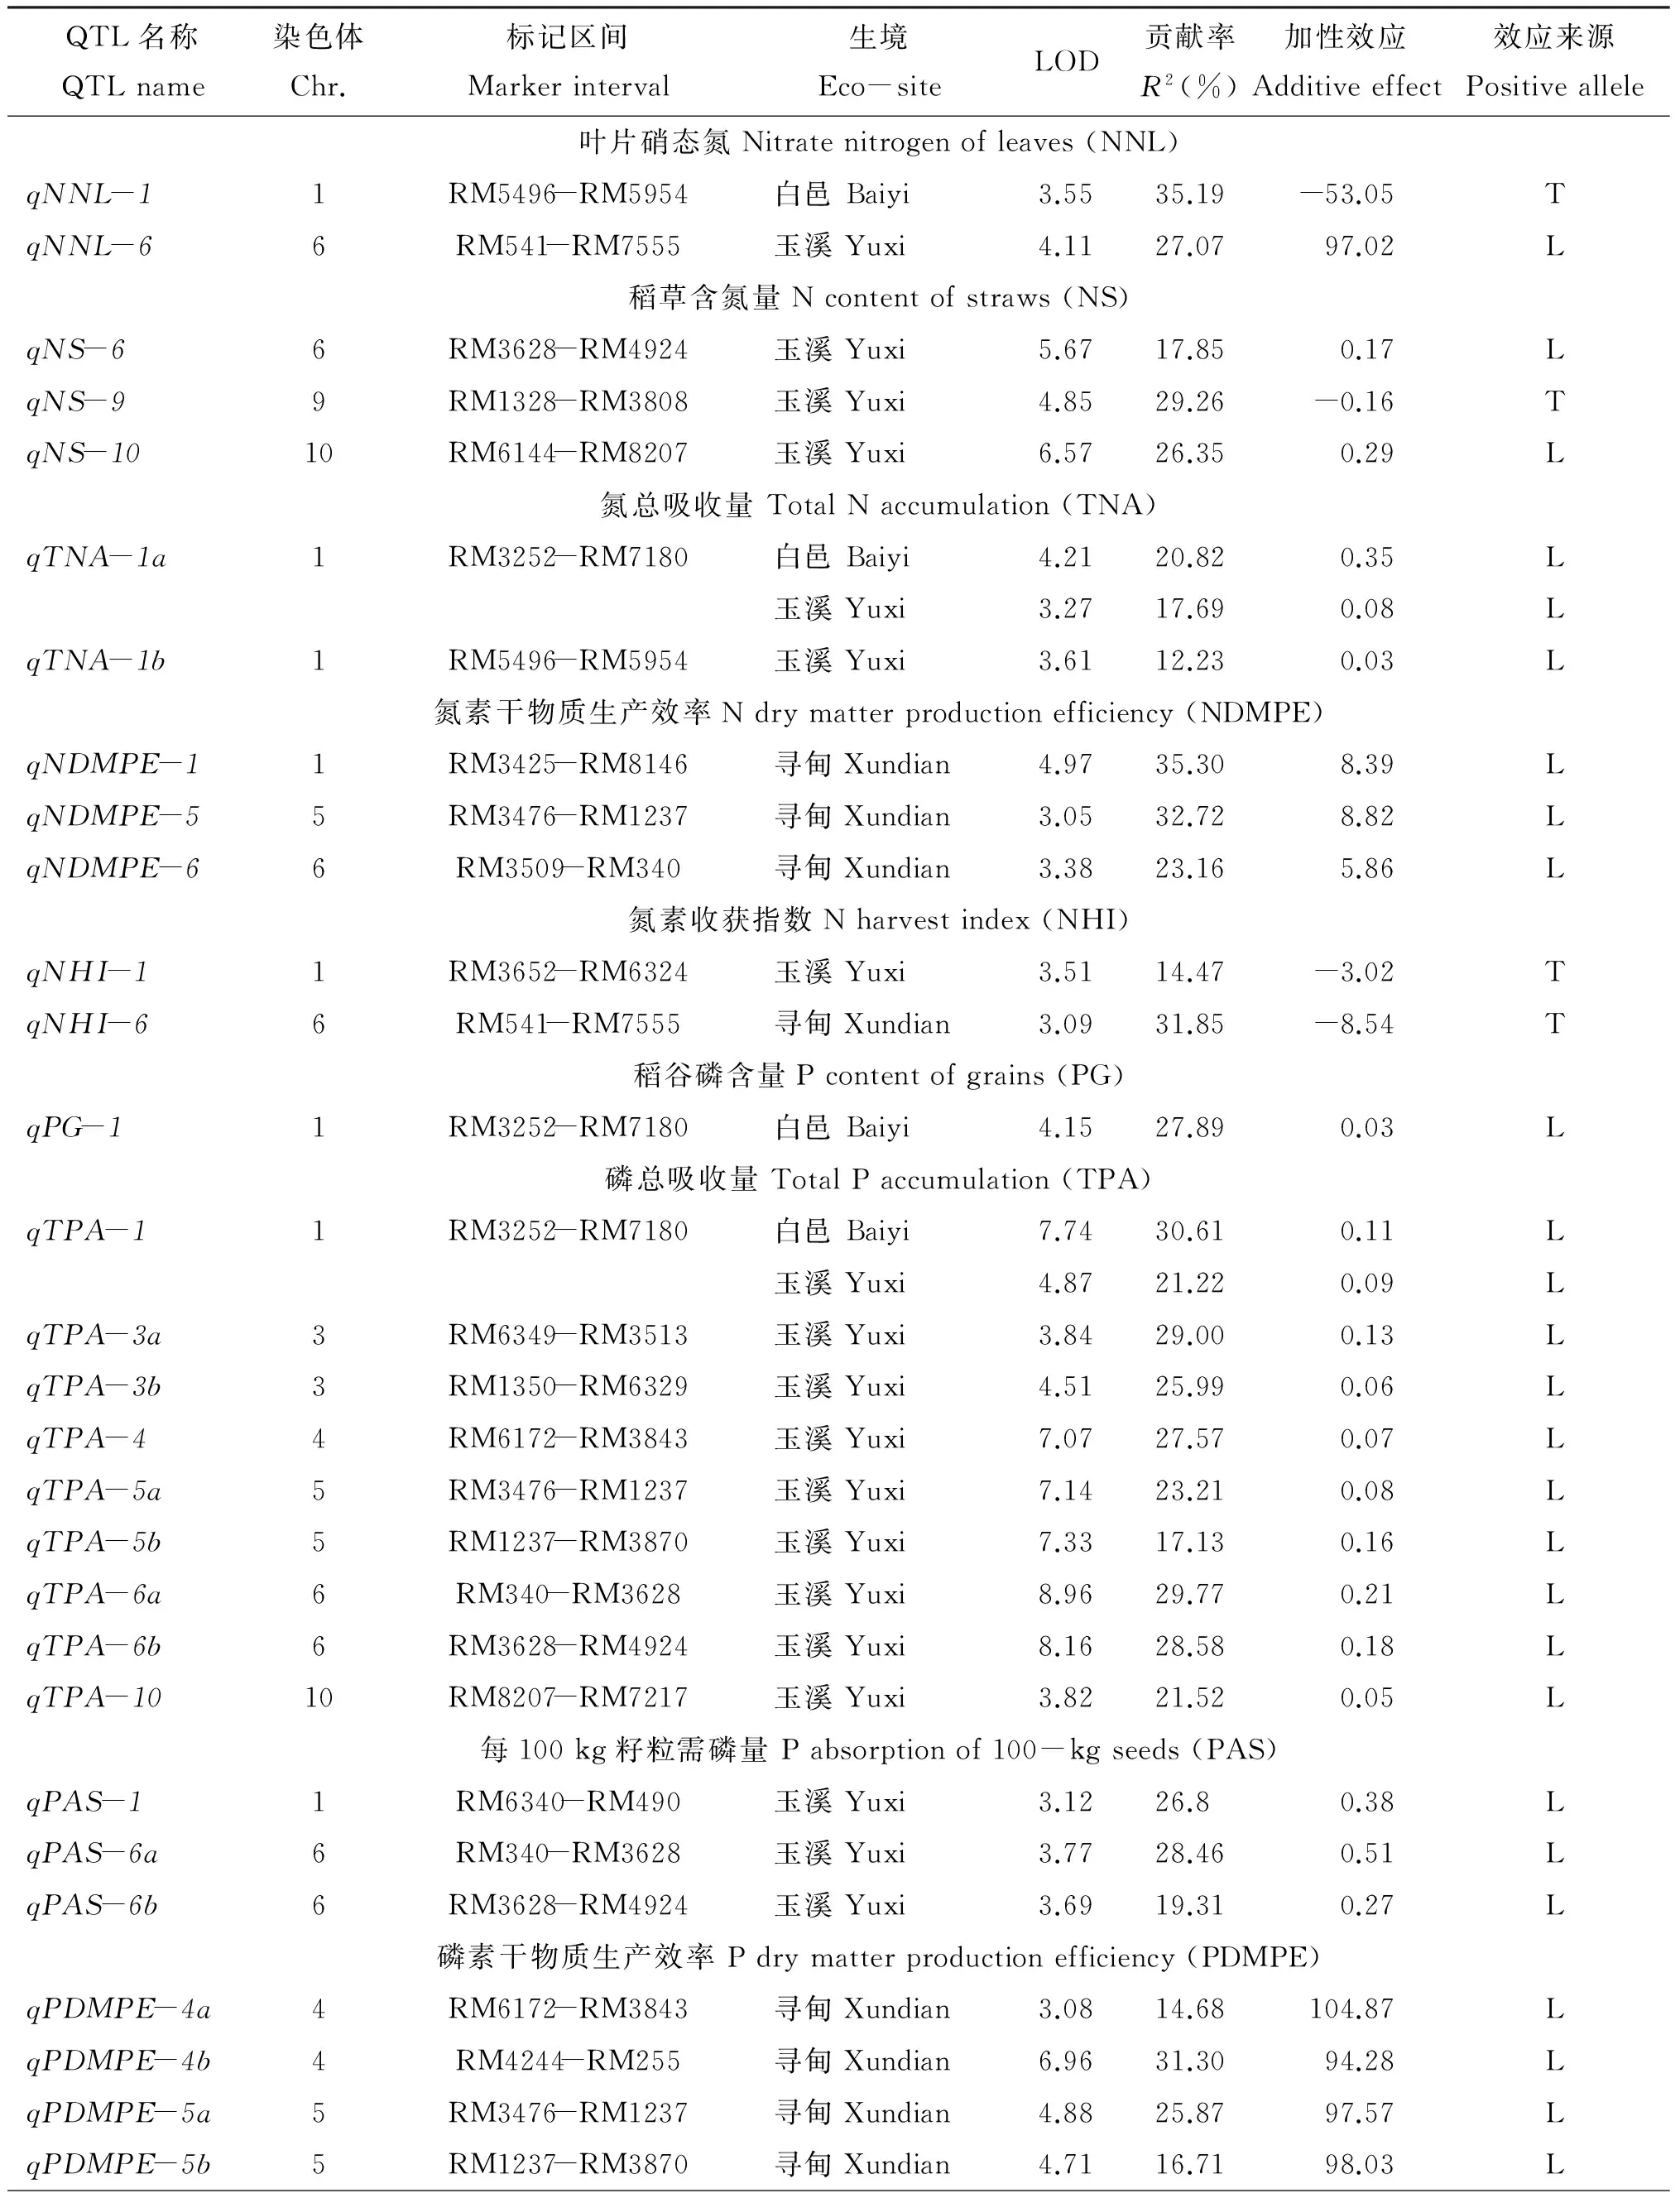
表5 低温胁迫和正常生长环境下检测到的氮、磷和钾吸收利用相关性状的主效QTLTable 5 Summary of QTLs for traits associated to N, P and K uptake utilization of NILs population detected under cold stress and normal conditions
续表5 Table 5 Continued
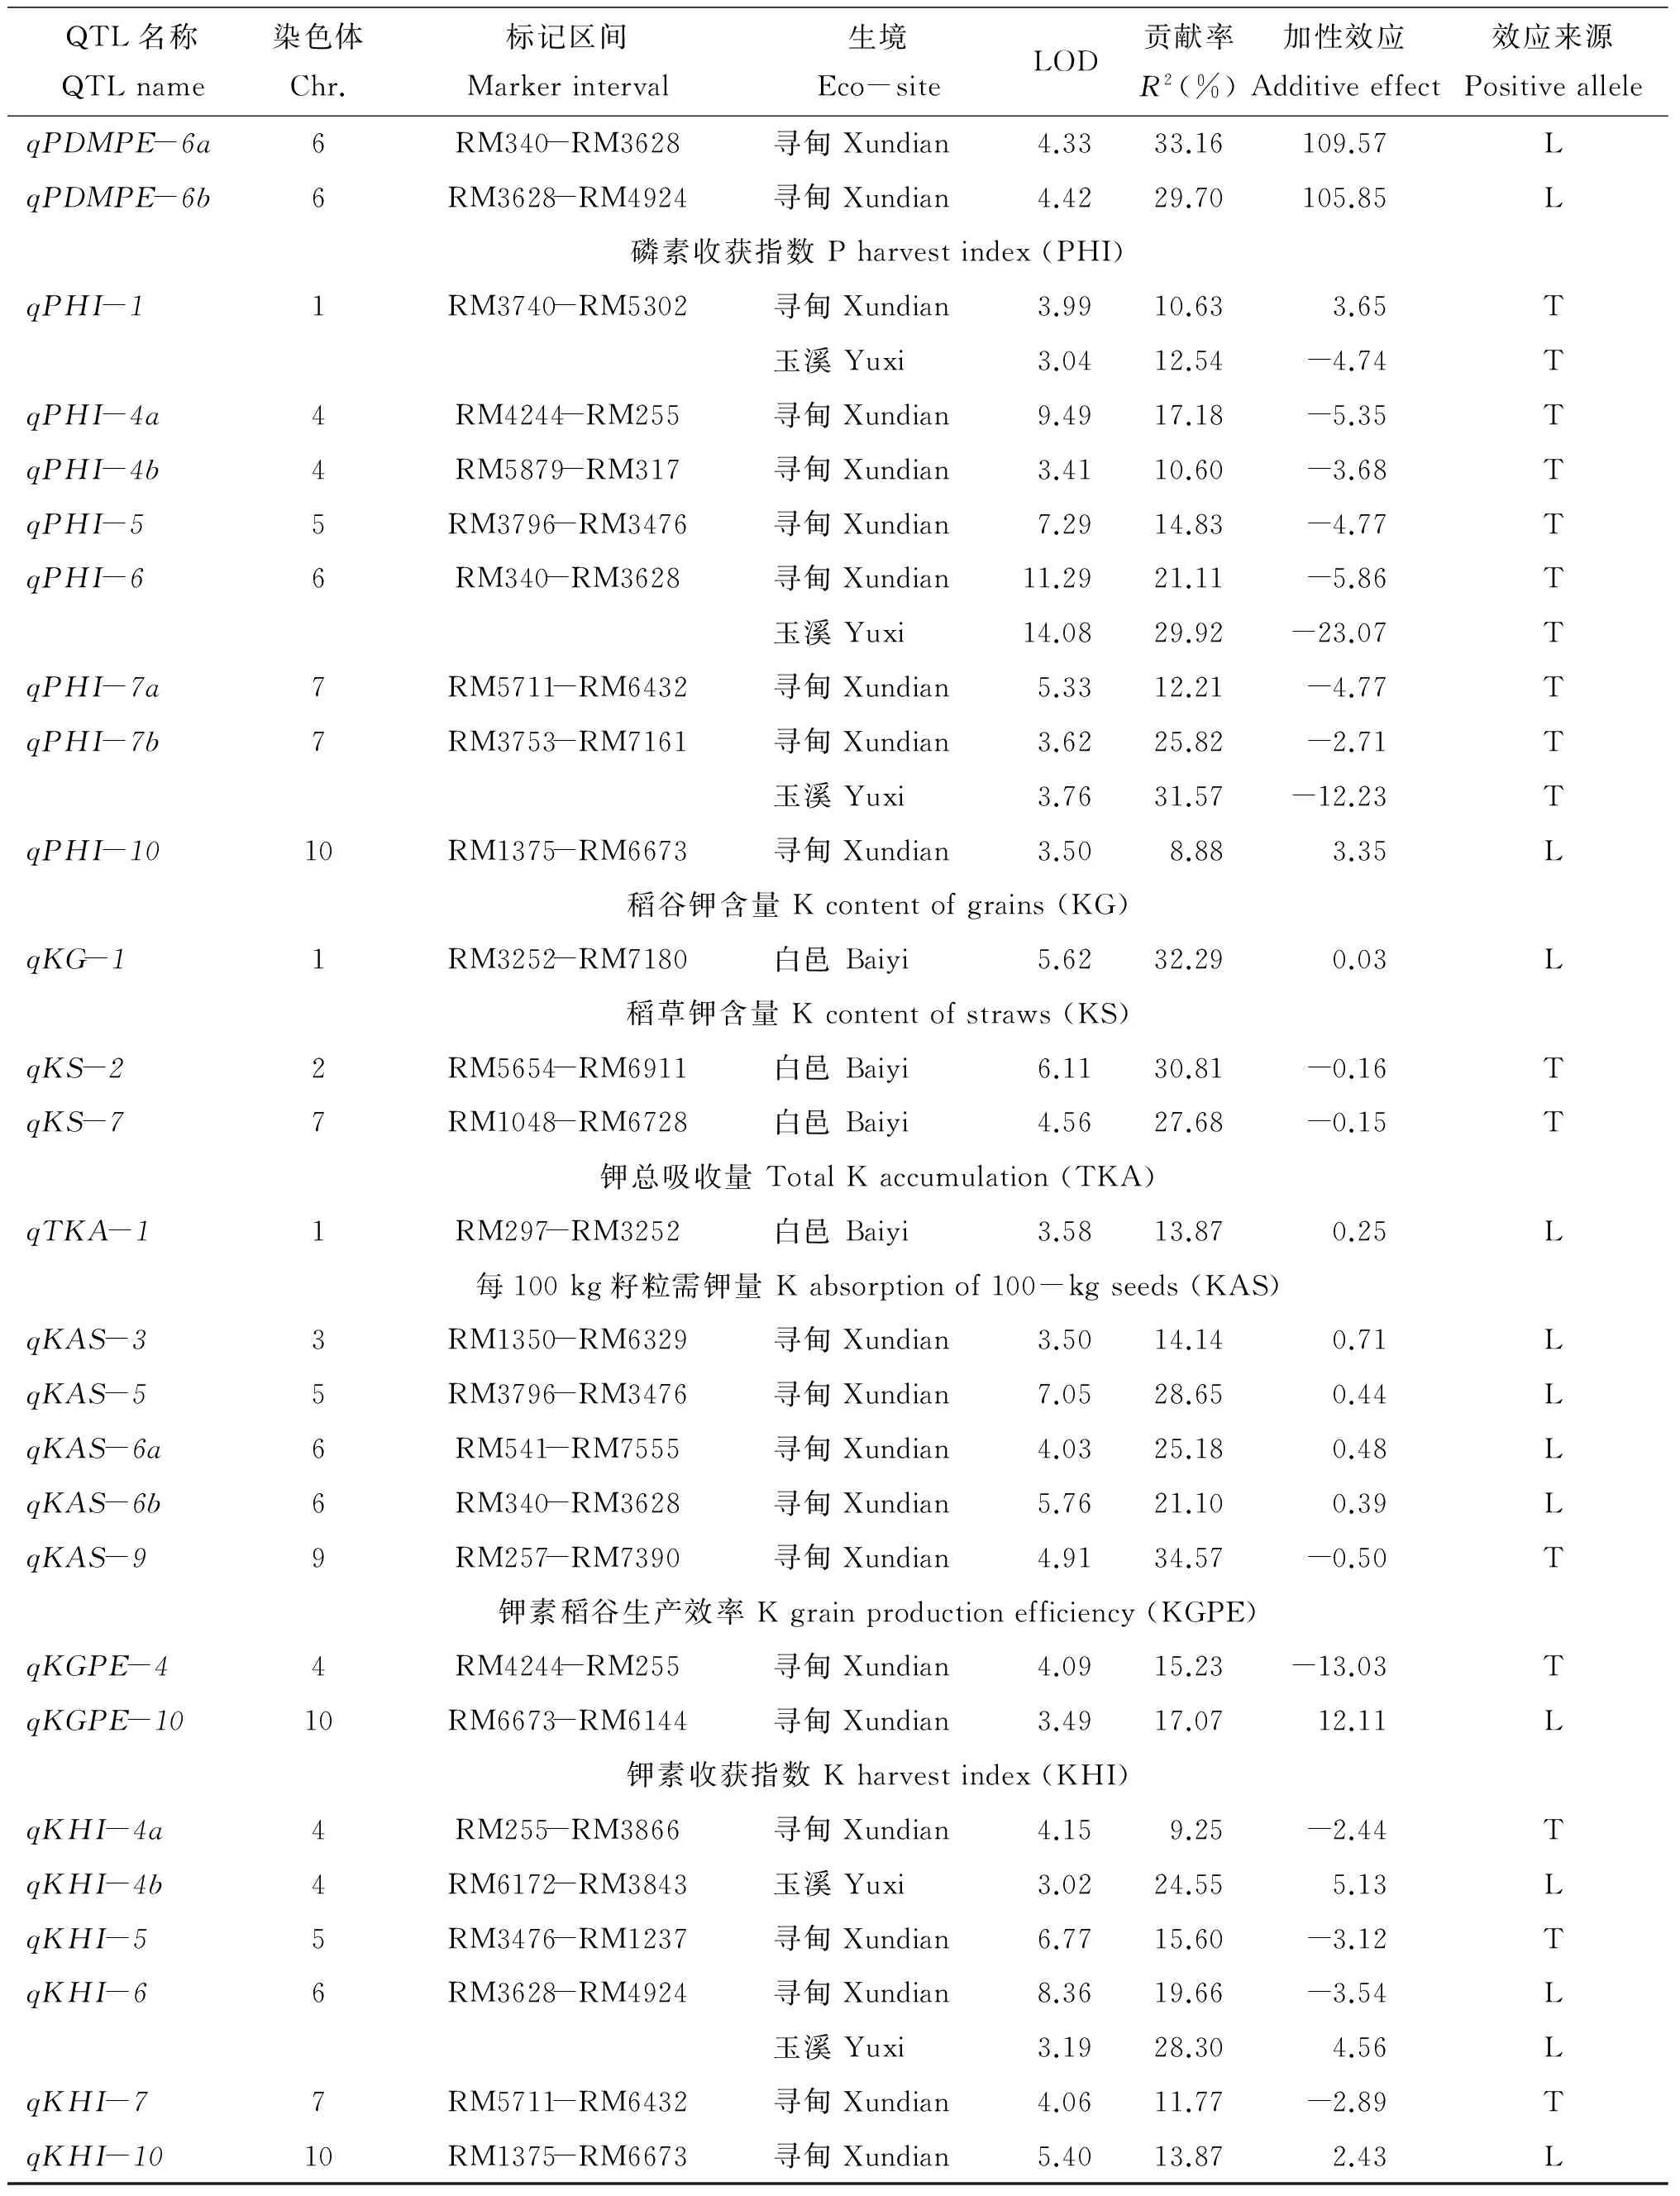
QTL名称QTLname染色体Chr.标记区间Markerinterval生境Eco-siteLOD贡献率R2(%)加性效应Additiveeffect效应来源PositivealleleqPDMPE-6a6RM340-RM3628寻甸Xundian4.3333.16109.57LqPDMPE-6b6RM3628-RM4924寻甸Xundian4.4229.70105.85L 磷素收获指数Pharvestindex(PHI)qPHI-11RM3740-RM5302寻甸Xundian3.9910.633.65T玉溪Yuxi3.0412.54-4.74TqPHI-4a4RM4244-RM255寻甸Xundian9.4917.18-5.35TqPHI-4b4RM5879-RM317寻甸Xundian3.4110.60-3.68TqPHI-55RM3796-RM3476寻甸Xundian7.2914.83-4.77TqPHI-66RM340-RM3628寻甸Xundian11.2921.11-5.86T玉溪Yuxi14.0829.92-23.07TqPHI-7a7RM5711-RM6432寻甸Xundian5.3312.21-4.77TqPHI-7b7RM3753-RM7161寻甸Xundian3.6225.82-2.71T玉溪Yuxi3.7631.57-12.23TqPHI-1010RM1375-RM6673寻甸Xundian3.508.883.35L 稻谷钾含量Kcontentofgrains(KG)qKG-11RM3252-RM7180白邑Baiyi5.6232.290.03L 稻草钾含量Kcontentofstraws(KS)qKS-22RM5654-RM6911白邑Baiyi6.1130.81-0.16TqKS-77RM1048-RM6728白邑Baiyi4.5627.68-0.15T 钾总吸收量TotalKaccumulation(TKA)qTKA-11RM297-RM3252白邑Baiyi3.5813.870.25L 每100kg籽粒需钾量Kabsorptionof100-kgseeds(KAS)qKAS-33RM1350-RM6329寻甸Xundian3.5014.140.71LqKAS-55RM3796-RM3476寻甸Xundian7.0528.650.44LqKAS-6a6RM541-RM7555寻甸Xundian4.0325.180.48LqKAS-6b6RM340-RM3628寻甸Xundian5.7621.100.39LqKAS-99RM257-RM7390寻甸Xundian4.9134.57-0.50T 钾素稻谷生产效率Kgrainproductionefficiency(KGPE)qKGPE-44RM4244-RM255寻甸Xundian4.0915.23-13.03TqKGPE-1010RM6673-RM6144寻甸Xundian3.4917.0712.11L 钾素收获指数Kharvestindex(KHI)qKHI-4a4RM255-RM3866寻甸Xundian4.159.25-2.44TqKHI-4b4RM6172-RM3843玉溪Yuxi3.0224.555.13LqKHI-55RM3476-RM1237寻甸Xundian6.7715.60-3.12TqKHI-66RM3628-RM4924寻甸Xundian8.3619.66-3.54L玉溪Yuxi3.1928.304.56LqKHI-77RM5711-RM6432寻甸Xundian4.0611.77-2.89TqKHI-1010RM1375-RM6673寻甸Xundian5.4013.872.43L
注(Note): L—增效基因来自丽江新团黑谷Efficiency gene expressed from Lijiangxintuanheigu; T—增效基因来自十和田Efficiency gene expressed from Towada.


2.4.11 稻谷钾含量 仅在白邑检测到1个QTL,位于第1染色体RM3252-RM7180区间的qKG-1,LOD值为5.62,贡献率为32.29%,加性效应为0.03,增效基因来自丽江新团黑谷。
2.4.12 稻草钾含量 仅白邑检测到2个QTL,位于第2、7染色体RM5654-RM6911和RM1048-RM6728区间,LOD值为6.11、4.56,贡献率分别为30.81%、27.68%,加性效应-0.16、-0.15。增效基因来自十和田。
2.4.13 钾素总吸收量 仅在白邑检测到1个QTL,qTKA-1位于第1染色体RM297-RM3252区间,LOD值为3.58,贡献率为13.87%,加性效应为0.25,增效基因来自丽江新团黑谷。

2.4.15 钾素稻谷生产效率 仅在寻甸检测到2个QTL,位于第4、10染色体,LOD值分别为4.09和3.49,贡献率为15.23%和17.07%,加性效应为-13.03、3.11。增效基因分别来自十和田和丽江新团黑谷。

3 讨论与结论
3.1 QTL定位

3.2 控制各性状的QTL比较
QTL检测显示,本研究有13个区间同时控制多个性状,第1和第4染色体上有2个区间,第5和第6染色体上有3个区间,第3、7和10染色体上各1个区间。其中qNNL-1和qTNA-1b位于第1染色体RM5496-RM5954区间;qTNA-1a、qPG-1、qTPA-1和qKG-1位于第1染色体RM3252-RM7180区间;qTPA-3b和qKAS-3位于第3染色体RM1350-RM6329区间;qTPA-4、qPDMPE-4a和qKHI-4b位于第4染色体RM6172-RM3843区间;qPDMPE-4b、qPHI-4a和qKGPE-4位于第4染色体RM4244-RM255区间;qNDMPE-5、qTPA-5a、qPDMPE-5a和qKHI-5位于第5染色体RM3476-RM1237区间;qTPA-5b和qPDMPE-5b位于第5染色体RM1237-RM3870区间;qPHI-5和qKAS-5位于第5染色体RM3796-RM3476区间;qNNL-6、qNHI-6和qKAS-6a位于第5染色体RM541-RM7555区间;qNS-6、qTPA-6b、qPAS-6b、qPDMPE-6b和qKHI-6位于第6染色体RM3628-RM4924区间;qTPA-6a、qPAS-6a、qPDMPE-6a、qPHI-6和qKAS-6b位于第6染色体RM340-RM3628区间;qPHI-7a和qKHI-7位于第7染色体RM5711-RM6432区间;qPHI-10和qKHI-10位于第10染色体RM1375-RM6673区间。上述QTL富集区域,可能为部分区域重叠,或者为“一因多效”或“紧密连锁”,初定位很难确定。但这种QTL成族现象,说明控制同一性状的QTL可能不是随机分布,而是在染色体上存在着控制某一特定性状的QTL集中区域,同时证实N、P、K养分吸收存在复杂的交互作用。另外,本研究检测到第1、第5和第6染色体的RM3252-RM7180、RM3796-RM3476、RM3628-RM4924标记区域的QTL与利用同一群体检测孕穗期耐冷性QTL相同(未发表),且有4个位点位于前人定位的耐冷性QTL集中区域,即第3染色体RM1350-RM6329区间的qTPA-3b[36]、第4染色体RM255-RM3866区间的qKHI-4a[37]、第7染色体RM1048-RM6728区间的qKS-7[38]、第10染色体RM8207-RM7217区间的qTPA-10[39],表明控制水稻耐冷性与养分利用的QTL/基因间关系紧密。Zhang等[40]研究认为,丽江新团黑谷携有冷调节基因COR,本研究利用相同供体亲本的近等基因系,基因COR是否也具有养分吸收调节功能有待进一步研究。针对这13个重要的QTL富集区域将来可进行不同年份间重现性验证,并通过构建相应的分离群体,借助于生物信息学手段,进一步开展精细定位研究,以分解这些QTL族或探索它们间的多效性关系,最终实现控制耐冷、养分吸收的QTL聚合育种,提高水稻耐冷、肥高效利用新品种的改良和选育效率。
[1] Chakravarthi B K, Naravaneni R. SSR marker based DNA fingerprinting and diversity studying rice (OryzasativaL)[J]. African Journal of Biotechnology, 2006, 5(9): 684-688.
[2] Mori M, Onishi K, Tokizono Yetal. Detection of a novel quantitative trait locus for cold tolerance at the booting stage derived from a troppicaljaponicarice variety silewah[J]. Breeding Science, 2011, 61(1): 61-68.
[3] Theocharis A, Clement C, Barka E A. Physiological and molecular changes in plants grown at low temperatures[J]. Planta, 2012, 235(6): 1091-1105.
[4] Zia M S, Salim M, Aslam M, Gill and Rahmatullah M A.Effect of low temperature of irrigation water on rice growth and nutrient uptake[J]. Journal of Agronomy and Crop Science, 1992, 173 (1): 22-31.
[5] 林海建, 张志明, 张永中, 等.作物氮、磷、钾利用相关性状的QTL定位研究进展[J]. 植物营养与肥料学报, 2010, 16 (3): 732 -743. Lin H J, Zhang Z M, Zhang Y Zetal. Advancement of QTL analysis for traits associated to N, P and K utilization[J]. Plant Nutrition and Fertilizer Science, 2010, 16 (3): 732-743.
[6] Cho Y I, Jiang W Z, Chin J H. Identification of QTLs associated with physiological nitrogen use efficiency in rice[J]. Molecular Cells, 2007, 23(1): 72-79.
[7] 方萍, 陶勤南, 吴平. 水稻吸氮能力与氮素利用率的QTLs及其基因效应分析[J]. 植物营养与肥料学报, 2001, 7(2): 159-165. Fang P, Tao Q N, Wu P. QTLs underlying rice root to uptake NH4-N and NO3-N and rice N use efficiency at seedling stage[J]. Plant Nutrition and Fertilizer Science, 2001, 7(2): 159-165.
[8] Wei D, Cui K H, Ye G Yetal. QTL mapping for nitrogen-use efficiency and nitrogen-deficiency tolerance traits in rice[J]. Plant and Soil, 2012, 359(2): 281-295.
[9] Tong H H, Chen L, Li W Petal. Identification and characterization of quantitative trait loci for grain yield and its components under different nitrogen fertilization levels in rice (OryzasativaL.)[J]. Molecular Breeding, 2011, 28(4): 495-509.
[10] Feng Y, Cao L Y, Wu W Metal. Mapping QTLs for nitrogen-deficiency tolerance at seedling stage in rice (OryzasativaL.)[J]. Plant Breeding, 2010, 129(6): 652-656.
[11] Obara M, Kajiura M, Fukuka Yetal. Mapping of QTLs associated with cytosolic glutamine synthetase and NADH-glutamate synthase in rice (OryzasativaL.)[J]. Journal of Experimental Botany, 2001, 52(359): 1209-1217.
[12] Bi Y M, Kant S, Clarke Jetal. Increased nitrogen-use efficiency in transgenic rice plants over-expressing a nitrogen-responsive early nodulin gene identified from rice expression profiling[J]. Plant Cell and Environment, 2009, 32(12): 1749-1760.
[13] Kurai T, Wakayama M, Abiko Tetal. Introduction of the ZmDof1 gene into rice enhances carbon and nitrogen assimilation under low-nitrogen conditions[J]. Plant Biotechnology Journal, 2011, 9(8): 826-837.
[14] Xu Y F, Wang R F, Tong Y Petal. Mapping QTLs for yield and nitrogen related traits in wheat: influence of nitrogen and phosphorus fertilization on QTL expression[J]. Theoretical and Applied Genetics, 2014, 127(1): 59-72.
[15] 穆平, 黄超, 李君霞, 等. 低磷胁迫下水稻产量性状变化及其QTL定位[J]. 作物学报, 2008, 34(7): 1137-1142. Mu P, Huang C, Li J Xetal. Yield trait variation and QTL mapping in a DH population of rice under phosphorus deficiency[J]. Acta Agronomica Sinica, 2008, 34(7): 1137-1142.
[16] Ming F, Zheng X W, Mi G Hetal. Identification of quantitative trait loci affecting tolerance to low phosphorus in rice(OryzasativaL.)[J]. Chinese Science Bulletin, 2000, 45(6): 520-525.
[17] Hu B, Wu P, Liao C Yetal. QTLs and epistasis underlying activity of acid phosphatase under phosphorus sufficient and deficient condition in rice(OryzasativaL.)[J]. Plant and Soil, 2001, 230(1): 99-105.
[18] Yohei K, Juan P T, Terry Retal. QTLs for phosphorus deficiency tolerance detected in upland NERICA varieties[J]. Plant Breeding, 2013, 132(3): 259-265.
[19] Ni J J, Wu P, Senadhira D, Huang N. Mapping QTLs for phosphorus deficiency tolerance in rice (OryzasativaL.)[J]. Theoretical Applied Genetics, 1998, 97(8): 1361-1369.
[20] Koyama M L, Levesley A, Koebner R Metal. Quantitative trait loci for component physiological traits determining salt tolerance in rice[J]. Plant Physiology, 2001, 125(1): 406-422.
[21] Lin H X, Zhu M Z, Yano Metal. QTLs for Na+and K+uptake of the shoots and roots controlling rice salt tolerance[J]. Theoretical and Applied Genetics, 2004, 108(2): 253-260.
[22] Shimizu A, Guerta C Q, Gregorio G Betal. QTLs for nutritional contents of rice seedlings(OryzasativaL.) in solution cultures and its implication to tolerance to iron-toxicity[J]. Plant and Soil, 2005, 275(1): 57-66.
[23] 杨树明, 王荔, 曾亚文, 等. 粳稻丽江新团黑谷近等基因系孕穗期耐冷性指标性状的遗传分析[J]. 华北农学报, 2013, 28(1): 7-11. Yang S M, Wang L, Zeng Y Wetal.Genetic analysis on cold tolerance characteristics at booting stage in the near-isogenic lines from Japonica rice Lijiangxintuanheigu[J]. Acta Agriculturae Boreali Sinica, 2013, 28 (1): 7-11.
[24] 曾亚文, 叶昌荣,申时全.水稻穗期耐冷NILs研制和QTL分析[J]. 中国农业科学, 2000, 33(4): 109. Zeng Y W, Ye C R, Shen S Q. Chromosomal Location of gene and development of near-isogenic lines for cold tolerance in rice[J].Scientia Agricultura Sinica, 2000, 33(4): 109.
[25] 李合生. 植物生理生化实验原理与技术[M]. 北京: 高等教育出版社, 2000. 184-185. Li H S. Principles and techniques of plant physiological biochemical experiment[M]. Beijing: Higher Education Press, 2000. 184- 185.
[26] 鲍士旦. 土壤农化分析[M]. 北京: 北京农业大学出版社, 2000. 30-107. Bao S D. Soil agrochemistry analysis[M]. Beijing: Beijing Agricultural University Press, 2000. 30-107.
[27] Jiang L G, Dai T B, Jiang Detal. Characterizing physiological N-use efficiency as influenced by nitrogen management in three rice cultivars[J]. Field Crops Research, 2004, 88(2): 239-250.
[28] Murray M G,Thompson W F. Rapid isolation of high molecular weight plant DNA[J]. Nucleic Acids Research, 1980, 8(19): 4321-4325.
[29] Temnykh S, Park W D, Ayres Netal. Mapping and genome organization of microsatellite sequences in rice (OryzasativaL.)[J]. Theoretical and Applied Genetics, 2000, 100(5): 697-712.
[30] 王建康. 数量性状基因的完备区间作图方法[J]. 作物学报, 2009, 35 (2): 239-245. WANG J K. Inclusive composite interval mapping of quantitative trait genes[J]. Acta Agronomica Sinica, 2009, 35 (2): 239-245.
[31] Mccouch S R. Gene nomenclature system for rice[J]. Rice, 2008, 1(1): 72-84.
[32] Dong W, Ke H C, Jun F Petal. Genetic dissection of grain nitrogen use efficiency and grain yield and their relationship in rice[J]. Field Crops Research, 2011, 124(3): 340-346.
[33] Wan X Y, Wan J M, Weng J Fetal. Stability of QTLs for rice grain dimension and endosperm chalkiness characteristics across eight environments[J]. Theoretical and Applied Genetics, 2005, 110(7): 1334-1346.
[34] Wissuwa M, Yano M, Ae N. Mapping of QTLs for phosphorus deficiency tolerance in rice (OryzasativaL.)[J]. Theoretical and Applied Genetics, 1998, 97(6): 777-783.
[35] Wang C, Ying S, Huang Hetal. Involvement ofOsSPX1 in phosphate homeostasis in rice[J]. Plant Journal, 2009, 57(5): 895-904.
[36] Shirasawa S, Endo T, Nakagomi Ketal. Delimitation of a QTL region controlling cold tolerance at booting stage of a cultivar, ‘Lijiangxintuanheigu’, in rice,OryzasativaL[J]. Theoretical and Applied Genetics, 2012, 124(5): 937-946.
[37] Saito K, Hayano S Y, Kuroki M, Sato Y. Map-based cloning of the rice cold tolerance geneCtb1 [J]. Plant Science, 2010, 179(1): 97-102.
[38] Zhou L, Zeng Y W, Hu G Letal. Characterization and identification of cold tolerant near-isogenic lines in rice[J]. Breeding Science, 2012, 62(2): 196-201.
[39] Ye C, Fukai S, Godwin I Detal. A QTL controlling low temperature induced spikelet sterility at booting stage in rice[J]. Euphytica, 2010, 176(3): 291-301.
[40] Zhang T, Zhao X, Wang W Setal. Comparative transcriptome profiling of chilling stress responsiveness in two contrasting rice genotypes[J]. PloS One, 2012, 7(8): e43274.
Identification of QTL traits on N, P and K utilization in rice under different growth environments
YANG Shu-ming1,2, ZENG Ya-wen1,3*, WANG Li4*, DU Juan1, PU Xiao-ying1, YANG Tao1
(1BiotechnologyandGeneticResourcesInstitute,YunnanAcademyofAgriculturalSciences,Kunming650205,China;2KeyLaboratoryoftheSouthwesternCropGeneResourcesandGermplasmInnovation,MinistryofAgriculture,Kunming650223,China; 3AgriculturalBiotechnologyKeyLaboratoryofYunnanProvince,Kunming650223,China;4CollegeofAgronomyandBiotechnology,YunnanAgriculturalUniversity,Kunming650201,China)
【Objectives】To provide the basis for the breeding program of molecular assistant selection (MAS) and map-based cloning of high nutrition efficiency utilization, the traits of quantitative trait locus (QTLs) on nitrogen, phosphorus and potassium utilization in rice were identified. 【Methods】 A set of 105 near-isogenic lines, BC4F8population was developed by backcrossing between ‘Lijiangxintuanheigu’ (the stongly cold-tolerantjaponicalandrace, grant No.2) as a donor parent and ‘Towada’ (cold-sensitivejaponicacultivar) as a recurrent parent, and was used as materials, and were planted in Baiyi (cold water irrigation), Xundian (natural low temperature condition) and Yuxi (normal growing environment) in Yunnan, respectively. Sixteen traits associated with N, P, K utilization were evaluated under three different ecological environments. The phenotypic data of 105 NILs, genetic map containing 180 microsatellite markers with 1820.6 cM of the genome, and 15.67 cM average distance between the markers were used to analyze QTLs of N, P and K utilization in rice by the statistic software of QTL IciMapping V 3.2. 【Results】 The total 56 QTLs were detected under three different environment, and were confirmed to be distributed on chromosome 1, 2, 3, 4, 5, 6, 7, 9, and 10, respectively. The number of QTL for single trait was varied from 1 to 10, and the single QTL accounted for 8.88%-35.30% of the phenotypic variation. N, P and K utilization efficiency of No.12, 27, and 17 QTLs were respectively detected. Six QTLs,qTNA-1a,qTPA-1,qPHI-1,qPHI-6,qPHI-7b, andqKHI-6 were detected under cold stress and normal condition, and had high stability and explained 10.63%-31.57% of the phenotypic variation. Moreover, QTLs showed the cluster distribution in 13 QTL regions of chromosome 1, 3, 4, 5, 6, 7, and 10, and a single QTL controlled 2-5 traits, and most of these traits co-controlled total P accumulation, P dry matter production, P harvest index, K absorption of 100-kg seeds, and K harvest index. 【Conclusions】 In this study, 56 QTLs related to N, P and K utilization in rice were detected, and the QTLs with high contribution might be useful for rice breeding with high nutrition efficiency utilization for N, P and K by MAS. Additionally, 13 genomic regions of QTLs cluster distribution are important candidate regions for further study.
rice (OryzasativaL.); near-isogenic lines; nutrient uptake; quantitative trait locus; QTL pleiotropy
2014-07-03 接受日期: 2014-10-21 网络出版日期: 2015-05-20
云南省技术创新人才培养项目(2011CI059和2012HB050);云南省科技惠民计划项目(2014RA060)资助。
杨树明(1973—),男,云南武定人,博士,研究员,主要从事农作物种质资源高效基因挖掘、遗传育种研究。 Tel: 0871-65894145,E-mail: yangshuming126@126.com。* 通信作者 E-mail: zengyw1967@126.com; E-mail: 13759505639@163.com
S511.01
A
1008-505X(2015)04-0823-013
