Gamma generalized linear model to investigate the effects of climate variables on the area burned by forest fire in northeast China
2015-06-05FutaoGuoGuangyuWangJohnInnesXiangqingMaLongSunHaiqingHu
Futao Guo•Guangyu Wang•John L.Innes•Xiangqing Ma•Long Sun•Haiqing Hu
Gamma generalized linear model to investigate the effects of climate variables on the area burned by forest fire in northeast China
Futao Guo1•Guangyu Wang2•John L.Innes2•Xiangqing Ma1•Long Sun3•Haiqing Hu3
The purpose of this study was to determine a suitable model for investigating the effects of climate factors on the area burned by forestfire in the Tahe forest region,Daxing’an Mountains,in northeast China.The response variables were the area burned by lightningcaused fire,human-caused fire,and totalburned area.The predictor variables were nine climate variables collected from the local weather station.Three regression models were utilized,including multiple linear regression,loglinear model(log-transformation on both response and predictor variables),and gamma-generalized linear model. The goodness-of-fitofthe models were compared based on model fitting statistics such as R2,AIC,and RMSE.The results revealed that the gamma-generalized linear model was generally superior to both multiple linear regressionmodeland log-linear modelfor fitting the fire data.Further, the bestmodels were selected based on the criteria that the climate variables were statistically significantatα=0.05. The gamma best models indicated that maximum wind speed,precipitation,and days that rainfall greater than 0.1 mm had significant impacts on the area burned by the lightning-caused fire,while the mean temperature and minimum relative humidity were the main drivers of the burned area caused by human activities.Overall,the total burned area by forest fire was significantly influenced by days that rainfall greater than 0.1 mm and minimum relative humidity,indicating that the moisture condition of foreststands determine the burned area by forestfire.
Lightning-caused fire·Human-caused fire· Multiple linear regression·Log-linear model·Daxing’an mountains
Introduction
Fire is an importantdisturbance factorin forestecosystems. It has significant impacts on the balance of carbon and energy,regeneration,and forest succession(Johnstone et al.2010;Kasischke et al.2010).The area burned annually by forest fire causes enormous costs and losses, and strongly influences decision-making and land-use planning of the public agencies of natural resources management in China and in the World.On the other hand, climate changes and variables have been a well-known driver of forest fires under various spatial and temporal scales(Flannigan and van Wagner 1991;Johnson and Wowchuk 1993;Duff et al.2005).Thus,a number of studies regarding the area burned by forestfires and climate variables have been conducted in the past decades(e.g.,Flannigan and van Wagner1991;Skinner etal.2002;Duff et al.2005;Flannigan etal.2005;McCoy and Burn 2005).
To date,linear regression models are the most common approach for modeling the relationships between the area burned by forest fires and climate changes/variables(e.g., Balling et al.1992;Flannigan et al.2005;Tymstra et al. 2005).However,some researchers indicated thatthere were no significant linear relationships between the fire burned area and climate variables such as fuelmoisture,precipitation,and temperature.Instead,thresholdsoccurred when the burned area varied with time based on the changes of temperature and precipitation.The relationships between the burned area and temperature and precipitation contrasted with whatthey were when their thresholds were exceeded (Schoenberg etal.2003).Alternatively,researchers applied logarithmic transformation to fire data,namely log-linear models,in orderto dealwith the situationswhere non-linear relationships existed between the fire burned area and climate variables(e.g.,Littell et al.2009).However,a loglinear model has limited flexibility to linearize non-linear relationships between variables,because(1)itassumes that the frequency distribution ofthe response variable follows a log-normal distribution,and(2)the relationships between variables are either exponential(when applying log-transformation on the response variable only)or power(when applying log-transformation on both response and predictor variables).Itmay not be the best choice for modeling the highly skewed frequency distributions ofthe response variables like the area burned by forestfire.Thus,a more flexible regression modelis desirable to investigate the relationships between the area burned by forestfires and climate variables.
In recent years,generalized linear models(GLIM)have proved to be a better and more effective approach dealing with the frequency distributionsofresponse variablesthatare grossly departed from normal.GLIM is designed to model response variables that may follow a general distribution called the exponential family,which includes normal,lognormal,binomial,Poisson,beta,gamma,etc.(Myers et al. 2002).GLIMisviewed asa unification oflinearand nonlinear regression models and has three components:a response variable distribution,a linearpredictorthatinvolvesa number ofindependentorregressorvariables,and a link function that connects the linear predictor to the natural mean of the response variable.In the situations where the distributions of response variables are assumed to follow a beta or gamma distribution,a naturallog link function is commonly used to link the mean ofthe response variable to the linearpredictors. However,this log transformation of the response mean in GLIM is fundamentally different from a log transformation on the observed response variable in a log-linearmodel.This is because that log-transforming the mean of the response variable in GLIM does notalterthe error distribution ofthe model,whereas log-transforming the values of the response variable in log-linear models does(Myers et al.2002).The two methods oflog transformation can lead to quite different results.In general,log-transforming the response mean (GLIM)often allows the results to be more easily interpreted, especially in thatmean parameters remain on the same scale as the measured response variables.It is well known that gamma distribution is suitable to dealing with heteroskedasticity in non-negative,continuous data,in a way thata loglinear modelcannotdo withoutweighted leastsquares.
However,gamma modeling remained quite difficult to conduct until fairly recently when powerful statistical computing packages became available.The gamma distribution has been applied in many study fields;for example, it is commonly used in meteorology and climatology to represent variations in precipitation amount(Wilks 1990). Littelletal.(2009)analyzed the fire burned area ofwestern US using gamma-generalized linear regression model. Their results revealed that both goodness-of-fit and significance level of the parameters of gamma model were superior to those of multiple linear regressions.
The Tahe forest region is located in the boreal forest in northeastChina.This area has experienced high frequencies of forestfires,resulting in large burned areas annually.To date,some studies were conducted relating the burned area in Tahe to climate changes/variables,butallutilized linear regression models(e.g.,Qu and Hu 2007;Zhao etal.2009; Yang etal.2010;Wang etal.2013).Otherregression models such as GLIM have not been thoroughly compared and discussed for modeling the fire burned area in the region.
In this study,we applied three regression models to determine the relationships between climate variables and the burned area caused by lightning-caused fire,humancaused fire,and the combination of both.The lightingcaused fire is induced by lightning strikes.The previous study showed that the lightning-caused fire of Daxing’an Mountains mainly occurred in June and distributed in the elevation of 200–1300 m(Du et al.2010).The humancaused fire is thatthe fire ignitions are directly or indirectly related to human activities such as smoking,hunting, fireworks,escaped fire from locomotives and residents’homes.The three models used in this study were a multiple linear regression model,a log-linear regression model,and a gamma-generalized linear model.The model fitting was evaluated and compared using model statistics such as R2, AIC and parameter analysis.
Materials and methods
Study area
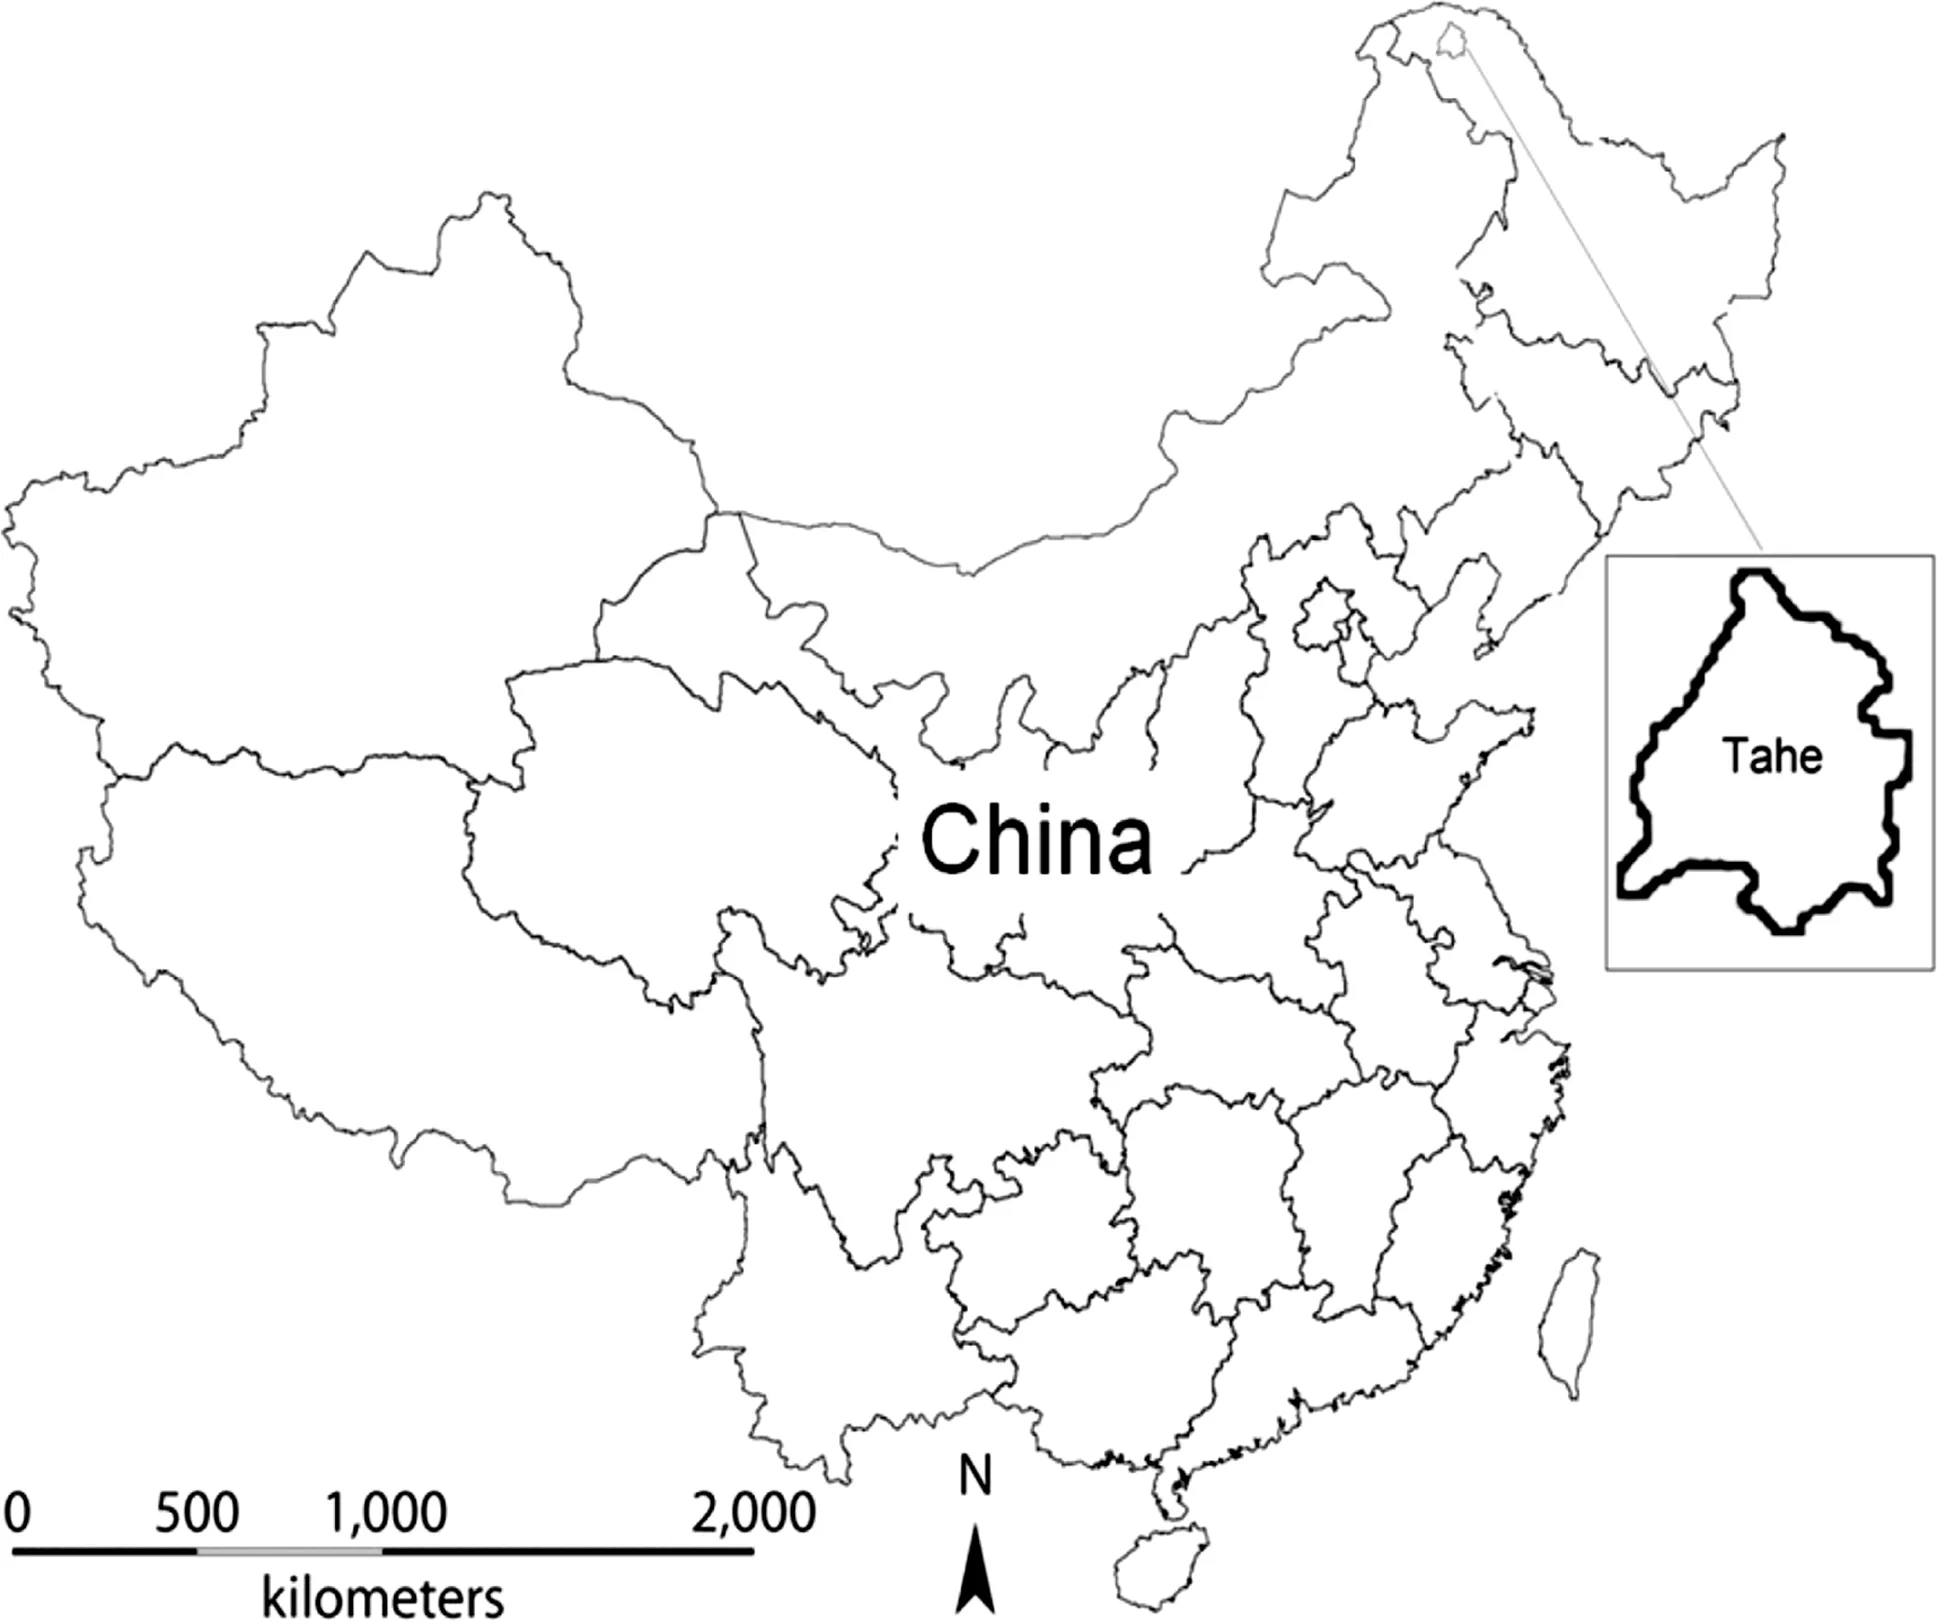
Fig.1 Map of the location of the study area,the Tahe forest region, in northeast China
The study area is the Tahe forestregion(52°09′–53°23′N, 125°19′–125°48′E)located in northeast China with a total forestarea of 920,000 ha(Fig.1).The area belongs to cold temperate continental monsoon climate.Winter is long, cold,and dry because of the cold air from Siberia and Mongolia.The annual sunshine is 2560 h,the annual precipitation is 428 mm,and the frost-free period is 100 days. The dominant tree species includes Dahurian larch(Larix gmelinii Rupr.),accompanied with white birch(Betula platyphylla Suk.)and Mongolian pine(Pinus sylvestris L. var.mongolica Litv.).The Tahe forest region has been suffering high fire disturbances.Thus,the fire prevention is one ofthe main responsibilities ofthe localbureau offorest management.
Data collection
The Fire Prevention Office of Tahe County(FPOT)is responsible for collecting and recording wildfire information,including fire location,burned area,forest type,causes,and the dates of forest fires.In this study,the annual fire burned area of the Tahe region from 1974 to 2009 was provided by FPOT,which included the area burned by lightning-caused fire(L-fire),the area burned by humancaused fire(H-fire),and the totalburned area ofboth causes (T-fire).We used these three variables as the response variables in this study.
The corresponding historical climate data of the study area during the period of 1974–2009 were obtained from the China Meteorological Data and Sharing Network (http://cdc.cma.gov.cn/).There is a nationalweatherstation located in the centerofthe Tahe forestregion(Station ID is 50246).The weatherdata have been recorded continuously and completely since 1952,except for some missing data that were caused by accidents such as equipment failures and natural disasters.In this study,we used the average meteorological data during the fire season from April to November.There were about twenty meteorological or climate variables recorded by the station,and we chose nine of them in this study,including average precipitation (PD),average wind speed(WD),average relative humidity (RH),average temperature(MTE),average maximum temperature(MAT),days that rainfall exceeded 0.1 mm (DA),annual hours of sunshine(SH),average maximum wind speed(MAW),and average minimum relative humidity(MIRH).The descriptive statistics of the three response variables and nine independent or predictor variables were provided in Table 1.
Regression models
We briefly describe the three regression models used in this study as follows:
(1)Multiple linear regression model Given a set of n observations on p independentor predictor variables (X1,X2,…,Xp),and a dependent or response variable Y,the relationship between Y and Xs can be regressed as follows:

where Y is a n×1 vector of the observed response variable,X is a n×(p+1)known matrix including a column of 1(for intercept)and p predictor variables,βis a p×1 vector of unknown model parameters(includingβ0,β1,…,βp)that are estimated from data,andεis a random error term with assumed distribution N(0,σ2I),where I denotes an identity matrix andσ2represents the common error variance.The ordinary least squares(OLS)estimate ofβis obtained by

where superscript T denotes the transpose of a matrix.The relationship represented by equation[1] is assumed to be universal or constant across the geographic area(Zhang and Gove 2005).Multiple linear regression models are the traditionalapproach to investigating the relationships between fire burned area and climate variables.
(2)Log-linear regression model An alternative approach to modeling relationships among variables is to take naturallogarithmic transformation on both response variable and predictor variables such that

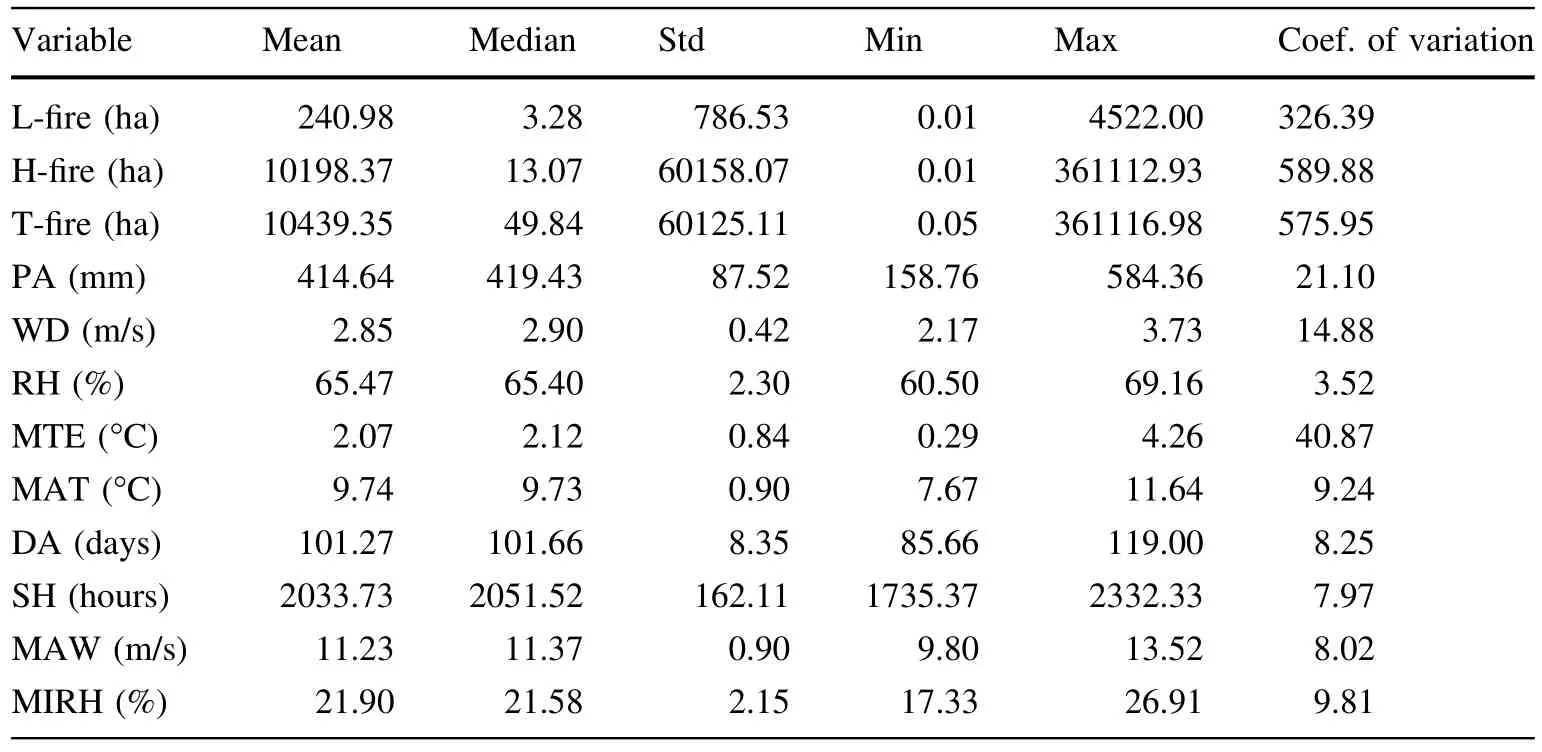
Table 1 Descriptive statistics of dependent and independent variables
where log is naturallogarithm.This log–log modelis called a log-linear model because the relationships between the log-transformed variablesare linear.Loglinear models are commonly used(1)to handle the situations where the relationships between variables are nonlinear,(2)to transform a skewed frequency distribution of the response variable into one that is more approximately normal(in fact,there is a distribution called log-normal distribution defined as a distribution whose logarithm is normally distributed–butwhose untransformed scale is skewed),and(3)to stabilize the heterogeneous variance in data.In this case,the interpretation ofmodelcoefficients is given as an expected percentage change in Y when X increases by some percentage.Such relationships, where both Y and X are log-transformed,are commonly referred to as elastic in econometrics,and the coefficientoflogX is referred to as an elasticity.
However,the three response variables(L-fire,H-fire and T-fire)had some zeros(e.g.,no area burned by forestfire in some years).In order to take logarithmic transformation we used 0.01 to replace 0 forthe three response variables.The effect of these changes on modeling was trivial.
(3)Gamma-generalized linear model The gamma distribution belongs to exponentialfamily and is one of the commonly used distributions in generalized linear models(GLIM).The probability density function of gamma distribution can be expressed as:

whereγandλare called shape and scale parameters, respectively.It can take on a wide range of shapes, and provides the link between the mean and the variance through its two parameters such that μ=E(Y)=γ·λandσ2=Var(Y)=γ·λ2.
One of the link functions for gamma-generalized linear model is natural log as follows:

The modelcoefficients of the gamma-generalized linear model can be estimated by the maximum likelihood method(McCullagh and Nelder 1989).It is known that using a log-link function with gamma-generalized linear models is different from fitting a log-linear model to logtransformed data because on the log scale the gamma is left skew to varying degrees,while the lognormalis symmetric. This makes the gamma-generalized linear modelusefulin a variety of situations(McCullagh and Nelder 1989;Myers et al.2002).
Model assessment
There are several issues that we had to consider in the modeling process:
(1)Multicollinearity among independent variables may result in inaccurate estimation of modelcoefficients because a high degree of multicollinearity can prevent the computation of the matrix inversion in Eq.(3),which is required for solving for the estimates of regression coefficients.In this study the variance inflation factor(VIF)was used as adiagnostic measure to detect the multicollinearity among the nine predictor s.Generally,VIF=10 is a threshold or red-flag on possible multicollinearity in a multiple linear regression model(Rawlings et al. 1998;Hanna 2002).
(2)Temporal autocorrelation may exist in our fire data because the response variables(the area burned by L-fire,H-fire and T-fire)and independent variables (climate variables)were collected over years(from 1974 to 2009).The temporal autocorrelation in model errors may result in underestimated standard errors for the model coefficients,consequently causing inaccurate hypothesis testing on the model coefficients.In this study the Durbin–Watson(DW) testwas performed on the residuals of the models to test on the temporal autocorrelation in model residuals(Rawlings etal.1998;Hanna 2002).
(3)If a log-linear model(Eq.(3))is used to fit the logtransformed fire data,the fitted log-model yields the prediction of log(Y).To obtain the desired prediction of Y,anti-log transformation is needed to convert log(Y)to Y,i.e.,^Y=exp log Y().Itis wellknown that this back-transformation process introduces bias into the estimation of Y.Consequently,a correction factor is typically applied to remove or reduce the bias (Baskerville 1972).However,Madgwick and Satoo (1975)finds that anti-log transformation tends to overestimate Yby applying the correctionsfactor,and suggests thatthe correction factor may be ignored if the bias from anti-log is relatively smallcompared to the overallvariation in the estimate of Y.
(4)Model fitting is commonly evaluated by model R2(Rawlings etal.1998;Hanna 2002).However,using R2to compare two models is meaningful and appropriate only if the response variables are the same for both models.In this study,the response variables were in differentscales:Y for the multiple linear regression model(Eq.(1))and logY for the log-linear model(Eq.(3)).Therefore,it was inappropriate to compare these two models using the model R2calculated by any statistical software.On the other hand,the model R2can be written as (Nakagawa and Schielzeth 2013):

where SST is the totalsum ofsquares ofthe response variable Y,SSE is the residual sum of squares,is the variance of the model residuals,is the variance of the observed Y,and Yi,andrepresent the observed,predicted,and the mean value of Y,respectively.We used the model R2of Eq.(6)as the assessment for model fitting to the data in this study.For the log-linear model (Eq.(3)),the predicted response variable,,was computed by taking the exponentialto the predicted logY by Eq.(3),i.e.,=exp (logY).
(5)Akaike Information Criterion(AIC).In recent years AIC isalso popularto measurethe goodness-of-fitofa regression modelby incorporating both the likelihood ofthe modeland apenalty forextra modelparameters. The following rule iscommonly accepted:the smaller AIC is,the betterthe modelfitsthe data.Again,using AIC to compare two models is meaningful and appropriate only if the response variables are the same for both models.To compare AIC for the MLP models againstthe log-linearmodels,the probability density function for the transformed data must be adjusted(Xiao et al.2011).The likelihood that the data are generated from a log-normaldistribution can be calculated based on the following formula:

Thus,the AIC of the log-linear model can be computed as:

where p is the number of model coefficients in the model.
Results
Our fire data showed thatthe area burned by three types of fire-causes had a dramatic variance,which was mainly due to the extreme fire events in the past.For example,the human-caused fires(H-fire)in 1987 resulted in nearly 360,000 hectares of burned area.Figure 2 demonstrates that the lightning-caused fire(L-fire)mostly resulted in small burned areas(1–10 ha)such that its frequency distribution is strongly skewed to the right,while the area burned by human activities(H-fire)was mainly distributed in 1–10 and 11–100 ha.On the other hand,the frequency distribution of the total burned area(T-fire)followed a normal distribution(Fig.2).

Fig.2 The frequency distribution of the area burned by different types of forestfire in the period of 1974–2009.The X-axis represents the different scales of burned area.The Y-axis represents the frequency of the burned area at a certain scale.L-Fire is lightningcaused fire,H-fire is human-caused fire,and T-Fire is totalamountof fires
Pearson correlations were computed between the area burned by three types of fire-causes and nine independent variables(climate variables).The results showed that only average maximum temperature was significantly correlated with the area burned by human-caused fire and the total burned area.The scatter plots were drawn to show the relationships between the area burned by three types of fire-causes and each climate variable(Figs.3,4,5),which revealed that there was no obvious linear relationships between three response variables and independent variables.
We attempted to model the area burned by forest fire using nine climate variables,and used the variance inflate factor(VIF)as the diagnostic measure for multicollinearity among the nine predictors(Rawlings et al.1998;Hanna 2002).The resulted showed that VIF of each climate variable in the models was less than 5,indicating there was basically no serious multicollinearity among them.
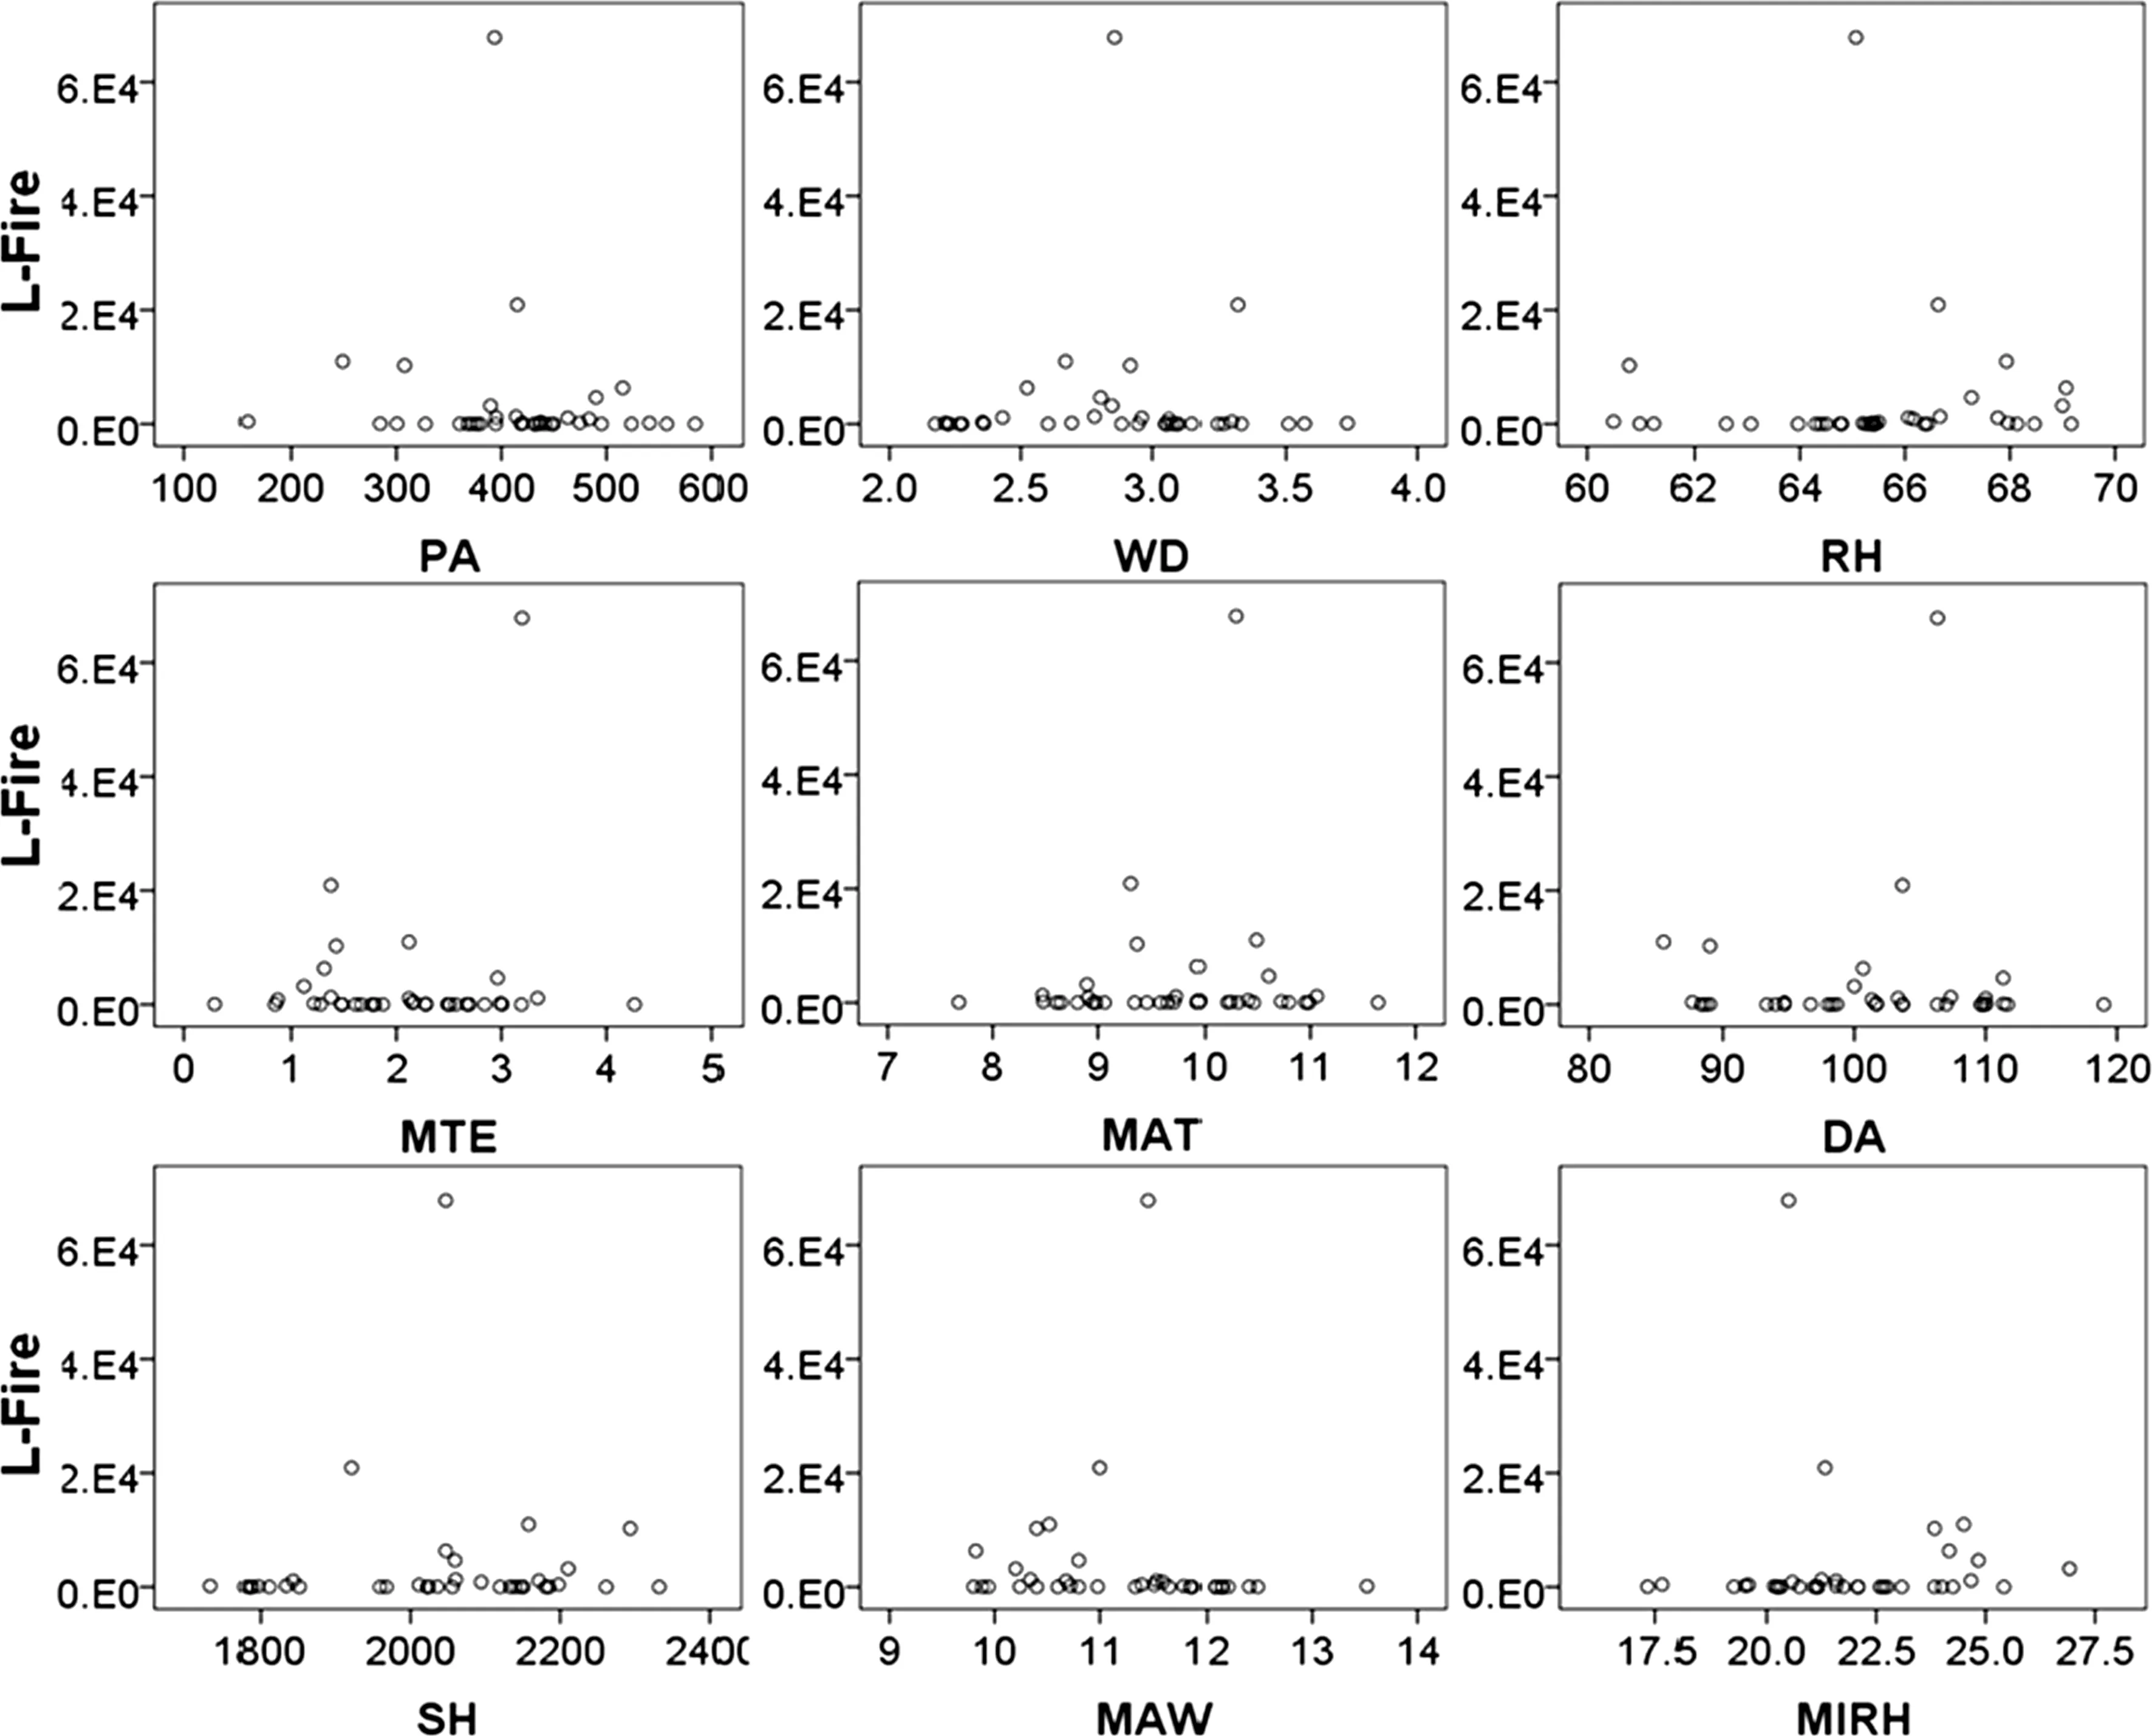
Fig.3 Scatter plots of the area burned by lightning-caused fire versus each climate variable.L-fire is lightning-caused fire.The abbreviation of the climate variables on the X-axis is the same as in Table 1
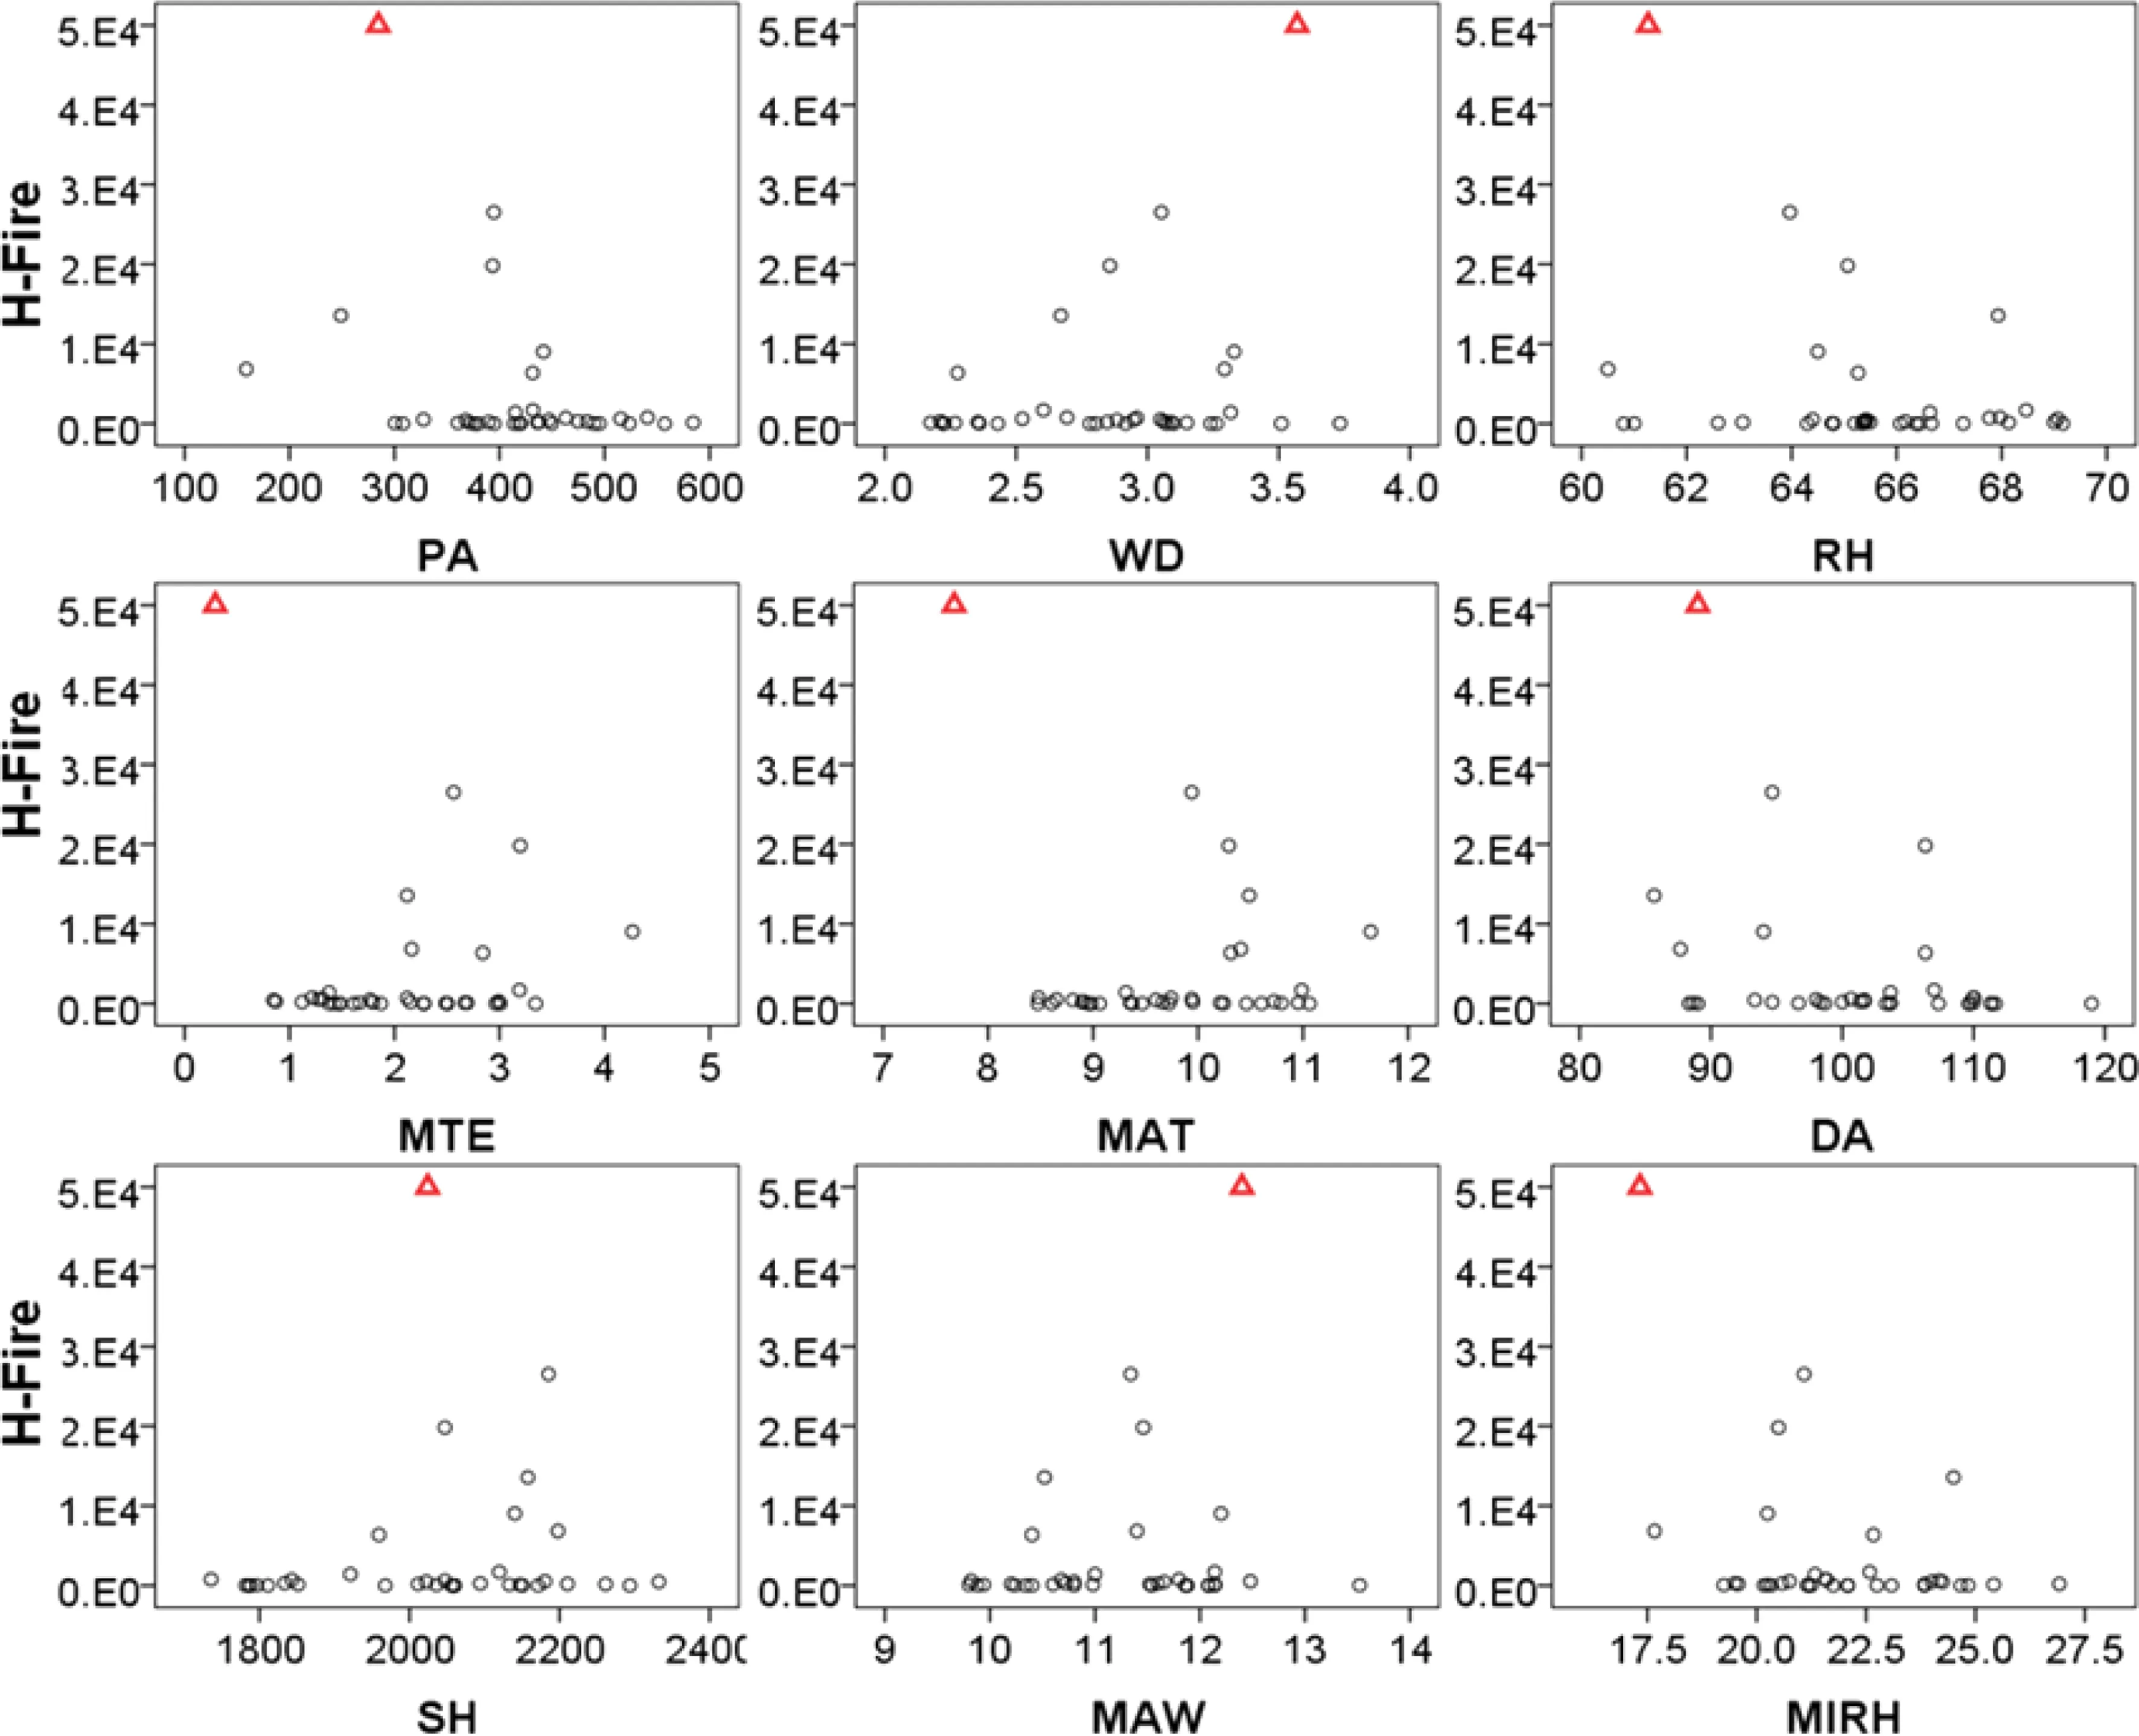
Fig.4 Scatter plots of the area burned by human-caused fire versus each climate variable.H-fire is human-caused fire.The abbreviation of the climate variables on the X-axis is the same as in Table 1. Because there was a huge inter-annual variation in the fire burned area,mainly due to an outlier of H-fire in 1987,we reduced the area burned by H-fire by 100 times,just for plotting purpose(i.e.,not did so in modeling processes).The outlier was represented by triangles
Given thatourfire data were collected from 1974 to 2009, we conducted the Durbin-Watson(DW)teston the temporal autocorrelations in the modelresiduals.The resultrevealed thatthe p-valuesofthe DWtestswere>0.2(definitely larger than the significance levelα=0.05)for allmodels of the three response variables.Thus,there was no temporalautocorrelation in the data.Although ourfire data were collected over 36 years,the area burned by forest fire seemed more random,rather than dependentfrom year to year.
We regressed the three response variables(L-fire,H-fire and T-fire)to the nine climate variables(i.e.,fullmodels)by each of the multiple linear regression model(Eq.(1)),loglinearmodel(Eq.(3)),and gamma generalized linearmodel (Eq.(5)).The modelfitting statistics,R2,AIC and RMSE,of the three models were listed in Table 2.The resultindicated that,among the three response variables,L-fire wasthe worst one fitting to the fire data.The R2of the three models was smaller than 0.1.The AICs of the gamma-generalized linear modelswere significantly smallerthan those ofMLR and loglinear models for allthree response variables,indicating that the gamma model fitted each fire data much better than the other two models when all nine predictor variables were included(fullmodel).On the otherhand,log-linearmodeldid notshow any obvious advantages compared to MLR in the three model fitting statistics(Table 2).In addition,most predictor variables were statistically insignificantatthe significance levelα=0.05 in both MLR and log-linearmodels.
Further,we selected the best models for each response variable by removing the non-significant predictor variables one by one atthe significance levelα=0.05.For L-fire there wasno bestmodelselected foreitherMLRorlog-linearmodels (i.e.,none of the predictor variables was statistically significant).Among the bestmodels the AICs ofthe gamma-generalized linearmodels were also significantly smallerthan those ofMLR and log-linearmodelsfor H-fire and T-fire(Table 2).
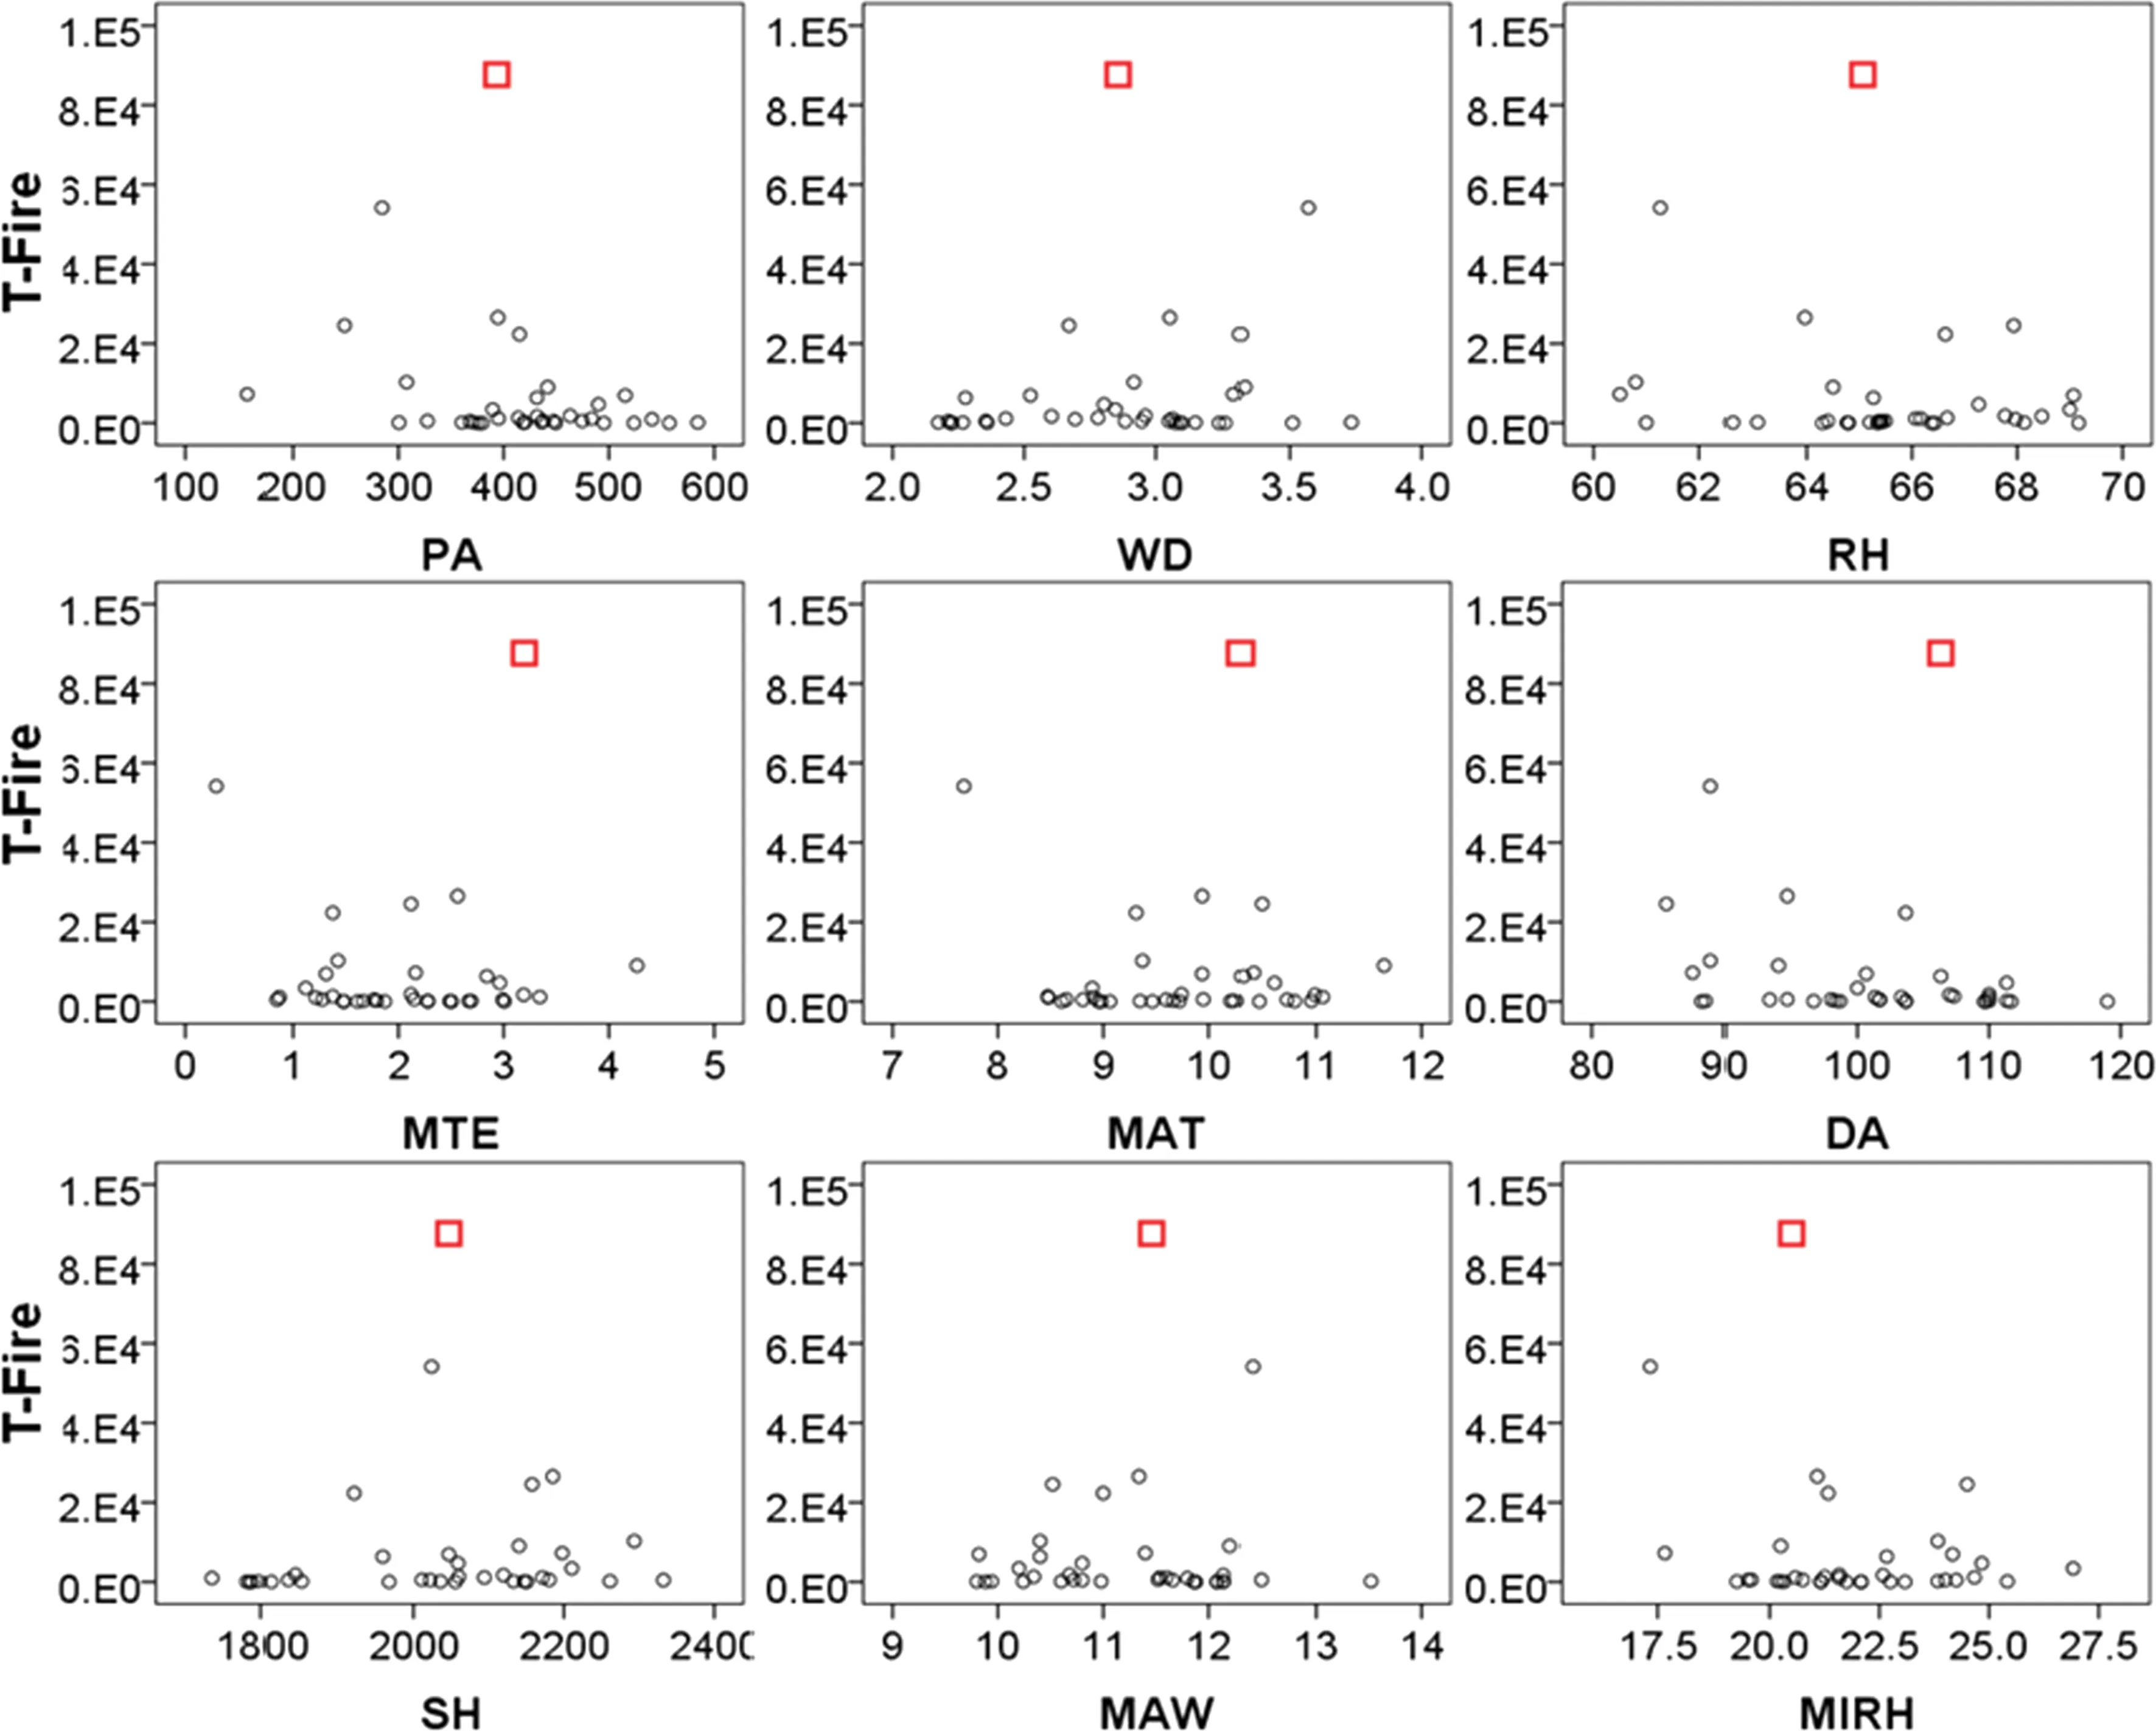
Fig.5 Scatter plots of the total area burned versus each climate variable.T-fire is the total burned area.The abbreviation of the climate variables on the X-axis is the same as in Table 1.Because there was a huge inter-annualvariation in the fire burned area,mainly due to an outlier of H-fire in 1987,we reduced the area burned by T-fire by 100 times,just for plotting purpose(i.e.,not did so in modeling processes).The outlier was represented by squares
The detailsofthe gamma-generalized linearbestmodelsfor the three response variables(L-fire,H-fire and T-fire)were examined by the parameter analysis(Littell et al.2009). Table 3 provided the sign and significance of the predictor variables in the gamma fullmodels.Table 4 listed the model coefficientestimate and p-values of the predictor variables for the gamma bestmodels.The indicated thatprecipitation(PA) and maximum wind speed(MAW)were negatively related to the area burned area by lightning-caused fire(L-fire),while the days that rainfall greater than 0.1 mm(DA)was positively impacted the L-fire.The mean temperature(MTE)was positively associated with the area burned caused by human activities(H-fire),whereas the minimum relative humidity(MIRH) and days that rainfall greater than 0.1 mm(DA)negatively impacted the human-caused burned area.For the total area burned by forestfire,the daysthatrainfallgreaterthan 0.1 mm (DA)and minimum relative humidity(MIRH)were the importantclimate variables forthe fire burned area(Table 4).
Discussion
Our study revealed that the gamma-generalized regression models were more suitable foranalyzing the area burned by forest fires,especially the human-caused and total burned area,in the Tahe forest region.Our results were partly in accordance with the finding by Littell et al.(2009),which indicated that the gamma-generalized linear models were generally superior in the southwestern ecoprovinces of USA,whereas log-linear models fitted data better in the cooler ecoprovinces.However,we did notfind the advantage of log-linear model for fitting our fire data.However, we did not investigate the applicability of differentmodels on different ecozones in this study,due to the relatively smallforestregion and unique foresttype of the study area.
According to other relevantstudies in the literature,the relative humidity is a good indicator of the area burned by forestfire(Skvarenina etal.2004;Holsten etal.2013).In this study,the similarresultwas found in the gamma model on the total burned area and the area burned by humancaused fire,but not by lightning-caused fire.We also identified thatthe average temperature(MTE)offire seasonswas significantly correlated with the area burned by humancaused fire,which was supported by Larsen(1996).Some fire-climate researches in the boreal forest ecosystemsaround the World indicated thatthe precipitation(PA)was a significant impact factor on the area burned by forest fire (e.g.,Larsen 1996;Bergeron et al.2001;Carcaillet et al. 2001;Anderson et al.2006).Our results showed that the days that rainfall greater than 0.1 mm(DA)was an important factor for the total burn area and the area burned by human-caused fire,which provided a collateralproofforthe influence of the precipitation.It is worth noting that the gamma bestmodelshowed an opposite influence of DA on the area burned by lightning-caused fire and human-caused fire.One possible explanation is thatthe DA may be a factor causing more lightning strikes(thus more lightning-caused fire),but DA may decrease human activities(thus less human-caused fire occurrence).
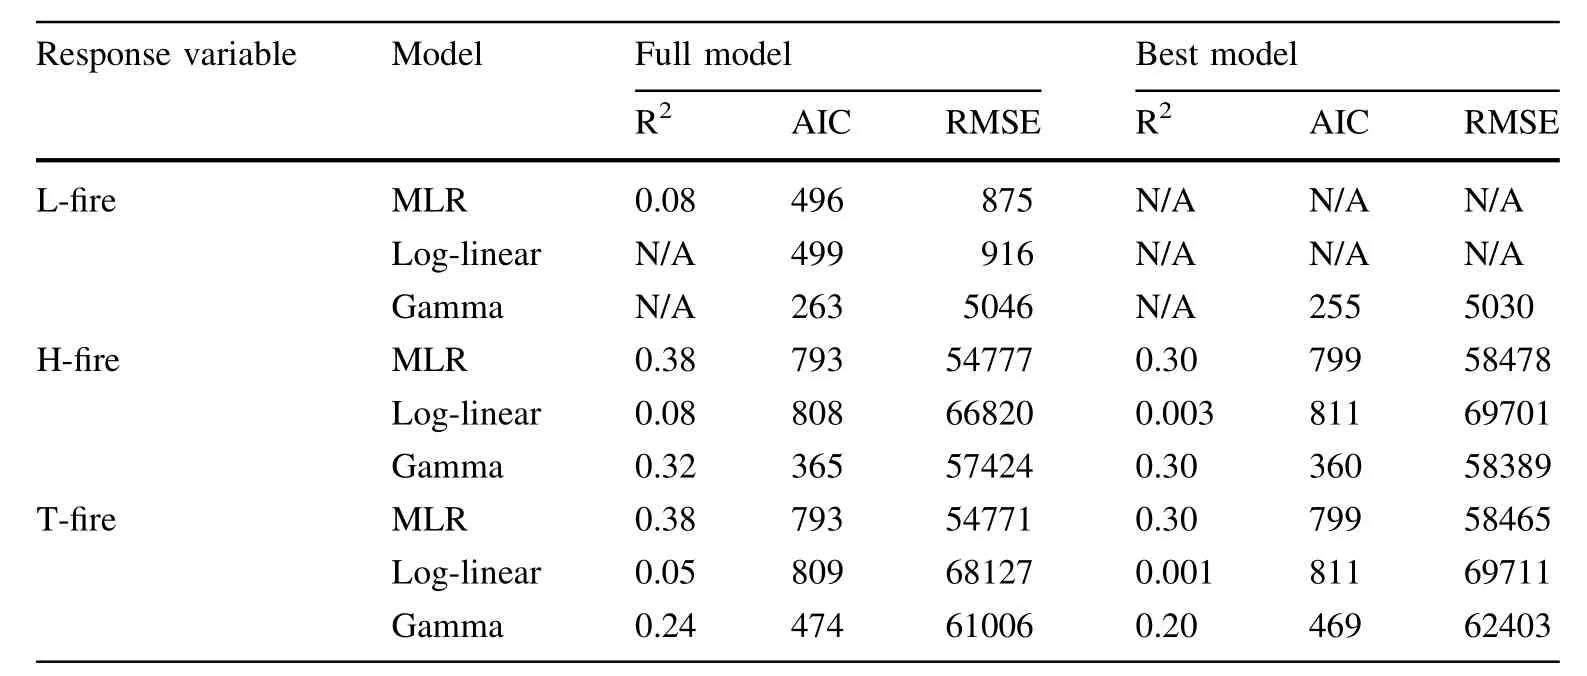
Table 2 Comparison of full models and best models of multiple linearregression model (MLR),log-linear model and gamma-generalized linear model

Table 3 Parameter analysis of gamma full modelby differentresponse variables
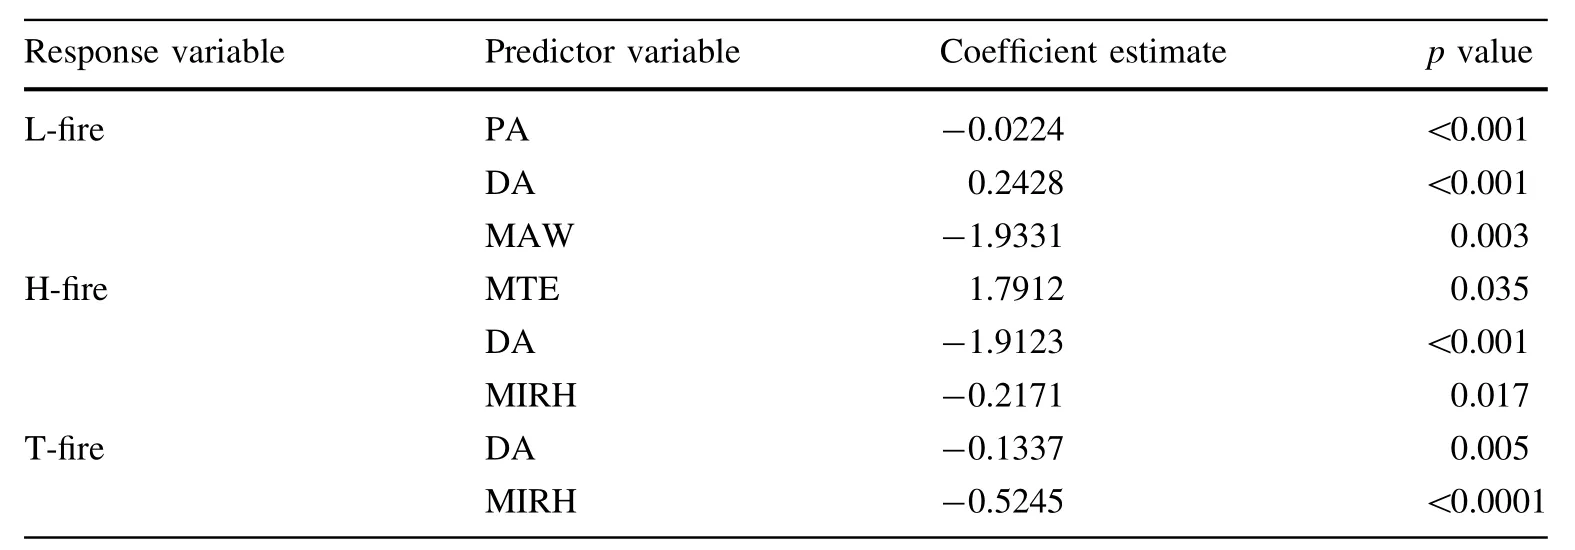
Table 4 Parameter estimates of the gamma best models by differentresponse variables
In this study,the R2of allmodels,including fullmodels and best models,were less than 0.4,meaning that these models can only explain limited percent of the total variations in the three response variables.In otherwords,these nine climate variables may not be sufficient to predict the area burned by forestfire.Otherfactors such as foresttype, topography,infrastructures or human-activities,may also significantly influence the fire burned area.On the other hand,the major tasks of local forest fire management are actively eliminating forest fires;hence the fire burned areamay vary dramatically along with the fire suppression efficiency.
Besides,there are considerable studies on the association between climate change and forestfire in the pastdecade.The results of these studies almost all revealed the significant influence of Atlantic Multidecadal Oscillation(AMO), Pacific DecadalOscillation(PDO)/ElNin˜o(EINino Southern Oscillation,ENSO)and Palmer’s Drought Severity Index (PDSI)on the fire frequency and burned area(e.g.,Fauria and Johnson 2008;Collins etal.2006;Littelletal.2009;Gillett et al.2004;Hess et al.2001;Hessl et al.2004).We did not take the above climate indices into account in this study because ourstudy area wasrelatively smallcompared to other studies which were either conducted in North American (Fauria and Johnson 2008)orwestern US(Littelletal.2009). In ourcase,the localclimate/weatherfactorscan impactlocal fire regime more significantly and directly in the study area.
Conclusions
We applied multiple linear regression,log-linear regression and gamma-generalized linear regression models to investigate the relationships between the area burned by forest fire and local climate variables.The results showed thatgamma-generalized linear modelwas superior to both multiple linear regression and log-linear regression models on different causes of forest fires according to the model fitting statistic tests such as AIC.
Moreover,the best models of the gamma-generalized linear regression revealed that the maximum wind speed (MAW),precipitation(PA)and days that rainfall greater than 0.1 mm(DA)were significantly impacting the area burned by the lightning-caused fire.The mean temperature (MTE),minimum relative humidity(MIRH)and days that rainfallgreaterthan 0.1 mm(DA)were the main drivers of the area burned by human-caused fire.Overall,the total burned area by forest fire was significantly influenced by the days that rainfall greater than 0.1 mm and minimum relative humidity,meaning the moisture condition of forest stand willdetermine the burned area.
AcknowledgmentsWe thank the anonymous reviewers for their comments on the previous version ofthe manuscript,which helped us to greatly improve the quality and readability ofthe paper.This study was funded by Asia–Pacific Forests Net(APFNET/2010/FPF/001),National NaturalScience Foundation ofChina(GrantNo.31400552)and Forestry industry research specialfunds forpublic welfare Projects(201404402).
Anderson RS,Hallett DJ,Berg E,Jass RB,Toney JL,de Fontaine CS, DeVolderA(2006)Holocene developmentofborealforestsand fire regimes on the Kenailowlands of Alaska.Holocene 16:791–803
Balling RC,Meyer G,Wells SG(1992)Relation of surface climate and burned area in Yellowstone National Park.Agric For Meteorol 60:285–293
Baskerville G(1972)Use of logarithmic regression in the estimation of plant biomass.Can J For Res 2(1):49–53
Bergeron Y,Gauthier S,Kafka V,Lefort P,Lesieur D(2001)Natural fire frequency for the eastern Canadian boreal forest:consequences for sustainable forestry.Can J For Res 31:384–391
CarcailletC,Bergeron Y,Richard PJH,Fre´chette B,GauthierS,Prairie YT(2001)Change offire frequency in the eastern Canadian boreal forests during the Holocene:does vegetation composition or climate triggerthe fire regime?JEcol89(6):930–946
Collins BM,Omi PN,Chapman PL(2006)Regional relationships between climate and wildfire-burned area in the Interior West, USA.Can J For Res 36:699–709
Du CY,Yu CL,Liu D(2010)Environmental analysis on lightning forest fires in Daxing’an mountains.Chin J Agrometeorol 31(4):596–599
Duff PA,Walsh JE,Graham JM,Mann DH,Rupp TS(2005)Impacts of large-scale atmospheric-ocean variability on Alaskan fire season severity.Ecol Appl 15:1317–1330
Fauria MM,Johnson EA(2008)Climate and wildfires in the North American boreal forest.Philos Trans R Soc B 363:2317–2329
Flannigan MD,Van Wagner CE(1991)Climate change and wildfire in Canada.Can J For Res 21:66–72
Flannigan MD,Logan KA,Amiro BD,Skinner WR,Stocks BJ(2005) Future area burned in Canada.Clim Change 72:1–16
Gillett NP,Weaver AJ,Zwiers FW,Flannigan MD(2004)Detecting the effect of climate change on Canadian forest fires.Geophys Res Lett 31:L18211
Hanna CT(2002)Statistical methods in hydrology,2nd edn.Iowa State University Press,Ames
Hess JC,Scott CA,Hufford GL,Fleming MD(2001)EINin˜o and its impacton the fire weatherin Alaska.IntJWildland Fire 10:1–13
Hessl AE,McKenzie D,Schellhaas R(2004)Drought and Pacific decadaloscillation linked to fire occurrence in the inland Pacific Northwest.J Appl Ecol 14:425–442
Holsten A,Dominic AR,Costa L,Kropp JP(2013)Evaluation of the performance of meteorological forest fire indices for German federal states.For Ecol Manag 287:123–131
Johnson EA,Wowchuk DR(1993)Wildfires in the southern Canadian Rocky mountains and their relationship to mid-tropospheric anomalies.Can J For Res 23:1213–1222
Johnstone JF,Hollingsworth TN,Chapin FS III,Mack MC(2010) Changes in fire regime break the legacy lock on successional trajectories in the Alaskan boreal forest.J Glob Change Biol 16(4):1281–1295
Kasischke ES,Verbyla DL,Rupp TS,McGuire AD,Murphy KA, Jandt R,Barnes JL,Hoy EE,Duffy PA,Calef M,Turetsky MR (2010)Alaska’s changing fire regime implications for the vulnerability of boreal forests.Can J For Res 40:1360–1370
Larsen CPS(1996)Fire and climate dynamics in the boreal forest of northern Alberta between AD 1850 and 1989.Holocene 6:449–456
Littell JS,McKenzie D,Peterson DL,Westerling AL(2009)Climate and wildfire area burned in western U.S.ecoprovinces, 1916–2003.Ecol Appl 19(4):1003–1021
Madgwick H,Satoo T(1975)On estimating the aboveground weights of tree stands.Ecology 56:1446–1450
McCoy VM,Burn CR(2005)Potential alteration by climate change of the forest-fire regime in the boreal forest of Central Yukon territory.Arctic 58:276–285
McCullagh P,Nelder JA(1989)Generalized linear models,2nd edn. Chapman&Hall/CRC,Boca Raton
Myers RH,Montgomery DC,Vining GG(2002)Generalized linear models with applications in engineering and the sciences.John Wiley and Sons,Inc.,New York
Nakagawa S,Schielzeth H(2013)A general and simple method for obtaining R2from generalized linear mixed-effects models. Methods Ecol Evol4(2):133–142
Qu ZL,Hu HQ(2007)Aprediction modelforforestfire-burntarea based on meteorologicalfactors.Chin JApplEcol18(12):2705–2709
Rawlings JO,Pantula SG,Dickey DA(1998)Applied regression analysis:a research tool,2nd edn.Springer,New York
Schoenberg FP,Peng R,Huang ZJ,Rundel P(2003)Detection of non-linearities in the dependence of burn area on fuel age and climatic variables.Int J Wildland Fire 12(1):1–6
Skinner WR,Flannigan MD,Stock BJ,Martell DL,Wotton BM, Todd JB,Mason JA,Logan KA,Bosch EM(2002)A 500 hpa synoptic wildland fire climatology forlarge Canadian forestfires 1959–1996.Theor Appl Climatol 71:157–169
Skvarenina J,Mindas J,Holecy J,Tucek J(2004)Analysis of the natural and meteorological conditions during two largest forest fire events in the Slovak Paradise National Park.J Meteorol 7:167–171
Tymstra C,Wang D,Rogeau MP(2005)Alberta wildfire regime analysis.Wildfire Science and Technology Report PFFC-01-5. Alberta Sustainable Resource Development,Forest Protection Division,Edmonton AB
Wang XL,Wang WJ,Chang Y,Feng YT,Chen HW,Hu YM,ChiJG (2013)Fire severity of burnt area in Huzhong forest region of Great Xing’an mountains,northeast China based on normalized burn ration analysis.Chin J Appl Ecol 24(4):967–974
Wilks DL(1990)Maximum likelihood estimation of the gamma distribution using data containing zeros.J Clim 3:1495–1501
Xiao X,White EP,Hooten MB,Durham SL(2011)On the use oflogtransformation vs.nonlinear regression for analyzing biological power laws.Ecology 92:1887–1894
Yang G,Di XY,Zeng T,Shu Z,Wang C,Yu HZ(2010)Prediction of area burned under climatic change scenarios:a case study in the Great Xing’an mountains borealforest.J For Res 21(2):213–218
Zhang LJ,Gove JH(2005)Spatial assessment of model errors from four regression techniques.For Sci 51(4):334–346
Zhao FJ,Shu LF,DiXY,Tian XR,Wang MY(2009)Changes in the occurring date of forest fires in the Inner Mongolia Daxing’anling forest region under global warming.Sci Silvae Sin 45(6):166–172
24 February 2014/Accepted:18 October 2014/Published online:21 June 2015
©Northeast Forestry University and Springer-Verlag Berlin Heidelberg 2015Project funding:This study was funded by Asia-Pacific Forests Net (APFNET/2010/FPF/001),National Natural Science Foundation of China(Grant No.31400552)and Forestry industry research special funds for public welfare projects(201404402).
The online version is available at http://www.springerlink.com
Corresponding editor:Chai Ruihai
✉Guangyu Wang guangyu.wang@ubc.ca
✉Haiqing Hu huhq@nefu.edu.cn
1Fujian Agriculture and Forestry University, Fuzhou 350002,Fujian,China
2Sustainable Forest Management Laboratory,Faculty of Forestry,University of British Columbia,Vancouver, BC V6T 1Z4,Canada
3Faculty of Forestry,Northeast Forestry University, Harbin 150040,Heilongjiang,China
杂志排行
Journal of Forestry Research的其它文章
- Axial variations in anatomical properties and basic density of Eucalypturograndis hybrid(Eucalyptus grandis×E.urophylla) clones
- Nest site characteristics and nest loss of Marsh Grassbird at Zhalong National Nature Reserve,China
- Variations in electrical impedance and phase angle among seedlings of Pinus densata and parental species in Pinus tabuliformis habitat environment
- Optimization of corn-stalk skin flake-wood shaving composite technology
- Characterization of ploidy levels in Chrysanthemum L.by flow cytometry
- Effects of salinity on the nail-holding power of dimension lumber used in light-frame wood building
