Anisotropic Thermal Expansion in Nitroguanidine Crystal
2015-05-10ZHANGHaobinXUJinjiangLIJingyouLIUYuLIUXiaofengSUNJie
ZHANG Hao-bin, XU Jin-jiang, LI Jing-you, LIU Yu, LIU Xiao-feng, SUN Jie
(Institute of Chemical Materials, China Academy of Engineering Physics, Mianyang 621999, China)
1 Introduction
The investigation of structure-function relationships is crucial to the development of materials science and applications. Especially, the newly emerged concept of inducing mechanical responses at the molecular level has attracted a great deal of interesting[1]. Thermal expansion in crystalline materials is a typical example of the impact of external stimuli on material properties and can be considered as responses occurring at the molecular level[2-3]. Generally, most solid-state materials expand to larger dimension with increasing temperature, and this phenomenon is known as positive thermal expansion (PTE), resulting from the increasing inharmonic vibration amplitudes of the ingredient atoms[4]. Normally, small PTE occurs along all three crystallographic axes for most of the materials. However, for a small number of materials, peculiar structure may cause anomalously large PTE or negative thermal expansion (NTE)[5-7]. The thermal expansion is strongly correlated to the crystal structures and intermolecular interactions[8]. Wei et al[9]investigated the influence of the host-guest intermolecular interactions on temperature dependent thermal expansion of two host-guest molecules, 3-Ni·DMF and 3-Ni·MeOH. Das et al[10]reported extremely large positive and negative thermal expansion for a dumbbell-shaped organic molecule induced by a helical pattern of strong hydrogen bond. To satisfy different application requirements, materials with structural peculiarities have been designed to possess different thermal expansions. However, the effect of molecule packing and intramolecular interactions on crystal thermal expansion, especially on the NTE has not being clear yet.
Nitroguanidine (NQ), as one of the newly developing insensitive high explosives (IHE), can be used as a component of solid rocket propellants. With two amino group and one nitro group in a molecule, NQ crystallizes in the orthorhombic space-group Fdd2, under the intermolecular hydrogen bonds network[11]. The thermal expansion of NQ can provide a better understanding of the influence of molecules packing and intramolecular interactions on physical properties of energetic materials. Furthermore, the thermal expansion property plays an important role in the storage, transportation and application of energetic materials[12-13]. However, to the best of our knowledge, no investigation about thermal expansion of NQ crystal has been reported yet.
In this paper, we used X-ray powder diffraction and Rietveld refinement[14-15]to investigate the thermal expansion of NQ in the temperature range of 30 ℃ to 160 ℃. Rietveld refinement was applied in the program TOPAS 3.0 to get the lattice parameters of NQ.
2 Experimental
2.1 Materials
NQ (purity, 99%) was provided by the Institute of Chemical Materials, China Academy of Engineering Physics. The mean particle size was about 20 μm.
2.2 Variable Temperature X-Ray Powder Diffraction
Powder X-ray diffraction experiments were performed by using a Bruker D8 Advance X-ray diffractometer equipped with a Cu tube and Ni-filter, yielding Cu Kα1and Cu Kα2radiation (λ1=1.5406 Å,λ2=1.5444 Å, respectively). The diffractometer was operated in Bragg-Brentano geometry with the data collected using a Vantec linear position-sensitive detector (PSD). A variable temperature sample environment of 30-160 ℃was achieved by using a TTK450 temperature chamber. The X-ray tube operating conditions were 40 kV and 40 mA. Data collection were performed from 10° to 60° in 2θby using a step size of Δ2θ=0.01° and a counting time of 0.5 s/step. The scanning data were collected during heating from 30 ℃ to 160 ℃ in intervals of 10 ℃ at a constant heating rate of 0.1 ℃·s-1.
2.3 Rietveld Refinement
Obtained diffraction patterns were refined by Rietveld method as implement within the program TOPAS 3.0 to get the lattice parameters changes varying with temperature. The observed line profile fitting was performed by using fundamental parameters approach (FPA). The information about setting instrument parameters has been mentioned in a previous work[16]. The lattice parameters of NQ used as initial values for Rietveld refinement are listed in Table 1.
Table 1 lattice parameters of NQ in ICCD databases

spacegroupa/Åb/Åc/ÅV/Å3PDFnumberFdd217.61524.8503.5881570.61601-073-1862
3 Results and Discussion
3.1 Thermal Expansion of NQ
The XRD patterns of NQ at elevated temperature are presented in Fig.1. It is clear that there were some Bragg reflections shifted toward lower or higher diffraction angles, but no phase transformation taken place. The diffraction peak (2θ) of (3 1 1) plane shifted from 29.26° to 28.77°, overlapped into the (0 8 0) peak gradually as the temperature increasing from 30 ℃ to 160 ℃. The same situation could be observed on the (1 5 1) and (3 5 1) peaks, which shifted to lower angles and overlapped with the (2 8 0) and (6 4 0) peaks at last, respectively. It could be concluded that the (h k 0) peaks shifted to higher angles while the other peaks shifted to lower angles. According to the Bragg equation, the inter-planar spacing was inversely proportional to 2θ. So, the inter-planar spacing for (h k 0) planes were decreasing with the increasing temperature, which indicated the NTE displayed on the (h k 0) planes, that means thea- andb- axes shrank with temperature increasing, while the other crystal planes took place positive thermal expansion. For further understanding of the NTE, lattice parameters of NQ crystal were refined by Rietveld method, and the parameters changing with temperature were shown in Fig.2.
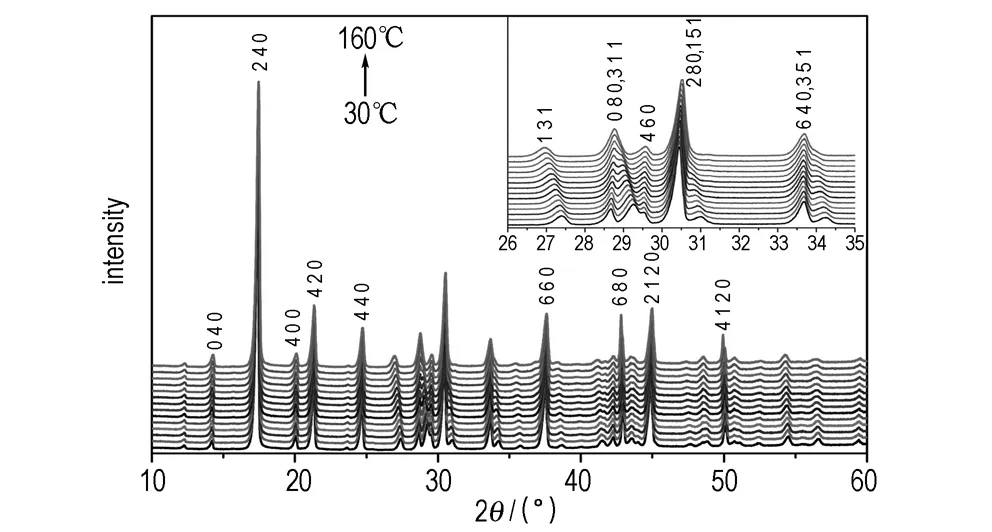
Fig.1 XRD patterns of NQ at elevated temperature
In the course of variable temperature experiments, there was a gradual decrease in the dimension of theb-axis with the temperature increasing from 30 ℃ to 160 ℃, and for comparison,thea-axisincreasedslowlyandthec-axisincreased rapidly (see Fig.2), which could be interpreted as uniaxial negative thermal expansion. The degree of linear thermal expansion was quantified by using a coefficient defined asα=(lT-l0)/l0(T-T0), wherelTwas the axis length at the final temperatureTandl0was the axis length at the initial temperatureT0[17]. The average thermal expansion coefficients of the crystallographic axes in the temperature range from 30 ℃ to 160 ℃ along thebaxis was -10.1×10⁻⁶℃-1, and that foraandcaxes were 12.9×10⁻⁶℃-1and 145.5×10⁻⁶℃-1, respectively. The unit cell volume showed a normal PTE with the thermal expansion coefficient 148×10-5℃-1. The thermal expansion of NQ crystal was markedly anisotropic, which should result from the anisotropic intermolecular interactions and molecules arrangement.

a. a-axis

b. b-axis
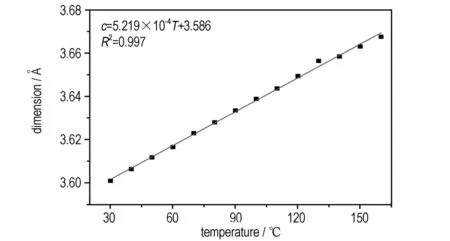
c. c-axis
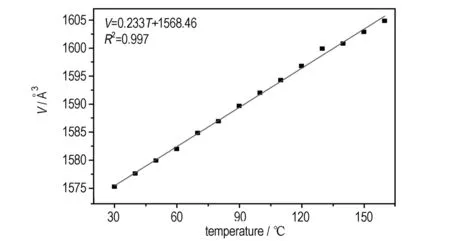
d. volume
Fig.2 Lattice parameters of NQ as the function of temperature
To investigate the mechanism of highly anisotropic thermal expansion and uniaxial NTE in NQ, we discussed the packing of molecules in crystal. The structure of NQ was constructed by intermolecular hydrogen bonds network (Fig.3), there are five kinds of hydrogen bonds in the structure[11], and the hydrogen bonds of N(1)—H(2)…N(3) and N(2)—H(3)…O(2) linked the molecules of A and B (Fig.3a) into the same plane. View the structure perpendicular to thea-cplane (Fig.3b), the molecules with same color were parallel to each other, while the molecules with different color crossed with each other, which were linked by the weak intermolecular hydrogen bonds of N(1)—H(1)…O(1) and N(2)—H(4)…O(1). The interaction between the layers were weak van der Waals interactions, indicating that the direction perpendicular to the layers was the softest direction of the crystal, therefore, the distance between the layers would increase significantly as the temperature increased. The increase of the layer spacing contributed to the thermal expansion ofa- andc-axis, but a different phenomenon takes place to theb-axis.
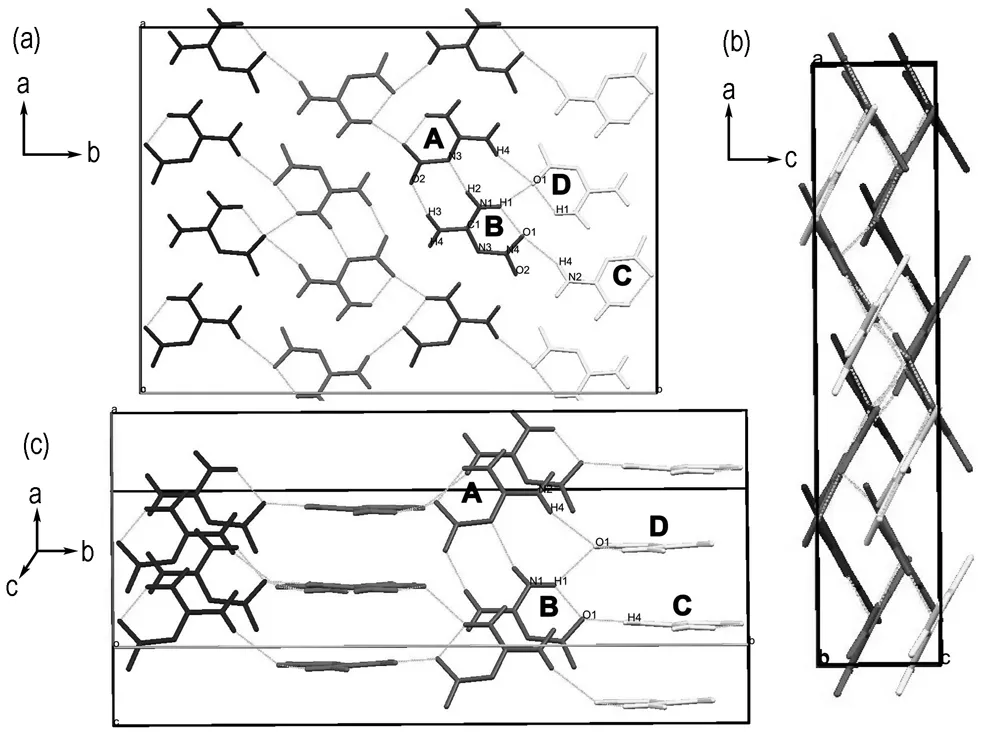
a.view fromc-axis b.view fromb-axis c.lamelar molecular packing of NQ crystal cell
Fig.3 Molecular packing of NQ (Different colors were used to distinguish different paralleled layers. Hydrogen bonds represented as dash lines)
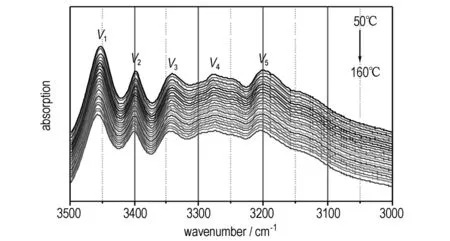
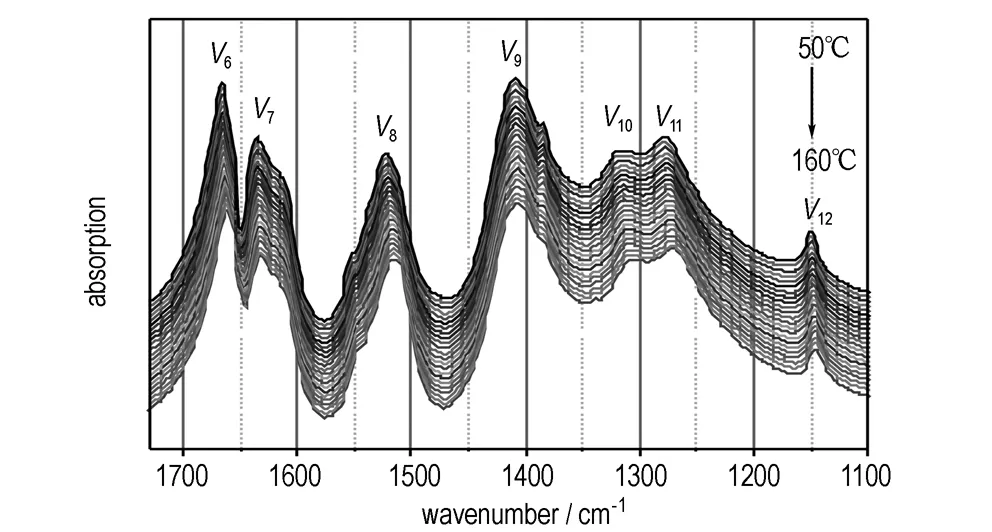
With the temperature increasing, the distance between the molecules of C and D would become larger (Fig.3c), with the hydrogen-bond between the molecules of A and B reducing gradually. To further investigate the strength and changing of hydrogen bonds varying with temperature, the infrared (IR) spectroscopy is employed. As the IR bands of NH2and NO2group will shift with the formation of hydrogen bond, and the transfer varying with hydrogen bond strength[18-19]. If the hydrogen bonds change with temperature, the IR absorption spectrum will change correspondingly. Herein, the in-situ Fourier transform IR spectra of NQ are used to verify the change of hydrogen bonds, as shown in Fig.4.
a. 3500-3000 cm-1
b.1700-1100 cm-1
Fig.4 IR spectra of NQ during the temperature increasing from 50 ℃ to 160 ℃
3.2 Relationship betweenThermal Expansion and Crystal structure
In the NQ crystal, the NH2groups connected with CN—NO2groups under hydrogen bond networks. As the H atoms are exposed to different hydrogen bonds, the vibration absorption band of NH2groups will spilt up to at least five bands in the range from 3500 cm-1to 3000 cm-1(Fig.4a). As temperature increasing, the vibration bands shift to high wavenumber gradually, which means the effect of hydrogen bond on NH2groups weaken gradually. Moreover, the changes of IR bands of CN—NO2groups also reflected the weakening of hydrogen bonds, seen as the v6(asymmetric stretching vibration of NQ2), v8(stretching vibration of CN), v10(symmetric stretching vibration of NQ2) all take place a red shift. As to other IR bands, which are seldom influenced by the hydrogen bond, the shift is very slight. So, we can confirm that the hydrogen bonds between NQ molecules relax gradually as temperature increase.
Combined with the hydrogen bond relaxing, the intermolecular distances enlarge slowly. As aconsequence, the space hindrance between layers with molecule A and B and that with molecule C and D will decrease. Therefore the hydrogen bond existed between the two layers can drawn them approach to each other. Because of the increasing an harmonic vibration amplitudes of the ingredient atoms or molecules, NQ should take place a slight positive thermal expansion along theb-axis, just as that take place along thea- andc- axis. But the influence of the layers nearing is much stronger than the thermal expansion. Finally, the lattice dimension along the b-axis will shrink with temperature increasing, which means a negative thermal expansion takes place in the NQ crystals along theb-axis. The intermolecular hydrogen bonds of N(1)—H(1)…O(1) and N(2)—H(4)…O(1) would pull the molecules of A and B closer to the molecules of C and D by sliding. A similar mechanism had been reported by Bhattacharya et al, sliding of layers caused the NTE in crystals of BTA·DMA·H2O organic complex[20]. There are many crystal structures are made of stacked 2D layers, but few of them display NTE, therefore, the study of NTE of NQ crystals would be very meaningful to better understand the influence of molecules packing on physical properties.
4 Conclusions
By means of X-ray powder diffraction and Rietveld refinement, the thermal expansion coefficient of NQ crystal was obtained, especially an anisotropic and negative thermal expansion of NQ was revealed. Highly anisotropic thermal expansions are caused by the anisotropic intermolecular interactions. The intermolecular hydrogen bond weakening as the temperature increase should result into NTE, with a shrink of crystal along thebaxis takes place by the enlargement of intermolecular distances and decrease of space hindrance.
These results can provide a better consult to understand the influence of molecular structure on the physical properties of crystals.
[1] Khuong T A V, Nunez J E, Godinez C E, et al. Crystalline molecular machines: a quest toward solid-state dynamics and function[J].AccChemRes, 2006, 39(6): 413-22.
[2] Bhattacharya S, Saha B K. Steric guided anomalous thermal expansion in a dimorphic organic system[J].CrystEngComm, 2014, 16(12): 2340-2343.
[3] Peter K, Miria A, Yan X, et al.Isotropic negative thermal expansion in β-Si (NCN)2and its origin[J].TheJournalofPhysicalChemistryC, 2012, 116(1): 526-531.
[4] Novikova S I. Thermal expansion of solids[J].MoscowIzdatelNauka, 1974, -1(7): 454-455.
[5] Miller W, Smith C W, Mackenzie D S, et al. Negative thermal expansion: a review[J].Journalofmaterialsscience, 2009, 44(20): 5441-5451.
[6] Lim T C. Negative thermal expansion structures constructed from positive thermal expansion trusses[J].JournalofMaterialsScience, 2012, 47(1): 368-373.
[7] Nicolaï, B, Rietveld I B, Barrio M, et al. Uniaxial negative thermal expansion in crystals of tienoxolol[J].StructuralChemistry, 2013, 24(1): 279-283.
[8] Grande T, Tolchard JR, Selbach SM. Anisotropic thermal and chemical expansion in sr-substituted LaMnO3+δ: Implications for chemical strain relaxation[J].ChemistryofMaterials, 2011, 24(2): 338-345.
[9] Wei Y S, Chen K J, Liao P Q, et al. Turning on the flexibility of isoreticular porous coordination frameworks for drastically tunable framework breathing and thermal expansion[J].ChemicalScience, 2013, 4(4): 1539-1546.
[10] Das D, Jacobs T, Barbour L J. Exceptionally large positive and negative anisotropic thermal expansion of an organic crystalline material[J].NatureMaterials, 2010, 9(1):36-39.
[11] Rietveld H M. A profile refinement method for nuclear and magnetic structures[J].JournalofAppliedCrystallography, 1969, 2(2): 65-71.
[12] Jon L Maienschein, F Garcia. Thermal expansion of TATB-based explosives from 300 to 566 K[J].ThermochimicaActa, 2002, 384: 71-83.
[13] Sun J, Zhang H B, Wen M P, et al. Influence of crystal preferred orientation on thermal expansion of die pressed TATB based PBXs[J].ChineseJournalofEnergeticMaterials(HannengCailiao), 2012, 20(5): 545-550.
[14] Rietveld H M. A profile refinement method for nuclear and magnetic structures[J].JournalofAppliedCrystallography, 1969, 2(2): 65-71.
[15] Sun J, Zhang H B, Shu X Y, et al. Measurement of CTE and theoretical density of explosive crystal by XRD[J].ChineseJournalofEnergeticMaterials(HannengCailiao), 2010, 18(5): 510-513.
[16] Xue C, Sun J, Kang B, et al. Theβ-δ phase transition and thermal expansion of octahydro-1,3,5,7- tetranitro-1,3,5,7-tetrazocine[J].Propellants,Explosives,Pyrotechnics, 2010, 35(4): 333-338.
[17] Emile R Engel, Vincent J Smith, Charl X Bezuidenhout, et al. Uniaxial negative thermal expansion facilitated by weak host-guest interactions[J].ChemicalCommunications, 2014, 50(32): 4238-4241.
[18] Chaoyang Zhang, Xiaochuan Wang, Hui Huang. π-Stacked Interactions in Explosive Crystals: Buffers against External Mechanical Stimuli[J].JAmChemSoc, 2008. 130(26): 8359-8365.
[19] Zhang C Y. Understanding the desensitizing mechanism of olefin in explosives versus external mechanical stimuli[J].TheJournalofPhysicalChemistryC, 2010, 114(11): 5068-5072.
[20] Bhattacharya S, Saha B K. Uniaxial Negative Thermal expansion in an organic complex caused by sliding of layers[J].CrystalGrowth&Design, 2012, 12(10): 4716-4719.
杂志排行
含能材料的其它文章
- Synthesis and Characterization of Two New Energetic Polyamino and Nitro Pyridine Derivatives
- 《含能材料》2015年(第23卷)总目次
- Non-isothermal Decomposition Kinetics,Specific Heat Capacity and Adiabatic Time-to-explosion of Cu(pn)2(FOX-7)2
- Facile Synthesis and Crystal Structure of 3,4-Bis(1H-5-tetrazolyl)furoxan
- Synthesis and Properties of N,N-Bis((3,5-dinitro-1H-1,2,4-triazol-1-yl)methyl) nitramine
- Comparison with Molecular Surface Electrostatic Potential and Thermal Reactivity of Nitramines
