Genetic-algorithm-based balanced distribution of functional characteristics for machines
2015-04-24WANGGuoxin王国新DUJingjun杜景军YANYan阎艳
WANG Guo-xin (王国新), DU Jing-jun (杜景军), YAN Yan (阎艳)
(School of Mechanical Engineering, Beijing Institute of Technology, Beijing 100081, China)
Genetic-algorithm-based balanced distribution of functional characteristics for machines
WANG Guo-xin (王国新), DU Jing-jun (杜景军), YAN Yan (阎艳)
(School of Mechanical Engineering, Beijing Institute of Technology, Beijing 100081, China)
In order to make reconfigurable manufacturing system (RMS) adapt to the fluctuations of production demand with the minimum number of reconfigurations in its full life cycle, we presented a method to design RMS based on the balanced distribution of functional characteristics for machines. With this method, functional characteristics were classified based on machining functions of cutting-tools and machining accuracy of machines. Then the optimization objective was set as the total shortest mobile distance that all the workpieces are moved from one machine to another, and an improved genetic algorithm (GA) was proposed to optimize the configuration. The elitist strategy was used to enhance the global optimization ability of GA, and excellent gene pool was designed to maintain the diversity of population. Software Matlab was used to realize the algorithm, and a case study of simulation was used to evaluate the method.
reconfigurable manufacturing systems; balanced distribution; functional characteristics; genetic algorithm
With increasing global competition, manufacturing enterprises face more frequent and unpredictable changes in product type and quantity[1-2]. Therefore, it is very important to generate required functions with the lowest cost and within the shortest time. That requires system designers to consider the reconfigurability of manufacturing systems in the initial design stage, which, however, is rarely considered in the current layout of manufacturing systems. For example, Analytic hierarchy process was used to select manufacturing system configurations[3-4]. Youssef et al.[5]raised selecting optimal configuration by through two stages. Youssef et al.[6]used universal generating function to optimize RMS configurations. Dou et al.[7]utilized graph theory to get the optimal and K-1 suboptimal single part flow-line. Kumar et al.[8]raised a heuristic to determine a common linear machine sequence for multiple products. Jaramillo et al.[9]presented a new mathematical formulation. Baykasoglu[10]proposed distributed layout method based on the capacity of machines. However, the classification of capacity is complex and it is difficult to adapt to the real life production environment. Moreover, the using efficiency of capacity was not considered.
While there are lots of researches about selection of RMS configurations going on, there is little study about the configuration generation based on machining functions of machines. A reasonable workshop equipment layout physically in the initial stage of each production cycle can distinctly improve production efficiency. This capacity can be obtained by making the machining functions of machine well-distributed in the shop floor. In this paper, a strategy that designs layout of RMS was given and the shortest material handling distance was set as the optimization objective. GA was used to solve the problem.
1 Definition and classification of FCM
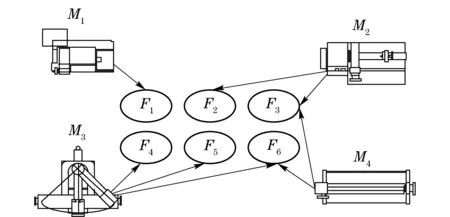
In a reconfigurable manufacturing system, there are generally several types of machines, such as reconfigurable machines tools and machining centers. Each of them has a variety of machining functions. For example, a turning-milling machining center has the machining functions of turning and milling. A diagram is given in Fig.1 to represent the relationship of machines and functions. In the figure, there are four machines, where machinesM1,M2,M3, andM4have machining functions ofF1,F2,F3, andF4respectively. It can be seen that there are four types of relationships between machines and functions including one-to-one, one-to-many, many-to-one and many-to-many. If these functions have a reasonable distribution, configuration can be formed easily and the total material handling distance can be got with a relatively small value. Therefore, a classified method of functional characteristics of machine (FCMs) should be given so that configuration can be formed conveniently. FCMs are related to cutting tools and machining accuracy. Therefore, FCM can be represented by two-tuples as follows:
FCM=<{T}, {A}>T={t1,t2,t3, …}A={a1,a2,a3,a4,a5}
whereTis the set of cutting tools;Ais the set of accuracy levels;ti(i=1, 2,…) can be facing tool, face milling cutter, cylindrical turning tool and so on;a1,a2,a3,a4anda5respectively indicate low, bottom middle, upper middle, high and ultra-high levels. The rule to classify accuracy levels is given in Tab.1, where the basis for classification are dimensional accuracy and roughness that can be processed by corresponding tools.
FCMs are determined by their economical processing methods. For example, if a machine can process workpieces that are required either low or medium levels, the medium level should be excluded when low level is far more economical. After FCMs are determined, the problem of optimal layout of machines can be transformed to gain the balanced layout of FCMs. According to the balanced strategy, a configuration can be got in a small area to ensure that the handling material distance is the smallest. The following sections focus on how to make these machining functions scatter uniformly in the shop floor.

Fig.1 Relationship between machines and their functions
Tab.1 Accuracy classification

AccuracylevelsDimensionalaccuracyRoughness/μmLowIT13⁃IT1125-12 5BottommiddleIT10⁃IT96 3-1 6UppermiddleIT8⁃IT71 6-0 8HighIT7⁃IT60 8-0 2Ultra⁃highIT5⁃IT2<0 2
2 Mathematical model of balanced distribution for FCMs
Actually, the layout of machines can be presented by the layout of FCMs. As can be seen in Fig.2a, there are four types of FCMs in a workshop. The four FCMs are respectively FCM1, FCM2, FCM3, and FCM4. And for every FCM, the distribution of FCM can be got as shown in Fig.2c-Fig.2f. In Fig.2c-Fig.2f, each sign “0” or “1” corresponds to the machine in corresponding position in Fig.2b where there are a total of sixteen machines. The sign “0” indicates that the machine in the corresponding position does not have the FCM and the sign “1” indicates that the machine in the corresponding position has the FCM.
For calculating the distance of any two machines, first of all, the location identification of machineMi(i=1,2, …,16) is determined as (xi,yi), meaning in the row ofxiand column ofyi. So the distance between machineMiwhose location identification is (xi,yi) and machineMjwhose location identification is (xj,yj) can be calculated as
Li,j=|xi-xj|+|yi-yj|
(1)
For example, in Fig.2b, the location identification ofM9is (4, 2) and the location identification ofM5is (2, 3). According to Eq.(1), the distance of the two machines is calculated as
L9, 5=|4-2|+|2-3|=3

Fig.2 Machines and FCMs distribution
The rules to calculate the evaluation value of one FCM distribution are given as follows.
①In a FCM distribution, only the distance from “0” to “1” can be calculated, because two continuous processes generally are different in the actual processing.
②The distance from “0” to “1” is recorded as 1, others are recorded as 0.
③The distance of any two positions is calculated by the rectilinear movement distance, or according to Eq.(1).
④If the number of machines that have shortest distance from “0” to “1” is bigger than 1, then the evaluation value should be calculated asD/n, whereDis the shortest distance andnis the number of machines that have shortest distance from “0” to “1”. For example, in Fig.2c, there are two machines that have the shortest distance to the machine whose location identification is (2, 2). The location identifications of the two machines are respectively (1, 2) and (2, 1). Therefore, the evaluation value is 1/2 instead of 1.
As can be seen in Fig.2, the layout of machines and distribution of FCMs are represented. Each machine corresponds tonFCMs and one machine floor corresponds tonFCM floors. All the FCMs are important factors that impact on the layout of machines. Therefore, all the evaluation value of the FCMs distribution should be calculated.
Total evaluation value of one FCM distribution can be calculated by summing all the shortest distance from “0” to “1”. Then each FCM will be given a weight. The weight indicates the degree that the FCM effects on the evaluation value of workshop layout, because these FCMs have different using frequencies so that weight can be got by comparing the frequencies of different FCMs in the previous history processing. With the evaluation method, the total material handling distance can be calculated as
(2)
where,Lis the number of FCM in the workshop;αlis the weight factor of thel-th FCM;Mis the number of machines in the same row.Nis the number of machines in the same column;lis thel-th FCM; (x,y) is the location identification of the machine; (x0,y0) is the location identification of the machine that has the shortest distance from the machine whose location identification is (x,y), withx≠x1ory≠y1;Tlxyis a sign;Zlxyis number of machines that have the shortest distance.
Constraint conditions are described as follows.
①Txyequals 0 or 1 If there is an FCM in the position whose location identification is (x,y),Txyis 1, otherwise,Txyis 0.
(3)
②The sum of all the weights is 1.
(4)
③There is one machine in each position.
(5)
④Zlxyisavaluethatbiggerthan1andsmallerthanthenumberofmachines,wherethenumberofmachinesintheworkshopisMnum
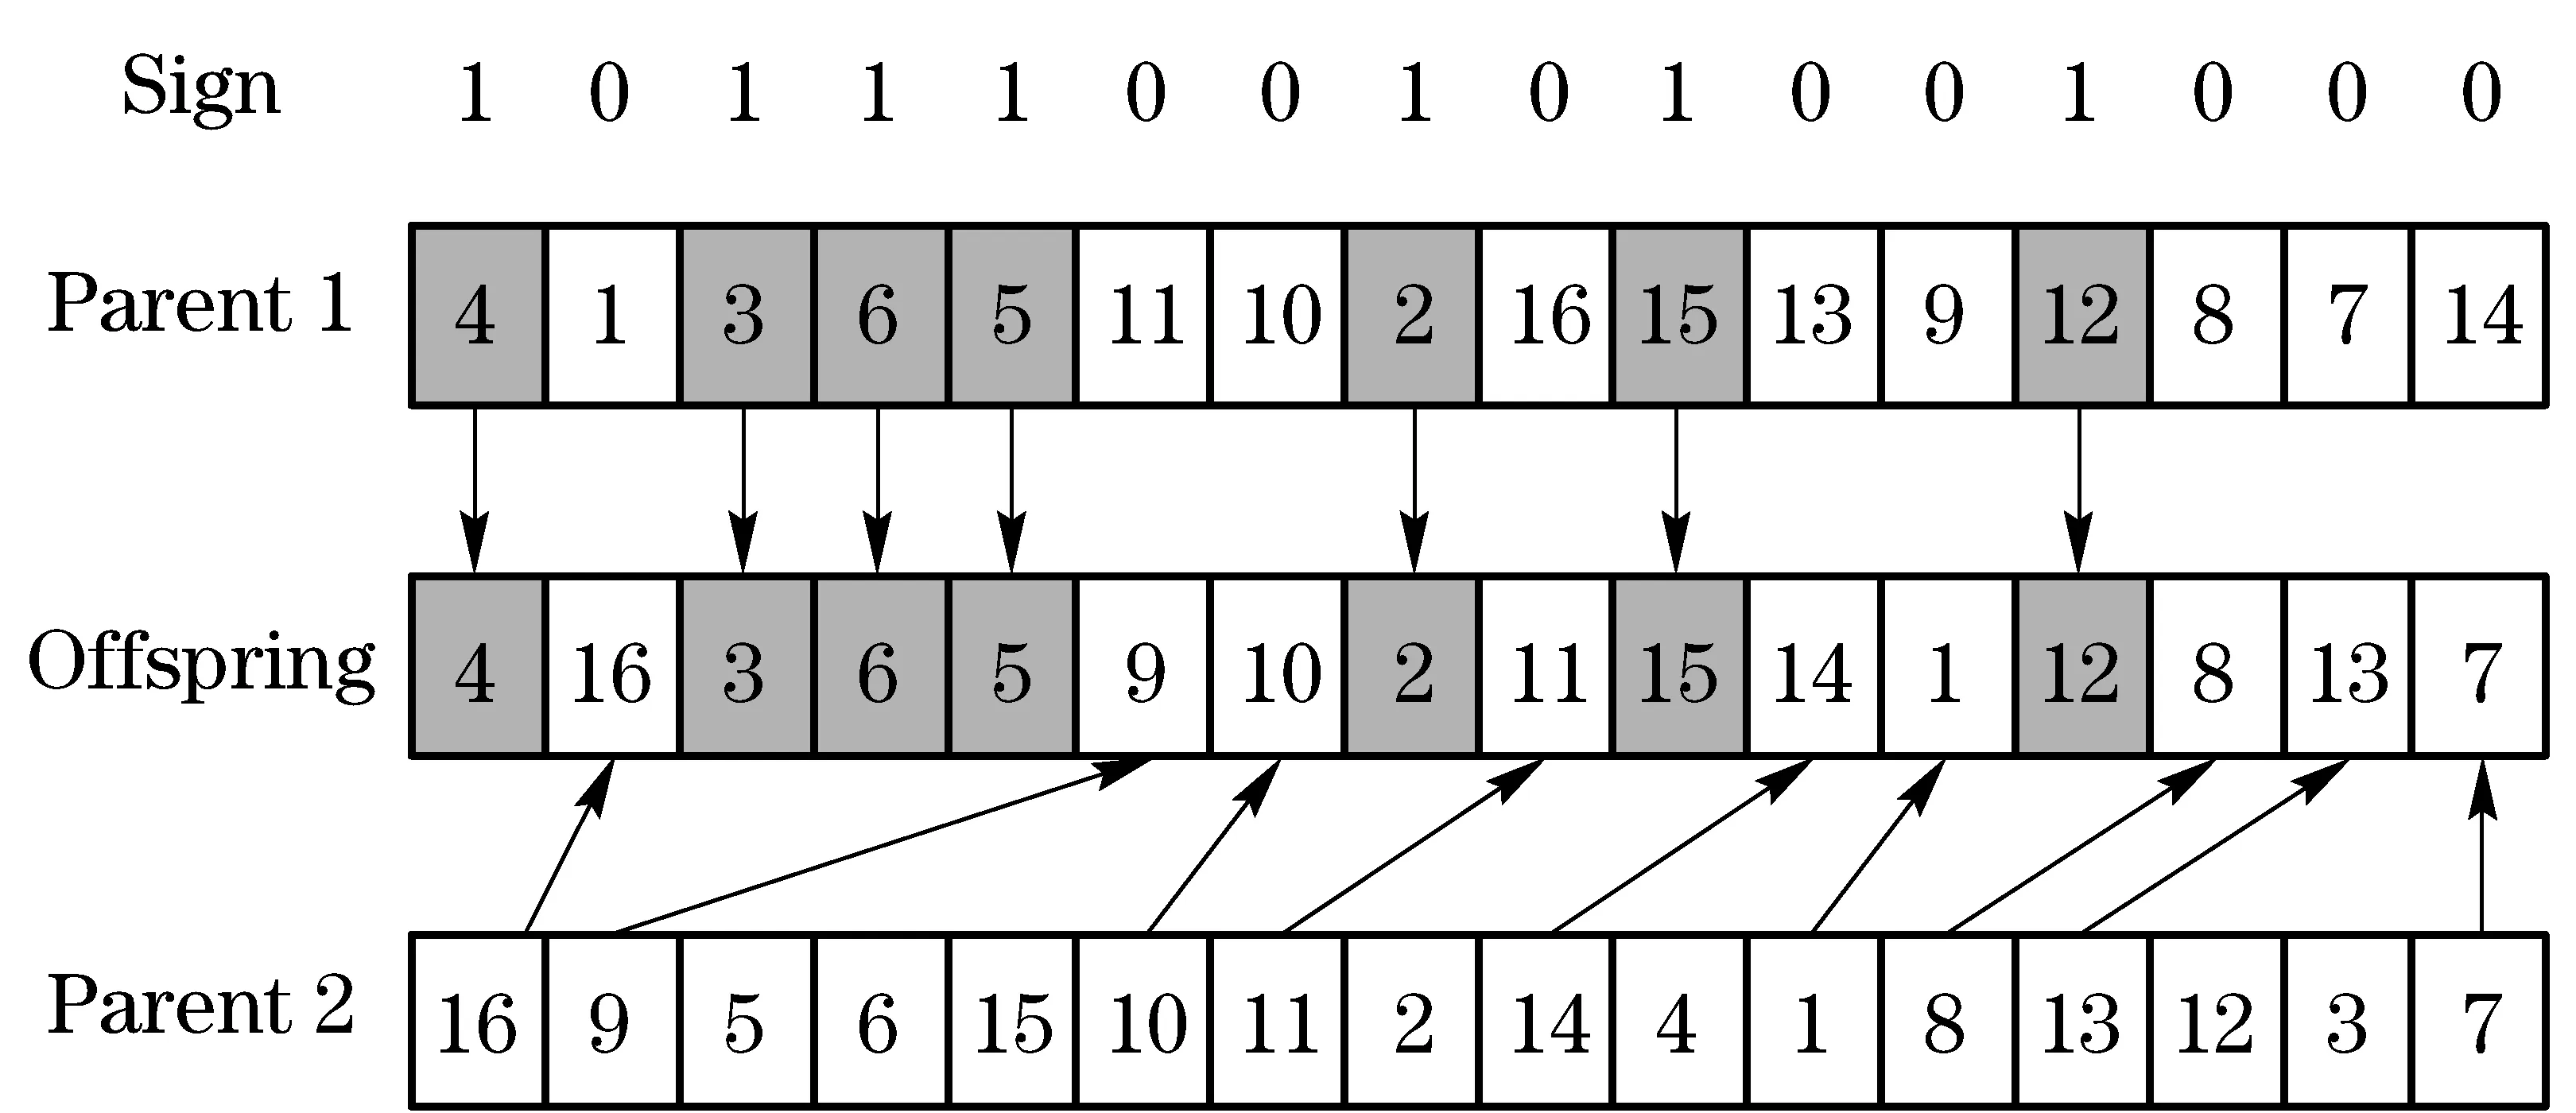
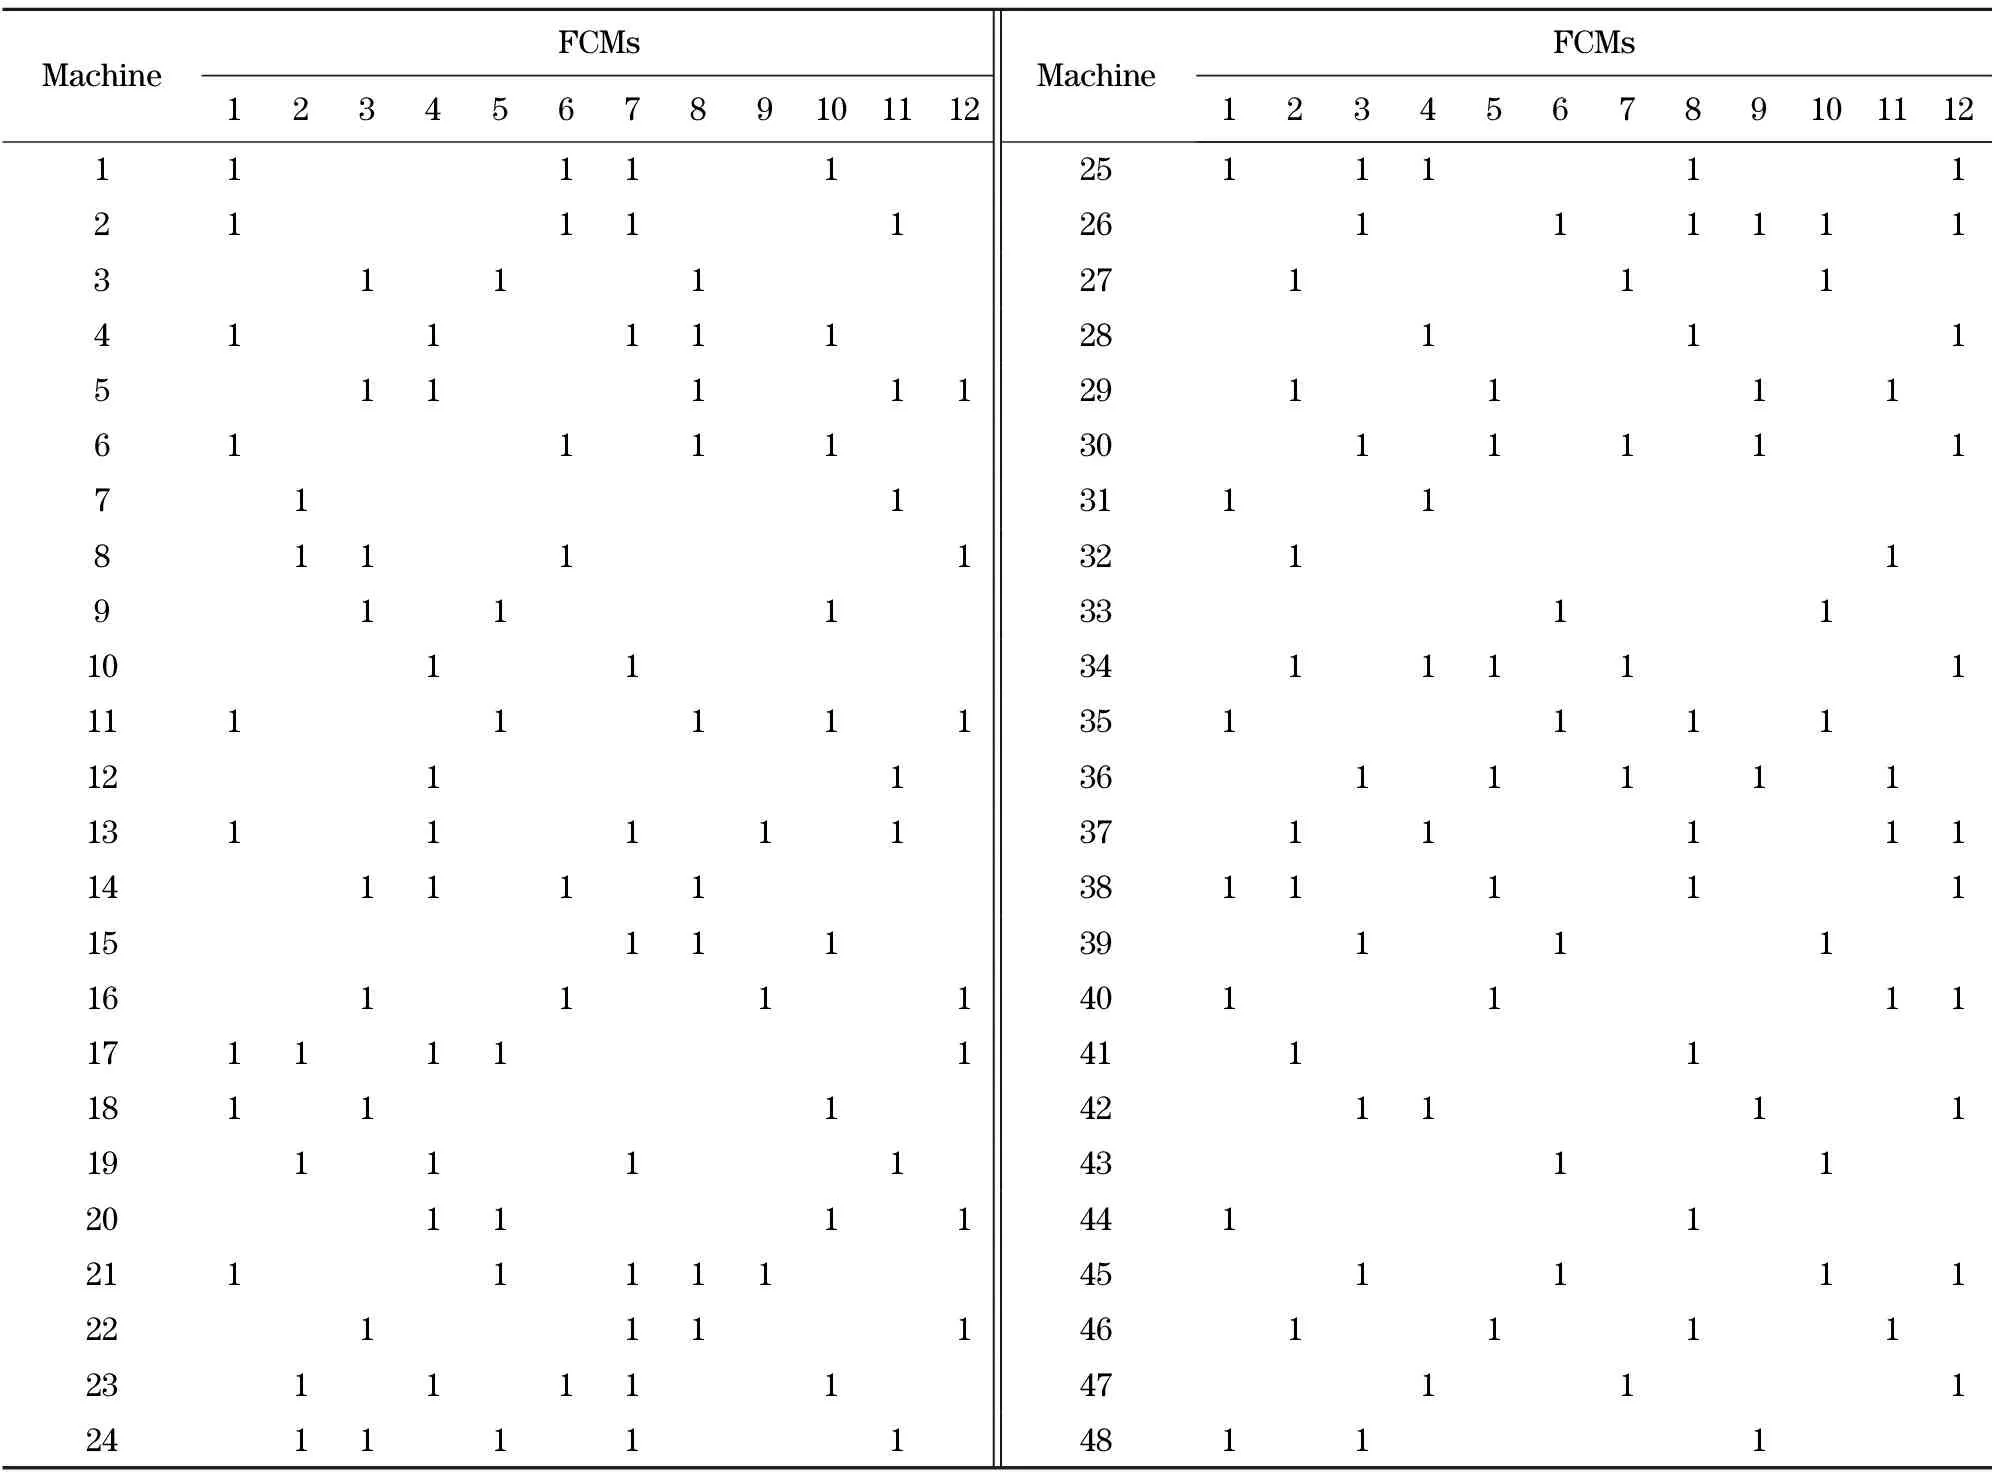
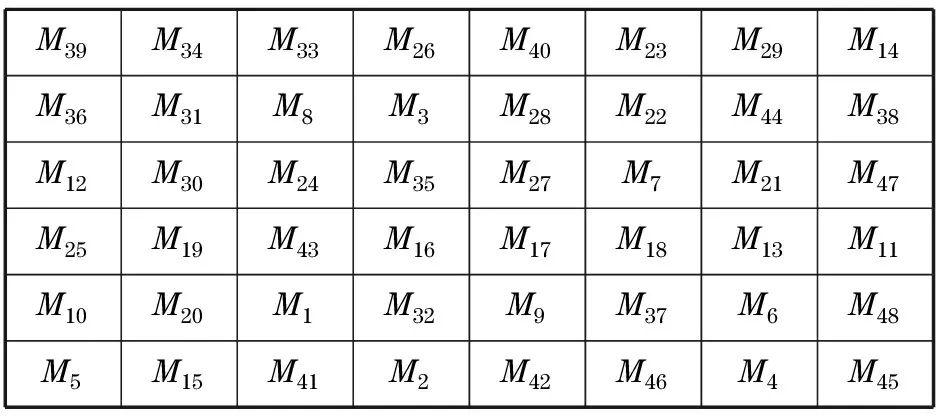
1≤Zlxy (6) This is a combinatorial optimization problem that traditional methods such as mathematical programming and graph theory can’t solve. Heuristic procedure is effective to solve the problem, with a variety of intelligent optimization algorithms such as simulated annealing, tabu search, and genetic algorithm (GA). GA is a swarm intelligence optimization algorithm and is robust in parallel searching. Therefore, GA is selected to solve the model. 3.1 Design of encoding Code design is a necessary process to transform field problems into the information that GA can identify, and the encoding form of chromosome is an important factor affecting algorithm performance and search efficiency. The objective is to select a kind of layout that FCMs are balanced distribution in the workshop. Therefore an encoding design based on machines is adopted. In the proposed encoding approach, machine numbers are encode as genes in the chromosome. The code is consecutive numbers with their order representing the actual layout of machine. The length of chromosome equals the number of machine in the workshop and the position of genes in the chromosome presents the position of machines in the workshop. The value of each gene indicates the machine number. Each chromosome is a sequence of machines numbers and it presents a layout scheme of machines. The coding method ensures one chromosome can be decoded as one layout schema. Sixteen machines are considered as an example to illustrate the problem of chromosome encoding in Fig.3. Gene location represents the actual position of machines in the workshop and chromosome represents the sort order of machines. For example, the position number of machine 4 is 1; the position number of machine 1 is 2, and so on. Fig.3 Coding design of GA 3.2 Elitist selection strategy and excellent genes pool The elitist strategy can significantly improve the convergence of GA and avoid losing the optimal solution obtained in the course of evolution. But if only the elite individuals are selected in each generation evolution, GA may be precocious or fall into local optimal solution. Therefore an improved elitist strategy was proposed to ensure the diversity of the species. The main idea excellent genes pool is that the number of elite individuals will be restricted when selecting the next generation population. But if the number of individuals that satisfy the condition to generate the next population can’t reach the population size, an excellent genes pool will be used to supplement the lost individuals. As can be seen from Fig.4, excellent genes pool consists of two parts: chromosomes and their evaluation values. These chromosomes are arranged in ascending order according to their evaluation values. In one population, if there is any chromosome whose evaluation value is smaller than biggest evaluation value in the excellent genes pool, and there is no same chromosome in the excellent genes pool, the chromosome should be added in the excellent genes pool. At the same time, the chromosome whose evaluation value is the biggest should be excluded. The detailed process is described as follows. ①Construct an excellent genes pool. The most excellent chromosomes in the history and their corresponding fitness value are stored in the pool. There are not two identical chromosomes in the pool. ②A new populationP′tis generated when the evolution of the old populationPtwhose size isNis completed. Then the new and old population will be combined into populationQtwhose size is 2N. ③Before the genetic iteration conduct to one third,Nindividuals that have the highest fitness value will be selected as the next population. After the genetic iteration conduct to one third, the number of individuals that have the same chromosome should be reduced when selecting individuals to the next generation. If the number of individuals of next generation is less thanN, the other individuals will be obtained to form the excellent genes pool. The selection method presented above can ensure the diversity of species and accelerate the convergence of GA. 3.3 Basic flow of GA The flowchart of GA with elitist strategy is shown in Fig.5. The basic steps of GA designed are given as follows. Fig.5 Flowchart of GA with elitist strategy Step 1 Initialize input. The inputs include the largest genetic generation, crossover probabilityc, mutation probabilitym, size of populationN, and so on. Step 2 Generate the initial population. The initial population is generated randomly, which can avoid that GA converges prematurely and gets a local optimal solution. Step 3 Calculate the fitness of individuals in the population, and construct an excellent genes pool. According to Eq.(2), the fitness of individuals can be calculated. The excellent genes pool is a set of chromosomes. These chromosomes are selected from the most outstanding individuals in all the generations. In the excellent genes pool, there are not duplicate chromosomes so that the population diversity can be guaranteed. The use of excellent genes pool can increase diversity of the species and avoid a local optimal solution. Step 4 Crossover operator. The main idea of crossover operator is that offspring obtains some genes from one parent in the same chromosome position with a certain probability. In Fig.6 in the first row, the sign “1” and “0” are generated with crossover probability. The sign “1” indicates that offspring obtains genes in corresponding position from parent 1, and the sign “0” indicates the other genes can be obtained from parent 2. One more offspring can be obtained through exchanging the operation sequence of parent 1 and parent 2. Fig.6 Crossover operator Step 5 Mutation operator. When offspring mutates, two genes will be selected randomly from one chromosome and exchange their position in the chromosome. For example, in Fig.7, gene 4 and gene 5 are selected as genes to mutate and they exchange their position in the chromosome. Then, the parent populationPtand the offspring populationP′tare put together and a new populationQtwhose size is 2Nis formed. Fig.7 Mutation operator Step 6 Selection operator.Nbest individuals without duplication are selected formQtas the parent population. If the number is less thanN, the inadequate individuals will be supplemented form the excellent genes pool. At the same time, if there is any chromosome whose fitness is better than any chromosome in the excellent genes pool and it’s different from any chromosome in the excellent genes pool, the chromosome will be put in the excellent genes pool. The worst chromosome will also be removed from the excellent genes pool. Step 7 Determine whether the termination condition is satisfied. If the number of iterations reaches the maximum genetic iteration numberGmax, the iteration can be stopped and goes to step 8, otherwise it goes to step 4 for the next iteration. Step 8 Decoding and output the optimal layout schema. In order to test the validity of the algorithm, the GA with elitist is coded in Matlab 7.0 on a computer with 4.0 GB Ram and Intel Core i5 Duo 3.1 GHz processor. In the case of simulation, there are 48 machines, where there are six machines in the traverse and eight machines in the longitudinal. A total of 12 types of FCMs are distributed in the workshop as presented in Tab.2, where the sign “1” indicates there is a FCM and the sign “0” indicates there is not a FCM. The weights of FCMs are also given in Tab.3. Other input parameters are set as follows: the maximum genetic generations is 1 000, the number of individuals in one population is 40, the crossover probability is 0.6, the mutation probability is 0.2,and initial population is generated randomly. Tab.2 Distribution of FCMs Tab.3 Weight of FCMs After running for 144.63 s and 1 000 iteration, the optimal solution was put out as shown in Fig.8. The optimal evaluation value declined from 29.080 6 to 22.434 8. The absolute value reduced 6.645 8 while is about 22.85% of the initial optimal evaluation value. It’s a satisfactory result. Fig.8 Optimal layout of machines Fig.9 Convergence curve of GA From Fig.9, the fitness function value decreased quickly and GA reached the optimal value after 600 generation. After the completion of machines layout, process routes should be arranged. For example, the process routes of six part families (PFs) which are presented by FCMs are listed in Fig.10. According to machines layout that was optimized by GA, several feasible machining cells can be formed to process one PF and that can be seen form Fig.11. The direction of polylines indicates the process order of PFs. Solid circles indicate that PF will be processed in corresponding machines and hollow circles indicate that PF won’t be processed in corresponding machines although process routes pass through these machines. If these PFs are required to process in the workshop simultaneously, six machining cells should be selected to form a feasible machining scheme. A machining scheme that has the shortest material handling distance is given in Fig.12. Based on the method, there are many feasible machining schemes for manager to select, which mainly depend on the production environments. Fig.10 FCMs of six PFs Fig.11 Processes of PFs Fig.12 Formation of configuration RMS can enhance the competitiveness of enterprises in the rapidly changing global market. For the reconfiguration of shop floor, balanced distribution of functional characteristics for machines based on GA was raised. Firstly, FCM was defined and a strategy to evaluate workshop layout was given. Then, the idea of using GA was proposed to solve this problem. The encoding and decoding, crossover operator, mutation operator and select operator were designed in detail. To measure the effectiveness of GA with elitist selection strategy and excellent genes pool, a simulation case study was given. There are 40 individuals in one population and 48 genes in every chromosome. The simulation result was obtained in acceptable time range. Then, the processing routes of six PFs were studied based on the balanced distribution of functional characteristics for machines. The result shows that satisfactory processing routes can be designed in one workshop with the solution of GA. That shows the algorithm can effectively solve the problem of balanced distribution of functional characteristics for machines. As perspective for future work, the optimal selection of processing route will be the most important work to do next. [1] Koren Y, Heisel U, Moriwaki T, et al. Reconfigu- rable manufacturing system [J]. CIRP Annals Manufacturing Technology, 1999, 48(2): 527-540. [2] Koren Y, Shpitalni M. Design of reconfigurable manufacturing systems[J]. Journal of Manufacturing Systems, 2010, 29(4): 130-141. [3] Maier-Speredelozzi V, Hu S J. Selecting manufacturing system configurations based on performance using AHP [J]. Transctions of NAMRI, 2002, 30:637-644. [4] Abdi M R, Labib A W. A design strategy for reconfigurable manufacturing systems (RMSs) using analytical hierarchical process (AHP): a case study [J]. International Journal of Production Research, 2010, 41(10): 2273-2299. [5] Youssef M A, ElMaraghy H A. Optimal configuration selection for reconfigurable manufacturing systems [J]. Flexible Services and Manufacturing Journal, 2007, 19(2):67-106. [6] Youssef M A, ElMaraghy H A. Availability consideration in the optimal selection of multiple aspect RMS configurations [J]. International Journal of Production Research, 2008, 46(21):5849-5882. [7] Dou Jingping, Dai Xianzhong, Meng Zhengda, et al. Optimization for single-part flow-line configuration of reconfigurable manufacturing system based on graph theory [J]. Computer Integrated Manufacturing System, 2010, 16(1):81-89. (in Chinese) [8] Kumar M S, Islam M N, Lenin N, et al. A simple heuristic for linear sequencing of machines in layout design [J]. International Journal of Production Research, 2011, 49(22): 6749-6768. [9] Jaramillo J R, McKendall A R. Metaheuristics for the integrated machine allocation and layout problem [J]. International Journal of Operational Research, 2010, 7(1):74-89. [10] Baykasoglu A. Capability-based distributed layout approach for virtual manufacturing cells [J]. International Journal of Production Research, 2003, 41(11): 2597-2618. (Edited by Cai Jianying) 10.15918/j.jbit1004-0579.201524.0108 TP 391 Document code: A Article ID: 1004- 0579(2015)01- 0049- 09 Received 2013-10- 02 Supported by the National Natural Science Foundation of China(51105039) E-mail: wangguoxin@bit.edu.cn3 GA-based design of balanced distribution for FCM


4 Experimental results and analysis


5 Conclusion
杂志排行
Journal of Beijing Institute of Technology的其它文章
- Investigation of the optimum differential gear ratio for real driving cycles by experiment design and genetic algorithm
- Effect of juglone on immunity response and oxidative stress in mice
- Tracking algorithm of BPSK signal in low bit SNR and high dynamic scenarios
- Birkhoff symmetry and Lagrange symmetry
- Preparation of polyimide/LDH nanocomposites and characterization of their properties
- New scheme of dynamic traitor tracing against the immediate rebroadcast attack
