A case study of the Tangjiashan landslide dam-break*
2015-04-20WANGBo王波ZHANGTing张挺ZHOUQin周勤WUChao伍超CHENYunliang陈云良WUPing伍平
WANG Bo (王波), ZHANG Ting (张挺), ZHOU Qin (周勤), WU Chao (伍超),CHEN Yun-liang (陈云良), WU Ping (伍平)
1. State Key Laboratory of Hydraulics and Mountain River Engineering, Sichuan University, Chengdu 610065,China, E-mail: wangbo@scu.edu.cn 2. College of Civil Engineering, Fuzhou University, Fuzhou 350116, China 3. Institute of Architecture and Civil Engineering, Xihua University, Chengdu 610039, China
Introduction
At 14:28 on 12 May, 2008, the Wenchuan was struck by an earthquake of 8.0 in magnitude. As a result,about 87 thousand human lives were lost or missing;and 34 lakes were formed by landslides. The Tangjiashan Barrier Lake, with a volume of about 2.4×10⁸m3, is the largest one, located on the Jianjiang River. There are six towns and two cities downstream of the landslide dam that are threatened by the dam breach flood. The county of Beichuan is located 3.2 km downstream, which is the worst-hit area in the earthquake. The city of Mianyang, as the second largest city of Sichuan Province, is located 65 km downstream. The potential breach of the lake poses a great threat to about 1.2×10⁶people living downstream.
Landslide dams are common occurrences.Korup[1,2]made an overview of the recent research work on the landslide dams and the geomorphic hazard assessment. Quite a number of landslide dams failed, causing major flooding and loss of lives. The largest landslide was triggered by the Kashmir earthquake in Pakistan, forming a natural dam impounding two lakes in the Karli River[3]. In Sichuan Province of China, at least 2 500 people were lost in the 1933 flood caused by the failure of the large Diexi landslide dam on the Min River[4]. In 1786, the landslide dam which was triggered by an earthquake in the Kangding-Luding area, breached ten days after the quake,resulting in catastrophic downstream flooding and 100 000 fatalities[5]. In consideration of catastrophic consequences of the dam failure, when the Tangjiashan Barrier Lake was formed, a giant disaster mitiga-tion effort started, which was undertaken by more than 1 000 soldiers with modern construction machineries.In order to prevent potential catastrophes triggered by dam break floods, a diversion channel was excavated.Meanwhile, 275 500 people were evacuated to avoid the potential damages caused by the Tangjiashan dambreak floods. In the end, no human lives were lost, although a large number of structures were documented as being destroyed as a result of this dam failure.
In addition to the damages caused by the dambreak floods, this failure provided some experience to deal with large-scale landslide dams, including a large number of field data for further studies. The landslide dam-break flow was widely studied by using experimental and numerical models. Cao et al.[6,7]studied the process of the landside dam failure in a large scale flume and proposed a two-dimensional mathematical modelling. An laboratory study of the inundation and the landslide dam-break flooding over the erodible bed in open channels was conducted by Yan et al.[8],including measurements in the transient stage and the post-flooding channel bed elevation. Wang et al.[9]developed a physical concept-based numerical simulation approach and conducted a real-time simulation of the dam breach development process for the Tangjiashan Barrier Lake. Fan et al.[10]revealed some features of the dam-breach process and the resulting flood propagation in several possible scenarios, in evaluating the severity of the threat to the Mianyang city. Comprehensive analyses of the landslide dams induced by the 2008 Wenchuan Earthquake were conducted by Fan et al.[11,12]The failure of cascade landslide dams was investigated experimentally by Cao et al.[13]and Niu et al.[14,15], involving the flood hydraulics and the scouring characteristics.
From the existing studies, it may be concluded that the mechanism of the landslide dam failure and the flood routing has been analyzed intensively. But, a rapid and accurate approach to predict the breach parameters (i.e., the breach width and the failure time)and the peak outflows for a potential breached landslide dam remains to be explored, which is very important to both engineers and planners, for predicting the influences of flooding before the dam break on local communities and surrounding areas. A number of empirical models to estimate the breach parameters and the peak outflows were proposed. However, these models remain to be fully verified before they may be applied to the landslide dam, especially, the Tangjiashan Landslide Dam.
In the first half of this paper, a description of the Tangjiashan Landslide Dambreak is presented, including the dam geometry, the hydrograph and the reservoir capacity, the diversion channel and the drainage from the lake. A comparison of numerical models with observations is carried out next, with regard to the breach parameters (i.e., the breach width and the failure time), the peak outflows and the water volumelevel curves, aiming to test the validity of these models.
1. Description of Tangjiashan Landslide Dam
During the May 12 earthquake, about 0.2437×10⁸m3of rock debris fell from Mt. Tangjiashan into the Jianjiang River, forming a landslide dam of 803 m in length along the river valley and of 611 m in width across the river valley. The elevations of the dam crest and toe, measured at the highest crest surface of the left deposit are 793.9 m and 669.6 m, and the elevations of the dam crest and toe, measured at the lowest crest surface of the right deposit are 753.0 m and 663.0 m, respectively. The toe of the right deposit is defined as the dam base and the corresponding deposit height is defined as the dam height, i.e.,=90.0m .The covered area of the dam is 0.31×10⁶m2. The reservoir, covering a water surface area of 3,550 km2, has a capacity of 3.26×10⁸m3at the potentially highest water level of 753.0 m (i.e., the elevation of the lowest crest of the right deposit).
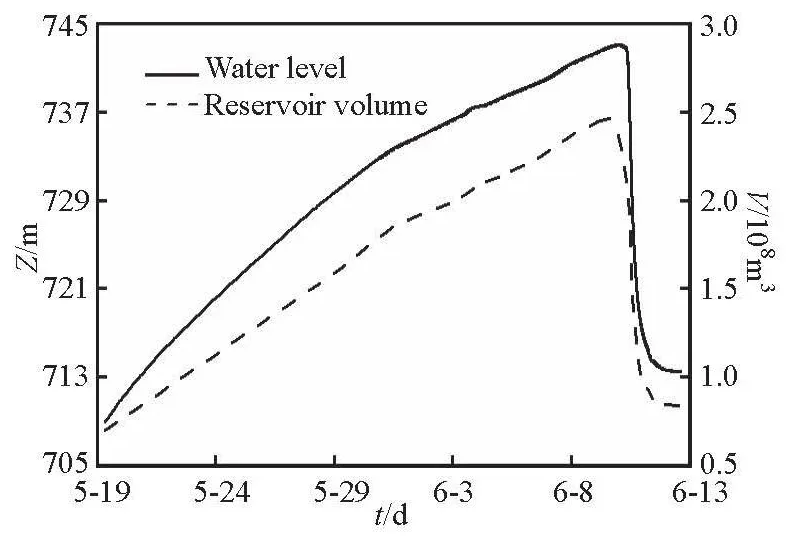
Fig.1 Time evolution of reservoir volume and water level

Fig.2 Variations of the channel bed elevation and the water level
2. Hydrograph and reservoir capacity of Tangjiashan Barrier Lake
The debris blocked up the Jianjiang River with an average slope of 0.1%, in whose upstream a lakewas formed. The average rain intensity of about 0.14 m in June is recorded historically and affects the lake volume. The average flow rate of the river during the emergency mitigation period is 80 m3/s-90 m3/s,measured from the Tangjiashan gauge station.
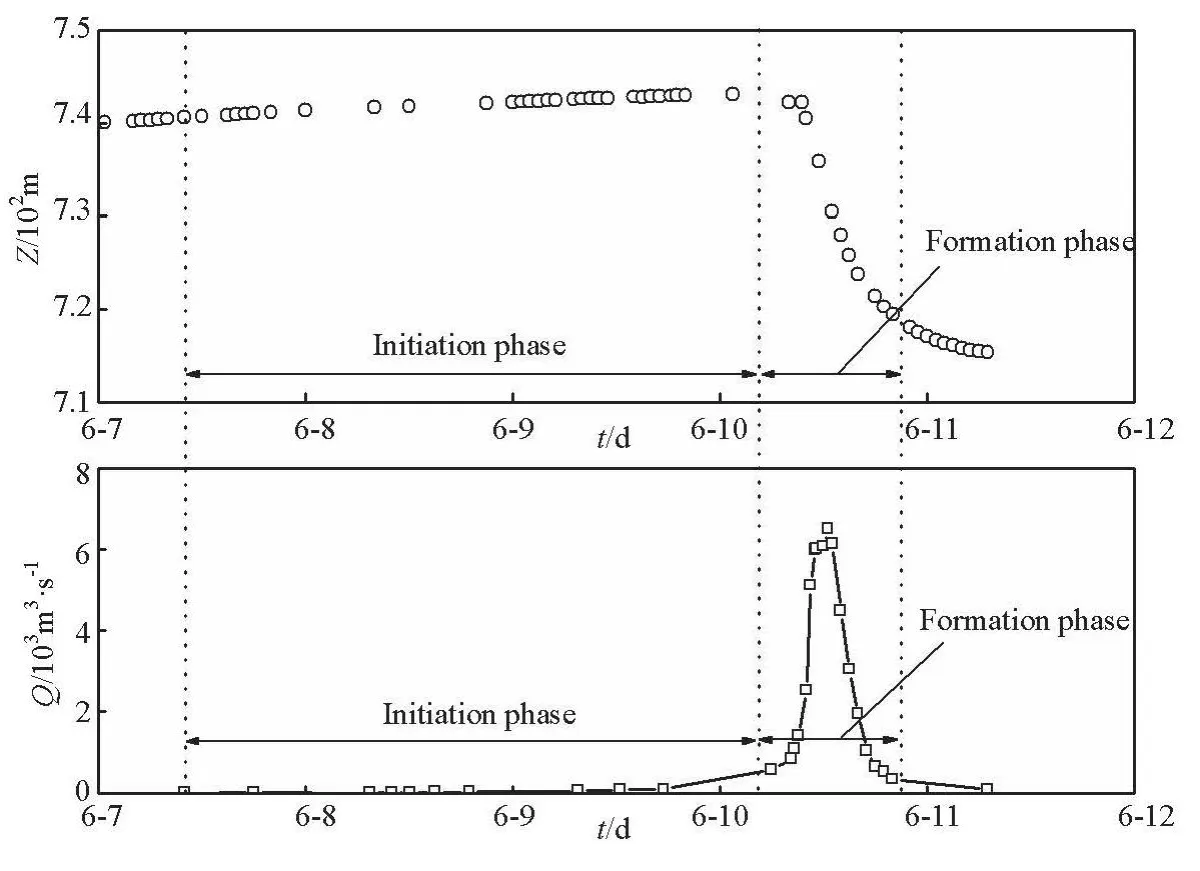
Fig.3 Time evolution of water level and discharge
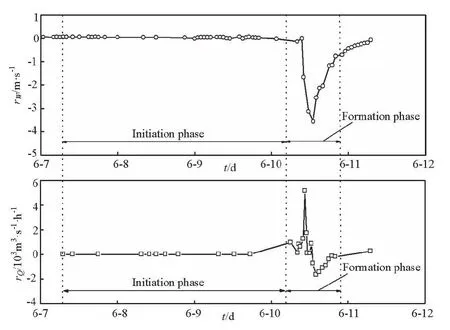
Fig.4 Rates of water level rising and discharge growing
Figure 1 shows the time evolution of the reservoir volume and the water level. The period begins at the moment when the Tangjiashan Barrier Lake was formed and ends when the water level of the reservoir substantially kept constant. The daily increase of the reservoir level is about 1.2 m in the initial time and it gradually decreases to 0.5 m due to the enlarged pool water surface area. Both the water level and the reservoir volume drop sharply on June 10 due to the primary drainage from the lake.
3. Diversion channel
A diversion channel is adopted as the engineering measure in the Tangjiashan Lake relief work. The excavation started on May 26 and ended on May 31.About 1.35×10⁵m3of rock debris is removed in all.The channel is 475.0 m long, having an inlet bed-elevation of 740.0 m with a side slope of 1:1.5 and a width of 8 m, and an outlet bed-elevation of 739.0 m with a side slope of 1:1.35 and a width of 10 m. As the highlights in the excavation, the variations of both the channel bed-elevation and the water level are shown in Fig.2. It illustrates that the inlet bed-elevation is reduced from 752.0 m to 740.0 m during about six days with an average rate of 2 m/d, meanwhile the water level rises from 725.5 m to 734.0 m. The water levelis 6 m below the inlet bed-elevation at the excavation end, and reaches the inlet bed-elevation on June 7.
4. Drainage of Tangjiashan Barrier Lake
The time evolutions of the reservoir water level and the discharge are showed in Fig.3. At 6:00 a.m. on June 7, the lake level reaches 740.3 m and the channel starts overflowing. However, no rapid flow occurs until the water level reaches 742.1 m. The erosion is initiated at 6:00 a.m. on June 10 and virtually terminated at 20:00. As a result, the elevation of the channel bed is reduced from 740.0 m to about 715 m at the entrance and the reservoir water level drops from 742.1 m to 719.5 m. The channel bed is further lowered in the following days and finally reaches an elevation of 710.0 m. After the drainage process, a new river of 145 m-235 m in width is created above the original stream bed. A peak discharge rate of 6 500 m3/s is observed at 12: 30, in excess of the 100 years flood of Beichuan County, 5 890 m3/s.
The breaching process of the Tangjiashan dam takes altogether 72 h, with the breach initiation phase starting at 6:00 a.m. on June 7 and the whole process ending at 6:00 a.m. on June 10. The breach formation phase takes 14 h, initiating at 6:00 a.m. on June 10 and ending at 20:00. The further downward erosion of the channel bed is not included in the breach formation phase because the lowering rate is very small.Thus, the breach depth should be 25 m, resulting from the difference between the initial and final elevations(740.0 m and 715.0 m) of the channel bed at the entrance during the breach formation phase.
The reservoir water level varies gently and the discharge grows slowly during the breach initiation phase (Fig.4). During the breach initiation phase, the primary water surface gets lower and the peak outflow takes place. The absolute value of the water level rising approaches the maximum when the peak discharge is reached.
5. Comparison of models with observations
The formation process and the timing of a dam breach caused by the flood overtopping can dramatically impact the outflow from a reservoir and directly impacts the hazard to life and property downstream of a breached dam. The breach development is difficult to be simulated in a physical sense, but can be idealized as a parametric process, defined by the breach shape, its final size and the failure time. Breaches are usually assumed to be trapezoidal, thus the shape and the size of the breach are defined by a base width and a side slope angle, or more simply by an average breach width[16]. The failure time is a critical parameter affecting the outflow hydrograph and the consequences of the dam failure. The peak outflow from a breached dam is a significant parameter for potential hazard classifications and emergency action plans.
The water volume stored in a reservoir is usually considered as a function of the water elevation based on the level-reservoir volume curve[17], and it is a vital index for predicting the peak outflow and also is important in the some prediction methods of the breach parameters (i.e., the breach width and the failure time).It may be used for the numerical modeling of the outflow hydrograph from a breach.
A case study is made in this paper to illustrate the applications of the breach parameters and the peak outflow prediction methods as well as the level-reservoir volume curve prediction method, making use of the data from the Tangjiashan landslide dam-break in this section.
5.1 Breach width
The Bureau of Reclamation[16]provided the guidance for selecting the ultimate breach width and the failure time. For earthen dams, the recommended breach widthis three times the breach depth,measured from the initial reservoir water level to the breach bottom elevation (usually assumed to be the streamed elevation at the toe of the dam).
The prediction equation developed by the Bureau of Reclamation is

Von Thun and Gillette[16]developed a method for estimating breach parameters, proposing the following relationship for the average breach width
Froehlich[18]used the data from 63 embankment failures to develop regression equations. The averagebreach width is predicted by

whereKois the an overtopping multiplier, which is equal to 1.4 for an overtopping failure and 1.0 for a piping failure,Vwis the volume of the water stored above the breach invert at the time of failure, i.e.,Vw=1.497×10⁸m3. Applying this equation to the Tangjiashan Barrier Lake yields an average breach width of 195.2 m, which is in the width range of the created river.
Froehlich[18]collected the data from 74 embankment dam failures using the multivariate regression analysis in a later paper to develop a mathematical expression for predicting the average breach width
wherekois a factor that accounts for the effect of the failure mode, which is 1.3 for overtopping failures and 1.0 for other failure modes.
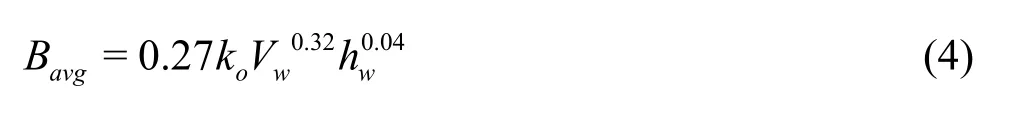
Considering that the exponent onhwin Eq.(4) is small, another equation for estimating the average breach width was proposed in a simple form as

Applying Eqs.(4) and (5) to the Tangjiashan Barrier Lake, the average breach widths of 165.5 and 186.4 m are obtained, respectively. Both estimates are smaller than the prediction of the Froehlich method and also are in the width range of the created river.
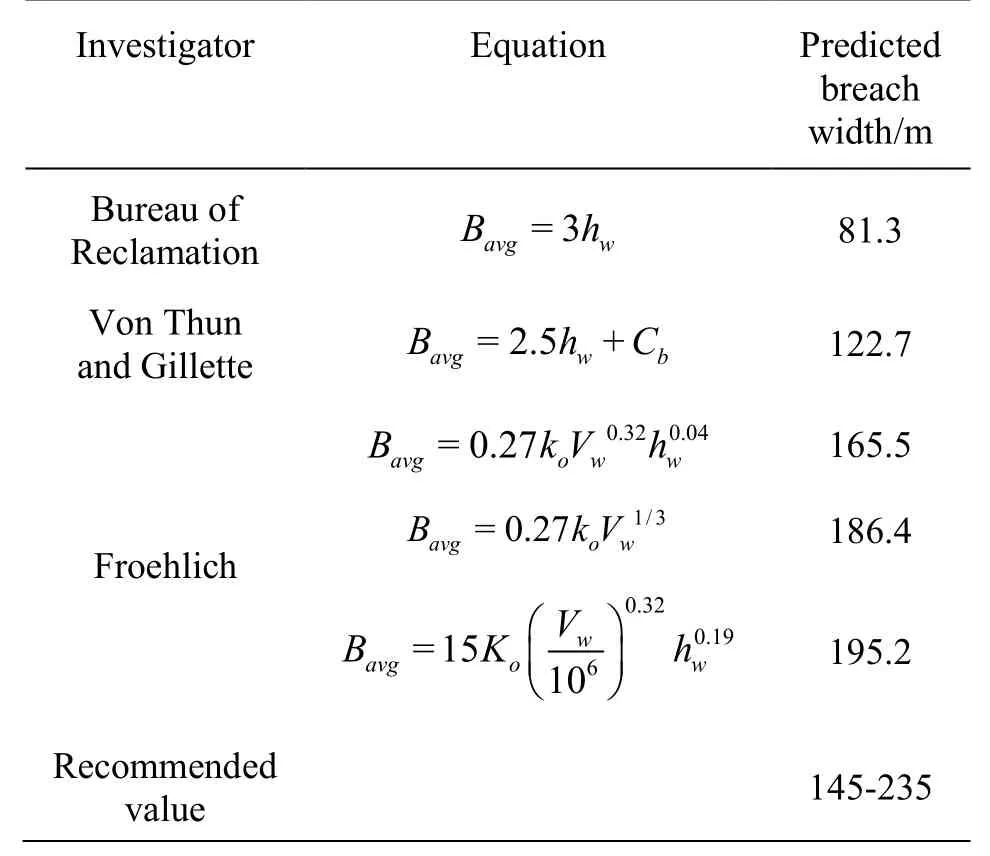
Table 1 Predictions of average breach width
All prediction equations for the average breach width are summarized in Table 1, where the results are sorted in order of increasing average breach width.The width of the created river is taken as the recommended value, shown at the bottom of Table 1.
For the application in the Tangjiashan Barrier Lake, the breach width estimate given by the Bureau of Reclamation is far from the measured data, because the prediction equation is just a function of the reservoir depth. Results from the Froehlich methods, in which the reservoir storage and the effect of failure mode are taken into consideration, are more reasonable as compared with other prediction methods.
5.2 Failure time
MacDonald and Langridge-Monopolis[16]used the data from 42 dam failures including 30 earthfill dams where breaches are formed by the erosion of the embankment material and 12 non-earthfill dams that may have failed partly due to the erosion and partly due to the sudden collapses caused by instabilities, to obtain relations of the breach development timeagainst the volume of the removed material. However, only an envelope equation estimatingfor homogenous earthfill dams was found, expressed as:
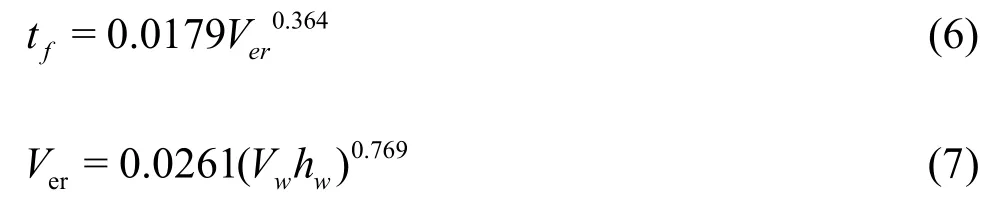
Applying these equations to the Tangjiashan Barrier Lake, a breach development time of 2.3 h is obtained.
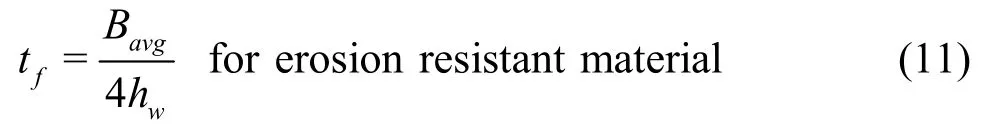
Von Thun and Gillette[16]proposed two methods for estimating the breach formation time. The upper and lower bound prediction equations for the erosion resistant and erosion prone materials were suggested based on the plots of the breach formation time versus the depth of the water above the breach
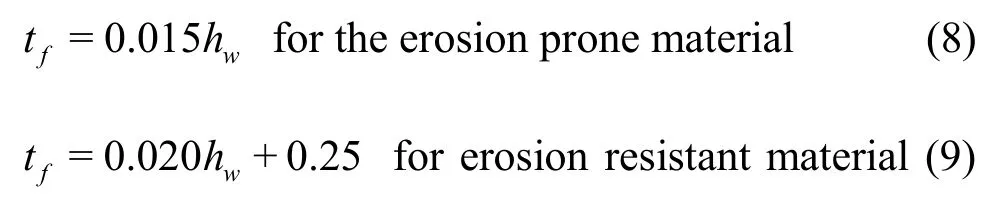
Based on the observations of the average lateral erosion rate (the ratio of the final breach width to the breach formation time) versus the depth of the water above the breach invert, two additional equations for the breach formation time were put forth by Von Thun and Gillette
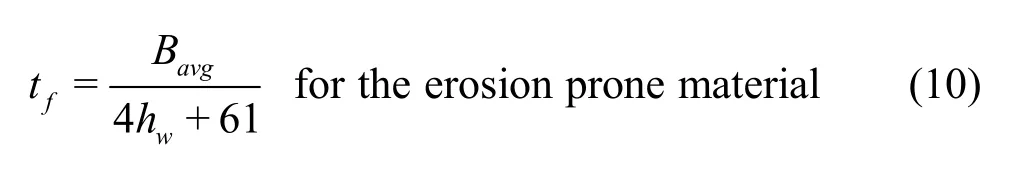
Applying Eqs.(8) and (9) to the Tangjiashan Barrier Lake yields a breach development time of 0.4 h-0.8 h. A breach development time of 0.7 h-1.1 h is obtained using Eqs.(10), (11) and (2).
The Bureau of Reclamation[16]recommended that the time for the breach to develop is 0.011 times the breach width

Applying this equation and Eq.(1) to the Tangjiashan Barrier Lake yields a 0.9 h breach development time.
Froehlich[16]found the breach formation time to be closely related to the reservoir volume and the embankment height based on the regression analysis for data from 63 embankment failures and developed the following equation
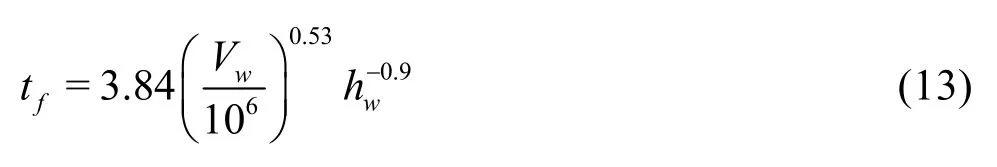
Froehlich[18]used data from 74 embankment dam failures to develop another mathematical expression for predicting the breach formation time
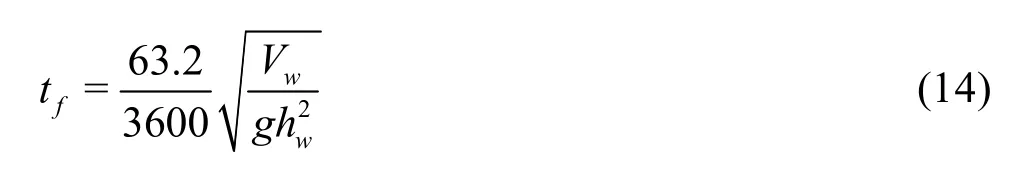
wheregis the acceleration of gravity. Applying Eqs.(13) and (14) to the Tangjiashan Barrier Lake yields a breach development time of 2.8 h and 2.5 h, respectively.
All prediction equations for the failure time are summarized in Table 2, with the results being sorted in order of increasing failure time. All prediction methods discussed herein underestimate the 14-h breach formation time of the Tangjiashan landslide dam. Explanations are as follows. Firstly, most dams involved in these prediction methods are of fills of engineering zones (i.e., earthfill in most cases and rockfill in some cases), however, the Tangjiashan landslide deposit is composed of complex materials varying from rocks mainly with its original structures to completely weathered rocks and soils with tree roots[19,20], and such material diversity leads to uncertainties in the erosion process, secondly, most dams involved in these prediction methods are man-made ones with a limited thickness, however, an 803 m length of the Tangjiashan landslide deposit along the river valley seems to contribute to the time of the breach formation.
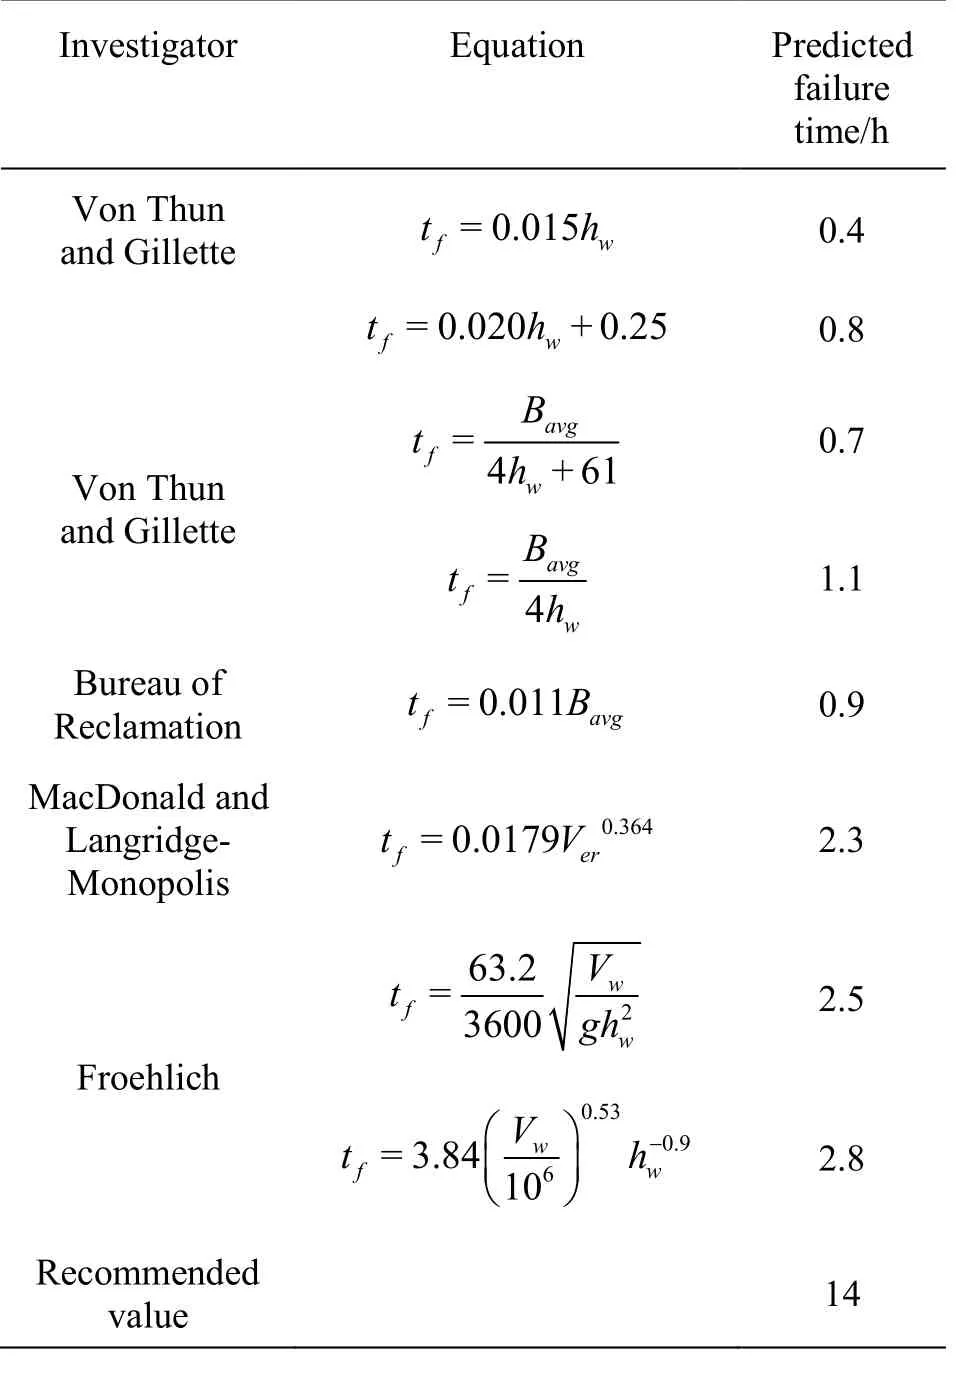
Table 2 Predictions of failure time
5.3 Prediction of peak outflow
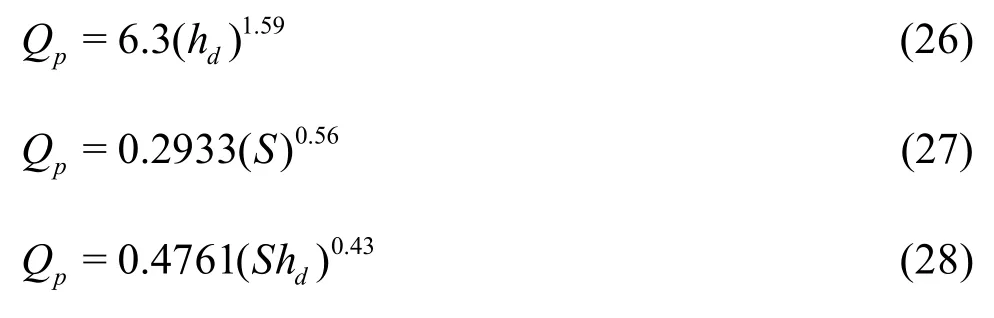
Kirkpatrick[16]presented data from 13 embankment dam failures and 6 additional hypothetical failures, and proposed a best-fit relation for the peak discharge as a function of the depth of the water behind the dam at the time of failure in the form

The soil conservation services (SCS)[16]used the 13 case studies cited by Kirkpatrick to develop a power law equation relating the peak outflow to the water depth of the dam. The prediction equations applicable to the Tangjiashan Barrier Lake, forhw<31.4 m, are
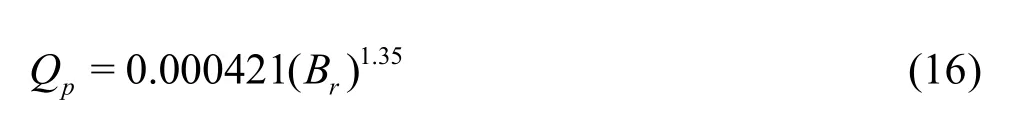
whereBris a breach factor defined as
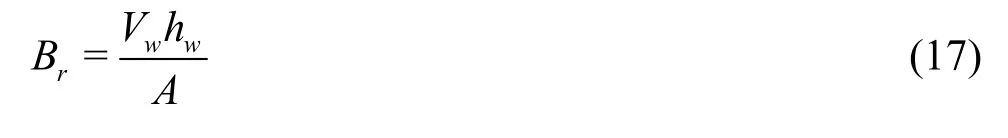
whereAis the cross-sectional area of the embankment at the location of the breach. Additionally,Qpisnot less than

and greater than
The Reclamation[16]extended the study of the SCS and proposed a similar envelope equation for the peak breach outflow using the case study data from 21 dams as

Hagen[16]developed a criterion for estimating the peak outflow based on the so-called dam factor that is the product of the dam heighthdand the reservoir storageS, serving as a crude index of the energy expenditure at the dam when the failure occurs. The prediction formula is

MacDonald and Langridge-Monopolis[16]investigated both earthfill and non-earthfill dams, and finally presented the peak outflows only from breached earthfill dams because of the limited amount of data for non-earthfill dams. The proposed relationship between the peak outflow and the product ofVwandhwis expressed by

and an envelope equation for the peak outflow is given as

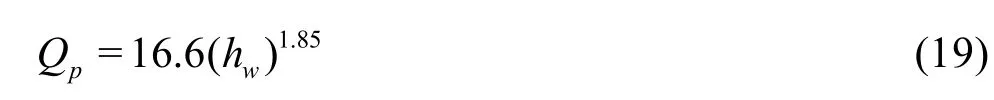
Singh and Snorrason[16]used 8 man-made dam failures for analyzing the sensitivity of the outflow peaks and the flood stages to the selection of the dam breach parameters and the simulation models. The peak outflow from the 8 dams for a particular simulation case was plotted againsthdandS, respectively.The corresponding relations are expressed as:
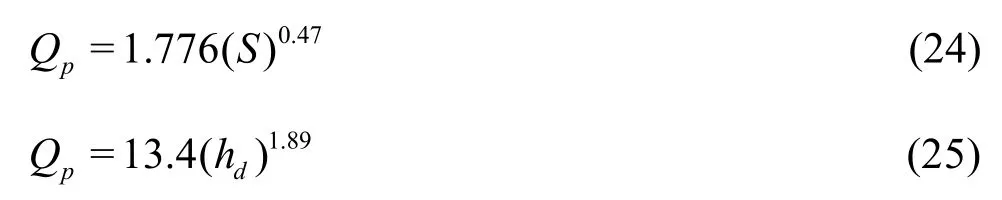
Costa[16]summarized comprehensively the information about the hydrology and geomorphology of the floods produced from the failures of all types of natural and constructed dams and presented regression equations for the peak flows from breached landslide dams as functions ofhdorSat the time of failure,or the product of these two parameter in the following forms:
Based on historical dam failures, an empirical relationship betweenQpandVwwas established by Evans[16]mainly for man-made dams, which was thought to be applicable also to the breaching of natural dams, as expressed by

Froehlich[16]assembled the peak outflows and other pertinent data from 22 embankment-dam failures to develop a best-fit regression equation for prediction of the peak discharge based onVwandhw, using the multiple regression analysis. The proposed empirical equation is expressed by

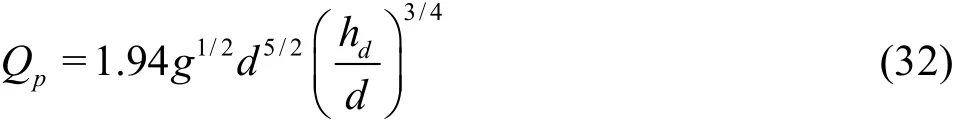
The method offered by Walder and O’Connor[16]is based upon an analysis of numerical simulations of idealized cases spanning a range of dam and reservoir configurations and erosion scenarios, and it provides a rapid prediction of the range of the peak outflow values at the breach in an earthen dam. Walder and O’Connor found that the hydrograph at the breach depends primarily on the following dimensionless parameter
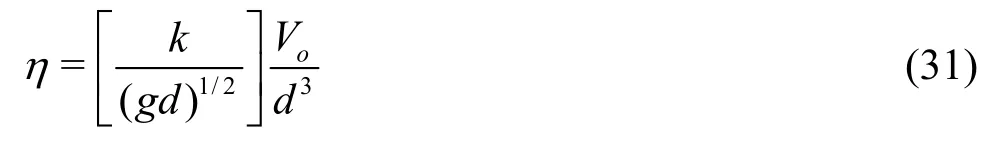
wherekis the mean vertical erosion rate of the breach,dis the drop in the lake level, andVois the total volume of the water drained from the lake.
The functional relationship between the peak outflowQpandηtakes asymptotically distinct forms depending on whether(relatively slow breach formation or small lake volume) or(relatively fast breach formation or large lake volume).
For the Tangjiashan Barrier Lake, the elevation of the channel bed is lowered from 740.0 m to 715.0 m during 14 h (beginning at 6:00 a.m. and ending at 20:00), andk=1.786m/h ,d=21.8m,andVo=1.275×10⁸m3, thusη= 1502.
The prediction equation for the peak outflow applicable to the Tangjiashan Barrier Lake, for,is
All prediction equations for the peak outflow are summarized in Table 3, with the results being sorted in order of increasing peak outflow. All methods, except the Kirkpatrick method, overestimate the peak flow of 6 500 m3/s observed to have been released from the Tangjiashan Barrier Lake. The Kirkpatrick method recommends a peak outflow prediction of 4 983 m3/s, which underestimates the observed peak flow. It can be seen that with those equations that involve only the reservoir depth above the breach invert at the time of failure, the lowest peak outflow predictions are obtained. The highest peak flows are predicted by those equations that incorporate a significant dependence onSandhd.
Table 3 Predictions of peak breach outflow
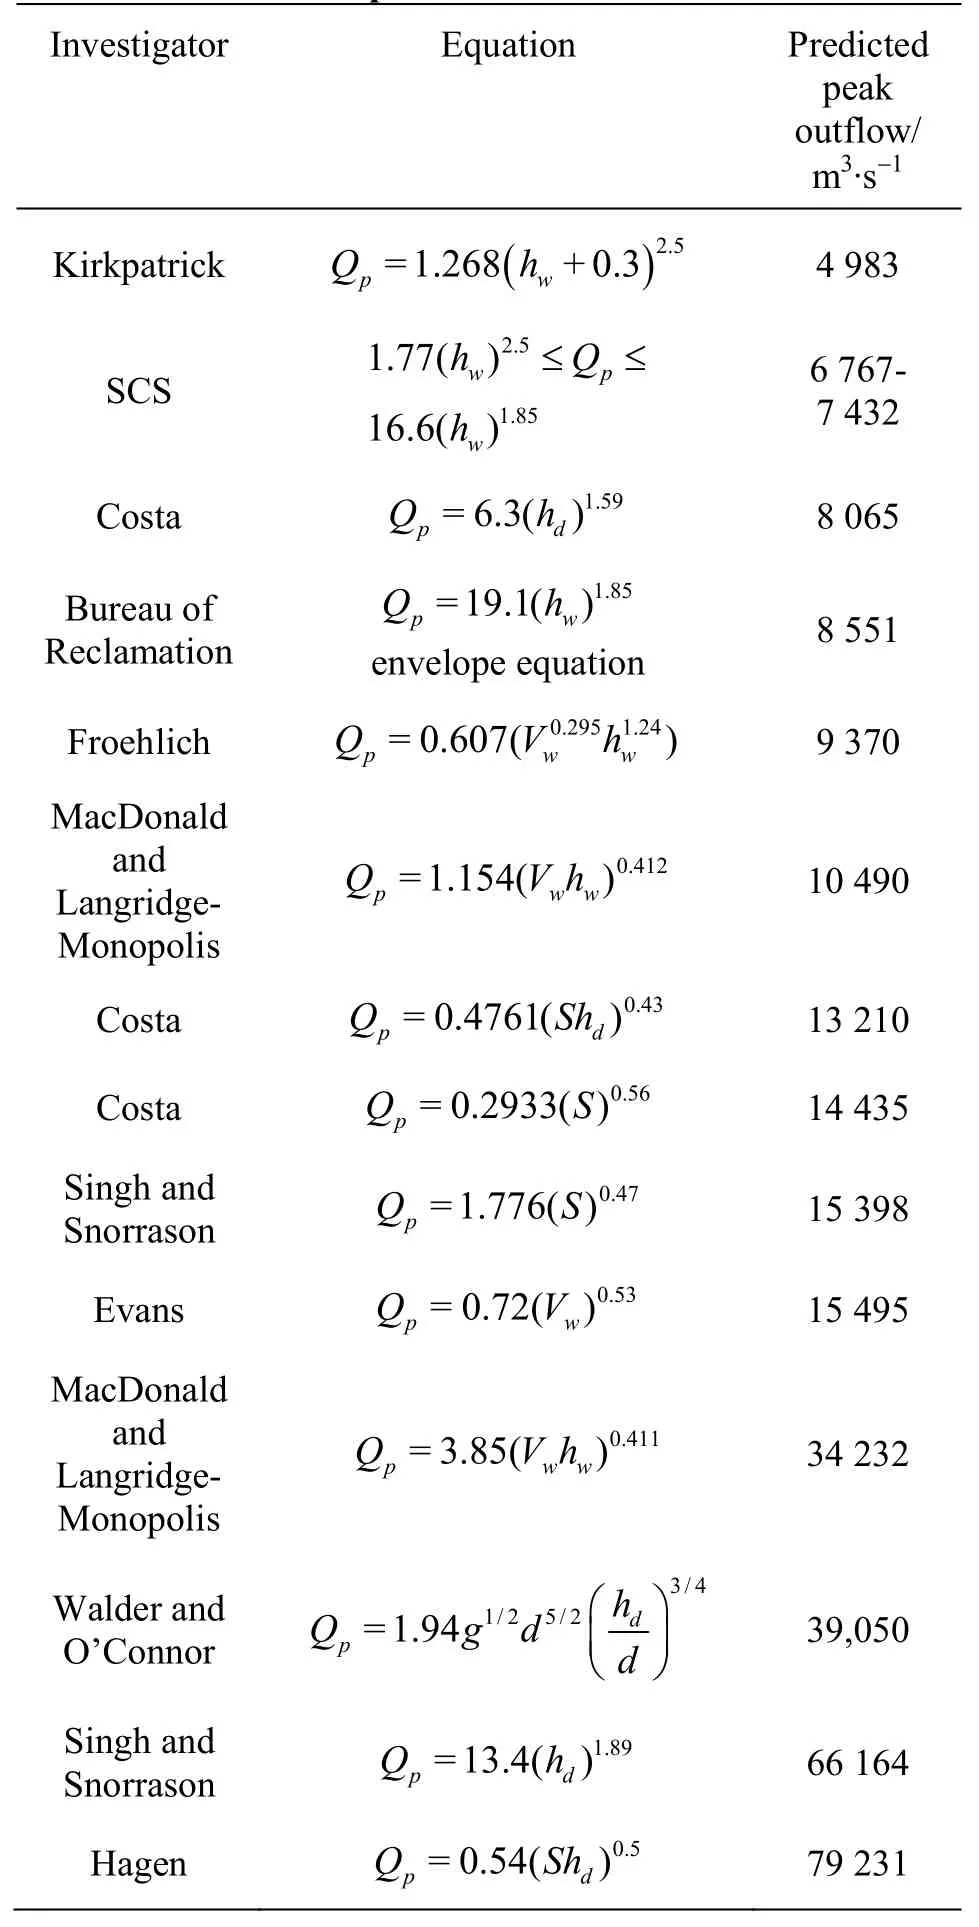
Table 3 Predictions of peak breach outflow
Investigator Equation Predicted peak outflow/m3∙s-1 Kirkpatrick ( )2.5=1.268 +0.3 Q h 4 983 p w 1.77( )h ≤Q ≤2.5 SCS w p 16.6( )h1.85 6 767-7 432 w Q h 8 065 Bureau of Reclamation Costa 1.59=6.3( )p d Q h envelope equation 8 551 p =19.1( )1.85 w Froehlich 0.2951.24=0.607( )Q V h 9 370 p w w MacDonald and Langridge-Monopolis Q Vh 10 490=1.154( )0.412 p ww Costa 0.43=0.4761( )d Qp S 14 435 Singh and Snorrason Sh 13 210 Costa 0.56=0.2933()Qp Q S 15 398 Evans 0.53=0.72( )0.47 p =1.776()Q V 15 495 p w MacDonald and Langridge-Monopolis Q Vh 34 232=3.85( )0.411 p ww Walder and O’Connor Q gd d■ ■■ ■=1.94 d 3/4 1/2 5/2■ ■ 39,050 h p Singh and Snorrason Q h 66 164 Hagen 0.5=0.54( )=13.4( )1.89 p d Q Sh 79 231 p d
The peak outflow is a function ofSorhdin the prediction equations proposed by Walder and O’Connor, Hagen, Singh and Snorrason, and Costa. In fact, the Tangjiashan landslide dam has not fully breached at the end and the volume of the water remained in the lake constitutes approximately forty percent of the total storage. Thus the peak outflows are overestimated by using these models.
For the application in the Tangjiashan Barrier Lake, the SCS method gives a peak outflow prediction from 6 767 m3/s to 7 432 m3/s. The lower bound estimate is close to the observed peak outflow. Results from the SCS method might be considered as the best estimate of the peak breach outflow.
5.4 Water volume-level curve
To take the reservoir shape into account, an expression for the relationship between the reservoir volumeVand the water levelZwith respect to the base of the dam was given by Marone[17]

in whichβis a coefficient andαvaries between 1 and 4.
Macchione[17]proposed expressions for the coefficientsβandαas follows:
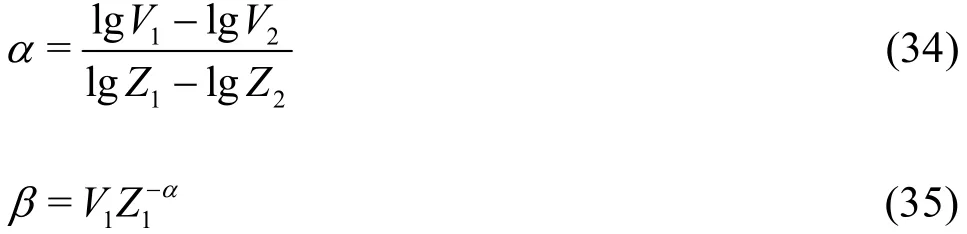
whereZ1andZ2are two water levels, andV1andV2are the corresponding volumes.
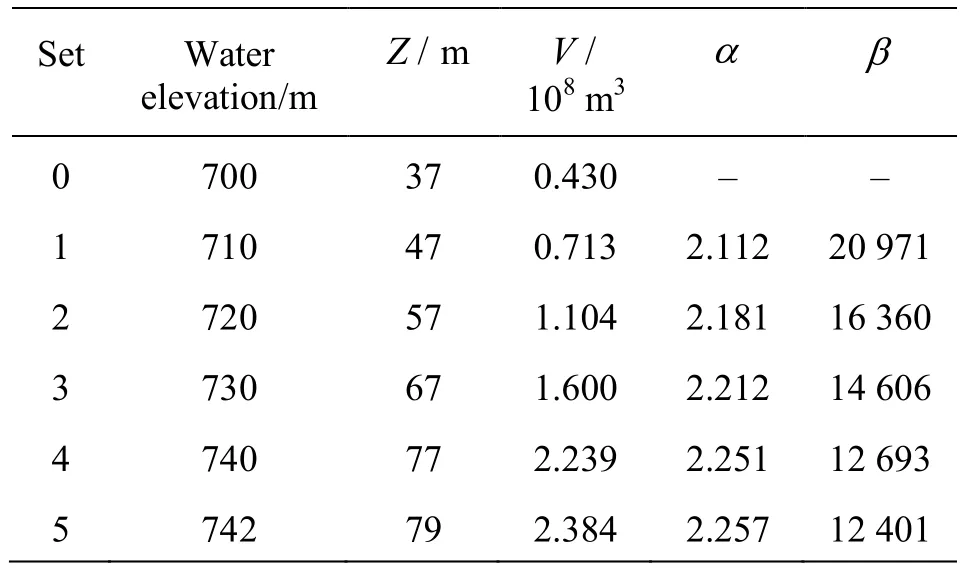
Table 4 Values of α and β for different water elevations
Z1andZ2are randomly selected, so the values ofαandβobtained from Eqs.(34) and (35) are not constant for different water levels. Herein six sets of the water levels and corresponding volumes obtainedin the field of the Tangjiashan Barrier Lake are used for obtainingαandβ, as shown in Table 4.
The first set ofZandVis taken asZ1andV1,and the rest five sets are taken asZ2andV2. Thus five sets ofαandβare obtained. The value ofαis in the range of 1-4, as suggested by Marone[17]. It increases slightly when the difference betweenZ1andZ2rises, and it is the other way round for the value ofβ.

Fig.5 Water volume-level curves
Applying these five sets ofαandβto Eq.(21),five simulated volume-level curves are generated, as shown in Fig.5, where the predicted reservoir volumes are also plotted against the observed ones. It can be seen that the relationship between the reservoir volume and the water elevation is predicted quite well, and the modeled curves get closer to the observed one when the difference betweenZ1andZ2rises.
6. Conclusions
Wenchuan in China was struck by an earthquake of magnitude of 8.0 at 14:28 on 12 May, 2008. As a result, the rock debris fell from Mt. Tangjiashan into the Jianjiang River, forming a dam, the largest among 34 dams formed by landslides. About one month later,the landslide dam with a reservoir volume of about 2.4×10⁸m3failed. Although a large number of structures were destroyed, no human lives were lost in the failure because of a giant disaster mitigation effort(i.e., excavation of a diversion channel and evacuation of 275 500 people).
A comprehensive description of this dam failure is presented in this paper, encompassing the dam geometry, the hydrograph and reservoir capacity, the diversion channel and the drainage from the lake, as well as the field data. Comparisons of results obtained by empirical methods with observations are made, and the effectiveness of these models when applied to the landslide dam is analyzed.
By the methods proposed by Froehlich which involve the reservoir storage, the breach widths can be obtained, that are in the width interval of the created river ranging from 145 m to 235 m. These modeled values are considered to be more reasonable estimates of the breach width, compared to other prediction methods.
Six empirical methods are used to predict the failure time of this dam failure. All prediction methods discussed in this paper are found to underestimate the breach formation time. Two causes for this underestimation are: (1) the Tangjiashan landslide deposit is composed of complex materials and such material diversity leads to uncertainties in the erosion process,and (2) an 803-m long Tangjiashan landslide deposit along the river valley seems to contribute to the breach formation time.
All methods discussed herein, except the Kirkpatrick method, overestimate the peak outflow observed to be released from the Tangjiashan Barrier Lake. Those methods that involve only the reservoir depth above the breach invert at the time of failure,give the lowest peak outflow predictions. The highest peak flows are predicted by those methods that incurporate a significant dependence on the reservoir stora ge and the dam height. Results from the SCS method[20]are considered to be the best estimate of the peak outflow.
The Marone method in combination with the coefficient expressions proposed by Macchione is found to describe well the reservoir volume-level curve of the Tangjiashan Barrier Lake and to provide better estimates when the difference between the known water levels in the coefficient expressions is large.
Twenty-seven prediction models regarding the breach width, the failure time and the peak outflow are listed in Table 5. There are not enough intensive studies for the failures of landslide dams. Moreover,most of the empirical models are based on historical dam failures, and the predicted results depend on the different types and numbers of failure events.
From the application of the empirical models to the Tangjiashan landslide dam, one can conclude that the methods proposed by Froehlich provide reasonable estimates of the breach width, the SCS methodgives the best estimate of the peak outflow, and a reasonable prediction of the failure time could not be obtained using the empirical methods discussed in this paper.
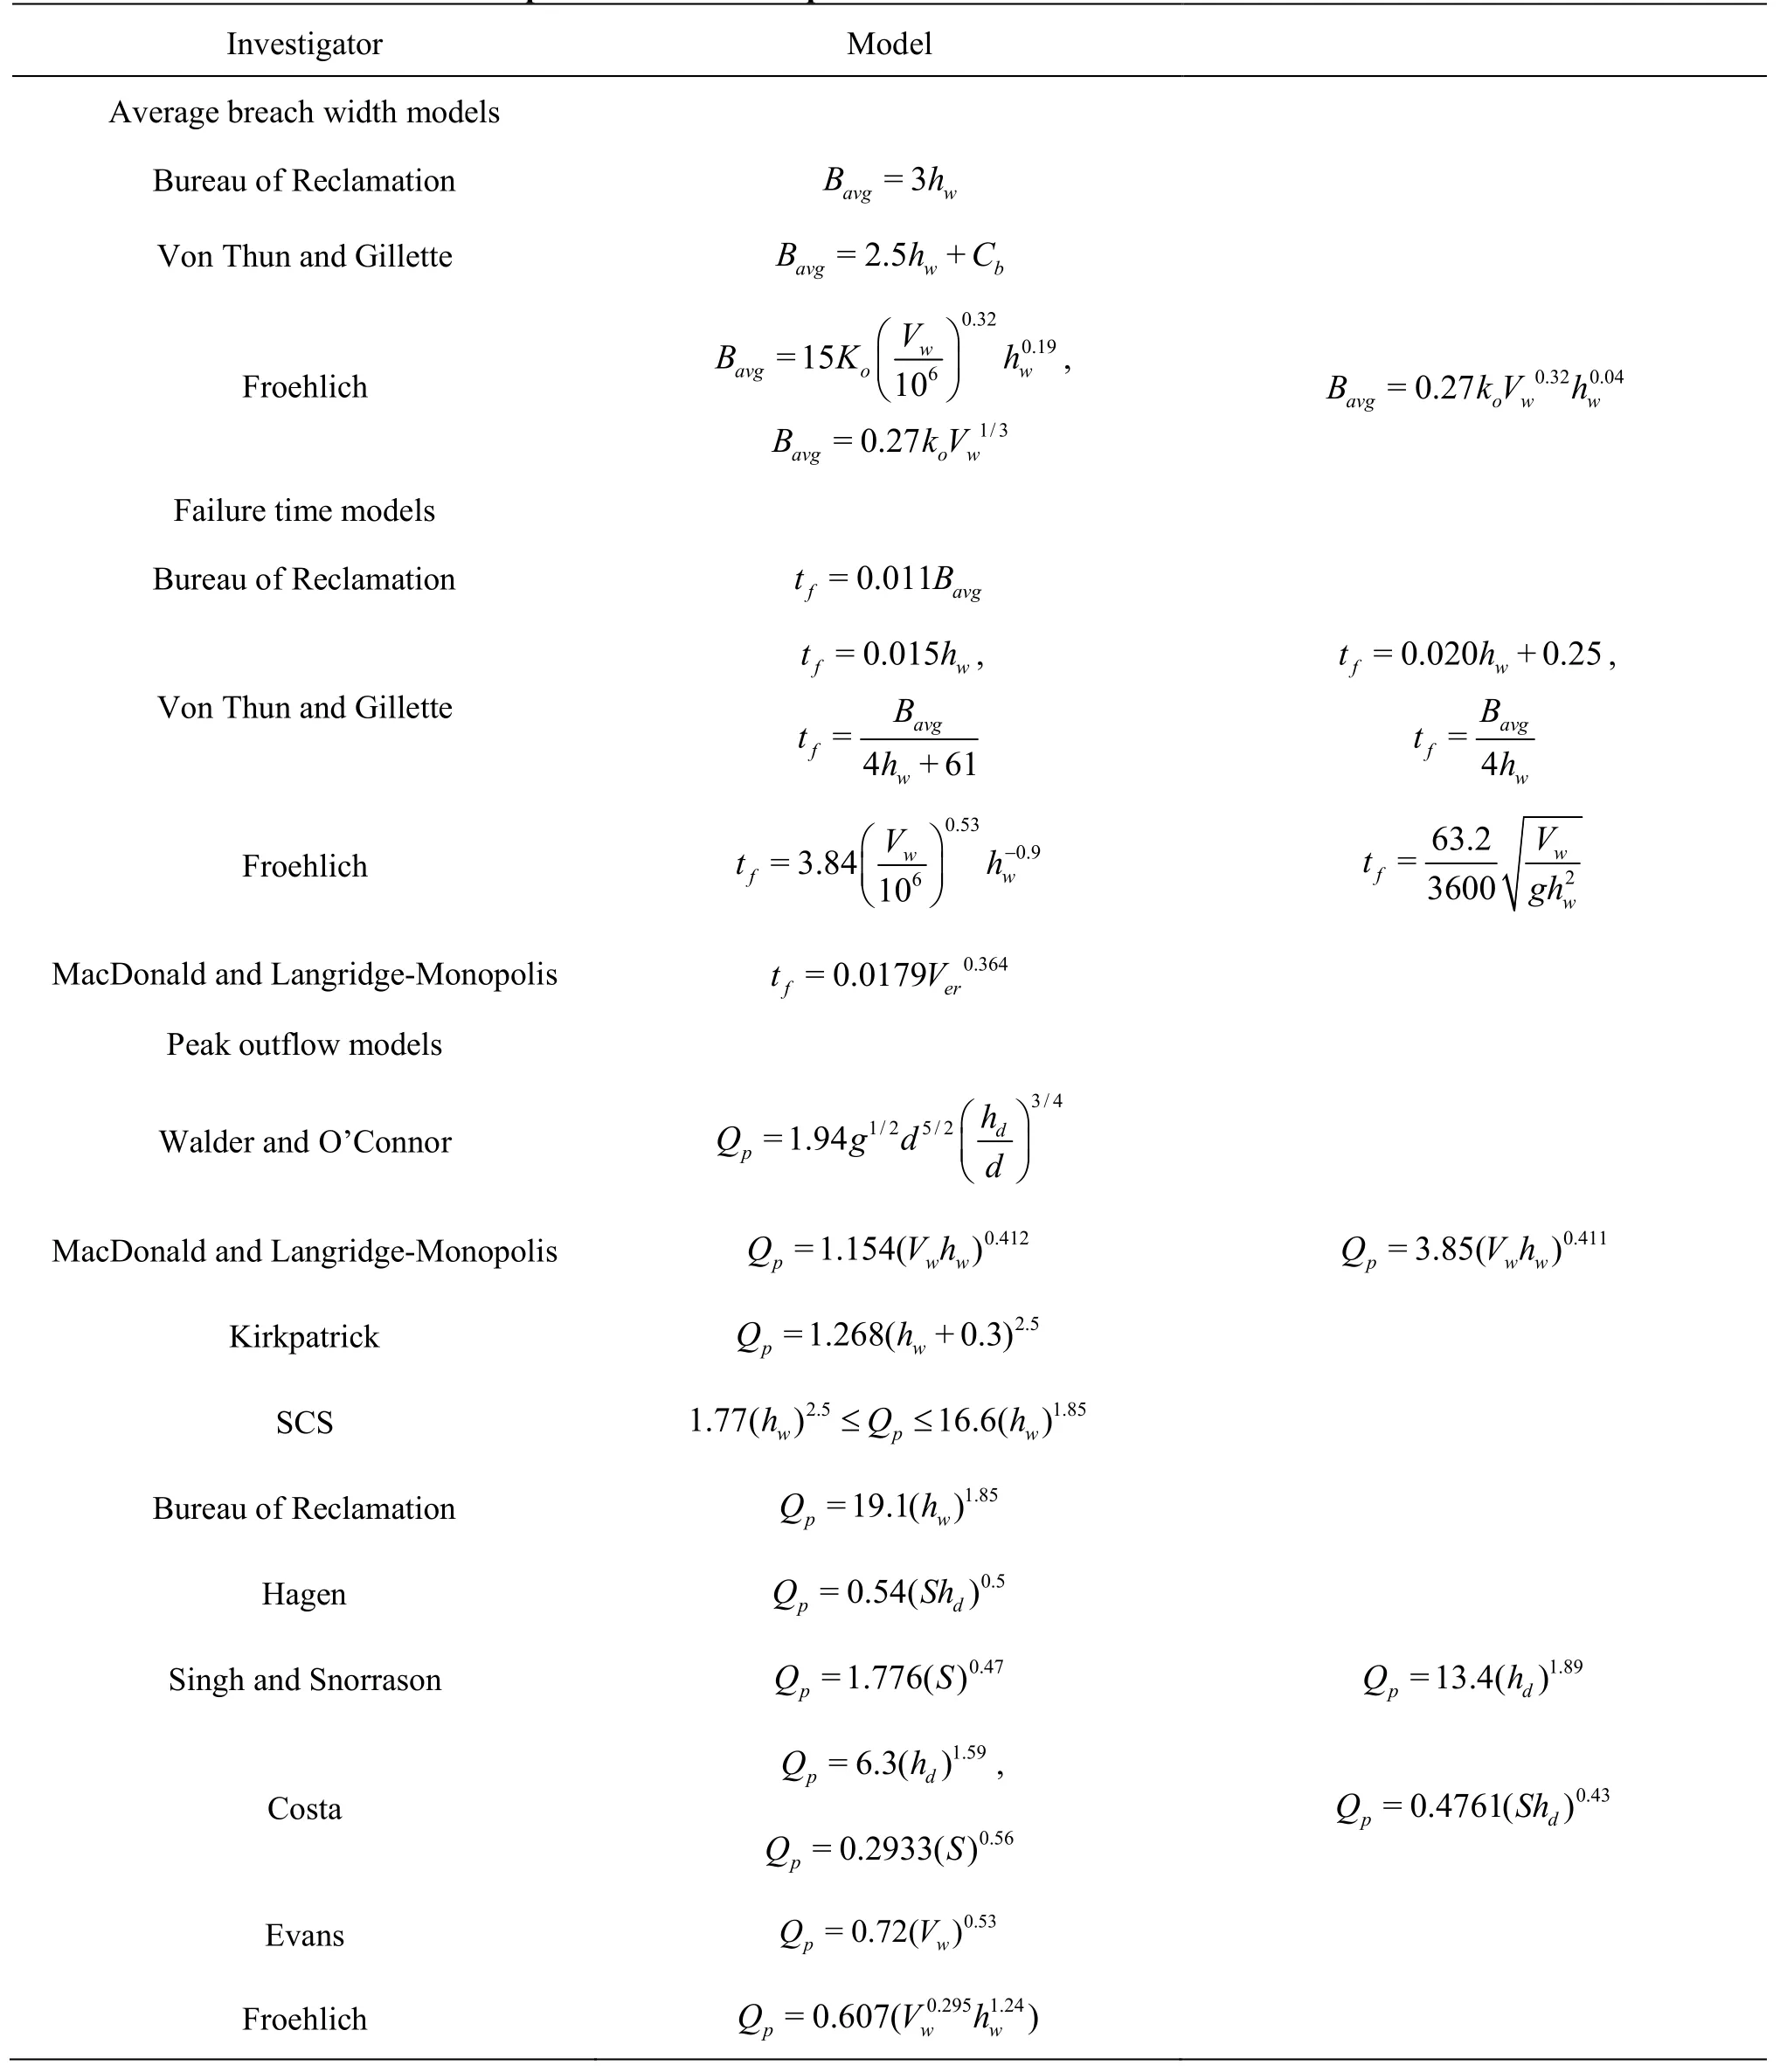
Table 5 Prediction models of breach parameters and the peak outflow
[1] KORUP O. Recent research on landslide dams‒a literature review with special attention to New Zealand[J].Progress in Physical Geography, 2002, 26(2): 206-235.
[2] KORUP O. Geomorphic hazard assessment of landslide dams in South Westland, New Zealand: Fundamental problems and approaches[J]. Geomorphology, 2005,66: 167-188.
[3] SCHNEIDER J. F. Seismically reactivated Hattian slidein Kashmir, Northern Pakistan[J]. Journal of Seismology, 2009, 13(3): 387-398.
[4] CHAI He-jun, LIU Han-chao and ZHANG Zhuo-yuan et al. The distribution, causes and effects of damming landslides in China[J]. Journal of the Chengdu Institute of Technology, 2000, 27(3): 302-307(in Chinese).
[5] DAI F., LEE C. and DENG J. et al. The 1786 earthquake-triggered landslide dam and subsequent dam-break flood on the Dadu River, southwestern China[J]. Geomorphology, 2005, 65: 205-221.
[6] CAO Z., YUE Z. and PENDER G. Landslide dam failure and flood hydraulics. Part I: Experimental investigation[J]. Natural Hazards, 2011, 59(2): 1003-1019.
[7] CAO Z., YUE Z. and PENDER G. Landslide dam failure and flood hydraulics. Part II: Coupled mathematical modelling[J]. Natural Hazards, 2011, 59(2): 1021-1045.
[8] YAN Jun, CAO Zhi-xian and LIU Huai-han et al. Experimental study of landslide dam-break flood over erodible bed in open channels[J]. Journal of Hydrodynamics, 2009, 21(1): 124-130.
[9] WANG Guang-qian, LIU Fan and FU Xu-dong et al. Simulation of dam breach development for emergency treatment of the Tangjiashan Quake Lake in China[J].Science in China Ser E: Technological Sciences, 2008,51(2): 82-94.
[10] FAN X., TANG C. and WESTEN C. J. et al. Simulating dam-breach flood scenarios of the Tangjiashan landslide dam induced by the Wenchuan earthquake[J]. Natural Hazards and Earth System Sciences, 2012, 12(10):3031-3044.
[11] FAN X., Van WESTEN C. J. and XU Q. et al. Analysis of landslide dams induced by the 2008 Wenchuan earthquake[J]. Journal of Asian Earth Sciences, 2012, 57:25-37.
[12] FAN X., Van WESTEN C. J. and KORUP O. et al.Transient water and sediment storage of the decaying landslide dams induced by the 2008 Wenchuan earthquake, China[J]. Geomorphology, 2012, 171-172: 58-68.
[13] CAO Z., YUE Z. and PENDER G. Flood hydraulics due to cascade landslide dam failure[J]. Journal of Flood Risk Management, 2011, 4(2): 104-114.
[14] NIU Zhi-pan, XU Wei-lin and LI Nai-wen et al. Experimental investigation of the failure of cascade landslide dams[J]. Journal of Hydrodynamics, 2012, 24(3):430-441.
[15] NIU Zhi-pan, XU Wei-lin and ZHANG Jian-min et al.Experimental investigation of scour dam-break of landslide dam[J]. Journal of Sichuan University (Engineering Science Edition), 2009, 41(3): 90-95(in Chinese).
[16] WAHL T. L. Uncertainty of predictions of embankment dam breach parameters[J]. Journal of Hydraulic Engineering, ASCE, 2004, 130(5): 389-397.
[17] MACCHIONE F. Model for predicting floods due to earthen dam breaching. I: Formulation and evaluation[J].Journal of Hydraulic Engineering, ASCE, 2008,134(12): 1688-1696.
[18] FROEHLICH D. C. Embankment dam breach parameters and their uncertainties[J]. Journal of Hydraulic Engineering, ASCE, 2008, 134(12): 1708-1721.
[19] LIU Nin, ZHANG Jian-xin and LIN Wei et al. Draining Tangjiashan Barrier Lake after Wenchuan earthquake and the flood propagation after the dam break[J]. Science in China Ser E: Technological Sciences, 2009,52(4): 801-809(in Chinese).
[20] LIU N., CHEN Z. and ZHANG J. et al. Draining the Tangjiashan Barrier Lake[J]. Journal of Hydraulic Engineering, ASCE, 2010, 136(11): 914-923.
猜你喜欢
杂志排行

水动力学研究与进展 B辑的其它文章
- A general framework for verification and validation of large eddy simulations*
- Direct calculation method of roll damping based on three-dimensional CFD approach*
- Visualization study on fluid distribution and end effects in core flow experiments with low-field mri method*
- Large-eddy simulation of the flow past both finite and infinite circular cylinders at Re =3900*
- Safe operation of inverted siphon during ice period*
- Flow field simulation of supercritical carbon dioxide jet: Comparison and sensitivity analysis*