Reducing energy consumption optimization selection of path transmission routing algorithm in opportunistic networks①
2015-04-17WuJia
Wu Jia (吴 嘉)
(School of Software, Central South University, Changsha 410075, P.R.China)
Reducing energy consumption optimization selection of path transmission routing algorithm in opportunistic networks①
Wu Jia (吴 嘉)②
(School of Software, Central South University, Changsha 410075, P.R.China)
Opportunistic networks are random networks and do not communicate with each other among respective communication areas. This situation leads to great difficulty in message transfer. This paper proposes a reducing energy consumption optimal selection of path transmission (OSPT) routing algorithm in opportunistic networks. This algorithm designs a dynamic random network topology, creates a dynamic link, and realizes an optimized selected path. This algorithm solves a problem that nodes are unable to deliver messages for a long time in opportunistic networks. According to the simulation experiment, OSPT improves deliver ratio, and reduces energy consumption, cache time and transmission delay compared with the Epidemic Algorithm and Spray and Wait Algorithm in opportunistic networks.
opportunistic networks, routing algorithm, deliver ratio, energy consumption, transmission delay, cache time
0 Introduction
Opportunistic network[1]requires no link between the source node and the target node. The transmission of message is realized by movement and encounter of the nodes in opportunistic network. Consequently, it is very important to analyse the process of message transmission. Opportunistic networks belong to one of branches in DTN[2](delay tolerant networks).
The traditional routing algorithms[3]can only be applied within links among nodes in the network topology. Hence these routing algorithms are no longer suitable for the opportunistic networks. It is necessary to establish new routing algorithms. The current research focuses on two aspects: on one hand, the process of nodes movement since mobile nodes can form different communication areas; on the other hand, how the nodes select appropriate neighbors in the messages transmission.
This work is debated some problems with optimal path and reducing energy, and an algorithm is found to solve these problems. Section 1 is related work. Section 2 is model design. Section 3 is stimulation and analysis. And Section 4 is conclusion.
1 Related work
At present, the research of opportunistic network focuses on the routing algorithms. Existed routing algorithms can be transplanted into different areas by improvement. There are some methods adopted in opportunistic network as follows.
Grossglauser, et al.[4]suggest a Store-and-forward mechanism Epidemic Algorithm simulating the transmission mechanism of infectious diseases. The feature of this algorithm is that two nodes exchange the message that not stored by each other when two nodes meet. This method is similar to exclusive or transmission and makes both the nodes get more information. The path when the node reaches the target node and transmit message can be guaranteed to be the shortest one with much network bandwidth, buffer memory space etc. In real application however, congestion could take place in the message transmission of the network with the increase of nodes included in the transmission since the related resource in real network is limited. In the application of real situation, this method can not get good effect since the limitation of the resource.
Wang, et al.[5]suggest Spray and Wait algorithm based on the Epidemic Algorithm which consists of two phases that are Spray and Wait. In the Spray phase, the source node counts the available nodes around for message transmission first and transmits its message to the nodes around in a way of spraying. In the Wait phase, the message will be transmitted to the target node by the way of Direct Delivery to fulfill the process of transmission if no available node could be found in Spray phase. This method is a modified algorithm which improves the flood-transmission of the original Epidemic Algorithm. Nevertheless, the Spray phase may cause source nodes waste if there are a great mount of neighbor nodes which consume many spaces of the source nodes. Thus, this algorithm could cause nodes death by over spraying of the source nodes in some network with great randomness.
Burgess, et al.[6]suggest a MaxProp Algorithm based on array setting priority. The feature of this algorithm is that the transmission sequence will be determined by the settled array priority when two notes meet. This method reduces consuming of the resource and improves the efficiency of the algorithm by setting the reasonable sequence of message transmission. Leguay, et al.[7]suggest a MobySpace Algorithm. In this algorithm, nodes groups or node pairs with higher relevance form into a self-organizing transmission area to fulfill the optimal communication among nodes.
Burns, et al.[8]suggest a Context-Aware Routing Algorithm according to calculating the transmission probability of the source nodes to get the target nodes. This algorithm first gets the middle node by calculating the cyclic exchange transmission probability, then collects and groups the message to guide the middle node to transmit the message directly to the node with higher transmission probability.
According to the analysis and summary of the related work, this paper tries to discuss and demonstrate the application in opportunistic networks.
2 Model design
The mobility and randomness of nodes lead to trouble with researching in opportunistic networks. It is very important to set an appropriate condition to analyse the message transmission in opportunistic networks. The nodes involved in the message communication areas are the research objects. The nodes involved in the communication are more active and these nodes are able to transfer message for a longer time, those less active nodes are possible to loss message or be unable to deliver message since they are not involved in message transmission for a long time.
2.1 Research mode
The typical structure of opportunistic networks is a structure of connected areas consisted by random network topology. These areas are random and variable. As shown in Fig.1, in the time period T, a network is divided into several connected areas. In those areas, nodes can be communicated with each other, each area can only be transmitted messages by itself, but it does not deliver any messages to next area.
In Fig.1, in the time period T, communication area A can deliver messages to B, but C, D and E areas can not receive the messages from A. Only when nodes move outside area A, then messages can be delivered out of A. How to choose the suitable node in A area, and ensure the message can be carried to others areas is a problem.
2.2 Topology establishing
According to the research model in opportunistic networks, a sub-network can been selected to research. Fig.2 is a sub-network in opportunistic network.
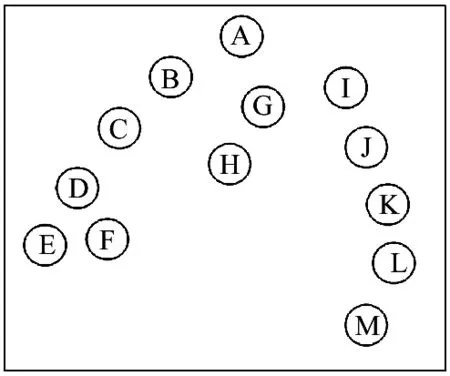
Fig.2 A sub-network of the opportunistic network
In Fig.2, there are a lot of nodes in the sub-network. Assuming in T period, node A carries message, and node’s speed is less than the speeding of message transfer, network topology remains unchanged in period T. Then node A sends the message. Which is can able of delivering the message to all nodes in the sub-network and constitutes a topology about sub-network shown in Fig.3.
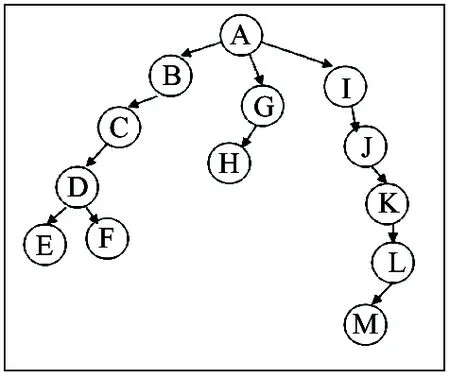
Fig.3 Message deliver topology in opportunistic networks
According to the topology in Fig.3, the process of information transmission can be determined to establish the topology of a directed graph.
2.3 Digraph establishing
The digraph, in time T, can be defined according to the topology structure.
Definition: the digraph in opportunistic network G=(V,E)
In which, V={A,B,C,D,E,F,G,H,I,J,K,L,M}
E={
According to the digraph, it can be seen the process of information transfer, determining the transmission path and selecting the path of travel. Messages via multi-hop transmission can be transmitted to the distant nodes, and communication among different areas can be ensured.
2.4 Transfer model analysis
According to analyzing digraph, nodes can find their neighbors by themselves and choose the next hop in opportunistic networks. Supposing that nodes go through the multi-hop in the network, they can carry information by sub-network. The more hops, the higher the level of activity on the path junction. Then, select a maximum number of hops the path, we can achieve the transfer message. In this case, the maximum number of hops path message becomes optimal path.
2.5 Node traversal patterns
According to analyzing digraph, in opportunistic networks, each sub-network topology is configured to traverse. Traversal method is DFS(Depth-first search) traversal. which is used to communicate nodes on the path to traverse in order to determine the optimal path.
We can define pseudo-code with the algorithm. Table 1 shows DFS algorithm analysis.
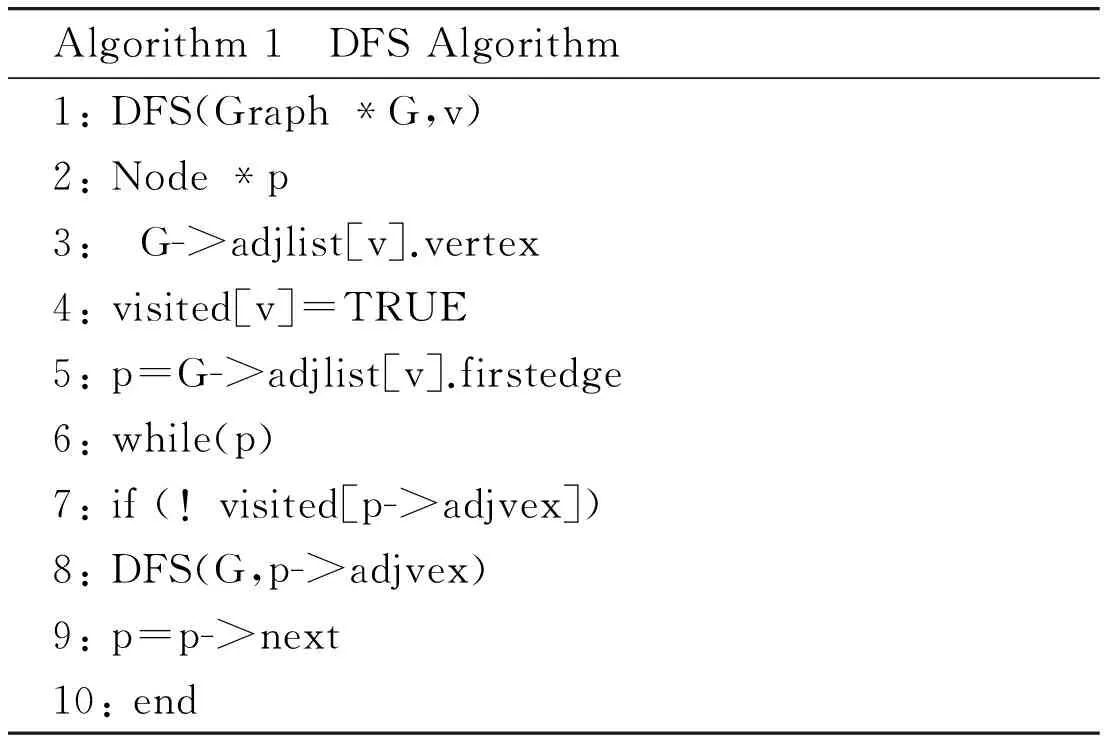
Table 1 Pseudo-code of DFS
By traversing the depth-first search algorithm, it can be found a neighbor with each node. Then information transmission can be established.
3 OSPT algorithm design
3.1 OSPT design process
According to the analysis model, messages are delivered by nodes in opportunistic networks. Therefore the algorithm can be designed and its steps are as follows:
Step 1: Message in layer i, node A (see Fig.4).
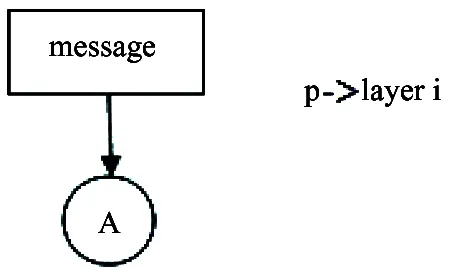
Fig.4 Message in layer i
Step 2: Judging whether node A has neighbors in layer i+1. It defines neighbors BCD.
Step 3: Pointer traversal p jumps once to layer i+1(see Fig.5).
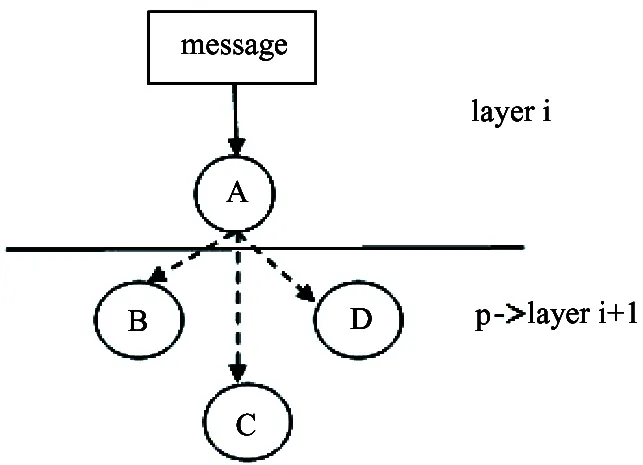
Fig.5 Message in layer i+1
Step 4: Judging whether node BCD has neighbors in layer i+2. It defines neighbors EFG.
Step 5: Pointer traversal p jumps twice to layer i+2(see Fig.6).
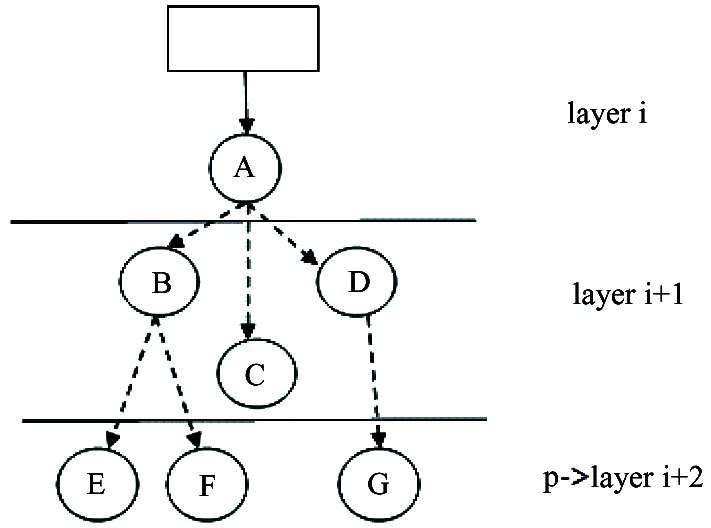
Fig.6 Message in layer i+2
Step 6: After jumping j times, pointer traversal p arrives at layer i+j and node M(see Fig.7). Then there is no neighbor.
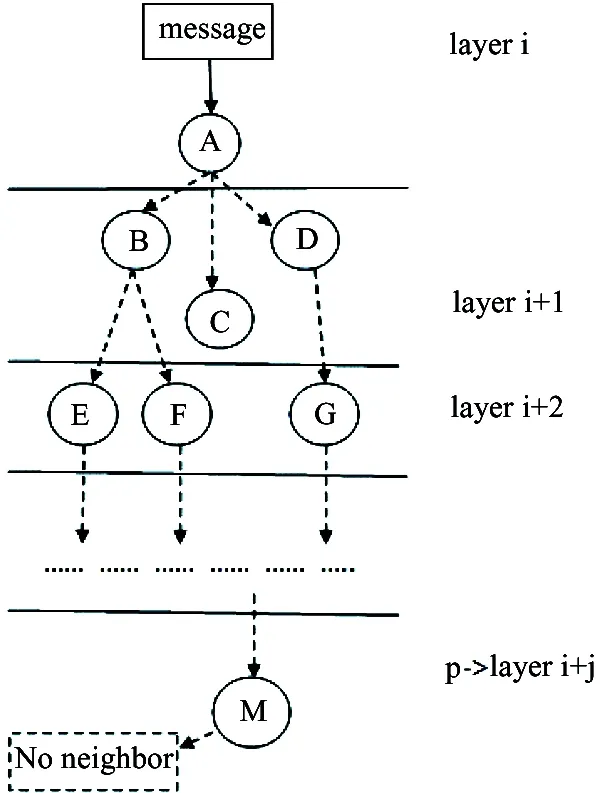
Fig.7 Message in layer i+j
Step 7: Selecting node M. Obviously the nodes on the path have higher neighbor, and level of activity, for all messages on the path most likely to be portable, so the path is set to the optimal path (see Fig.8).

Fig.8 Select optimal path
On the path, nodes deliver the messages to the next communication area. It can been ensured that the information can pass to the entire opportunistic networks. In the process of algorithm design, message delivery process is acquired. At the same time, it reduces energy consumption during transmission.
3.2 Design of OSPT routing algorithm
According to the process of design, we can design pseudo-code in Table 2. The design of OSPT routing algorithm is as Table 2:
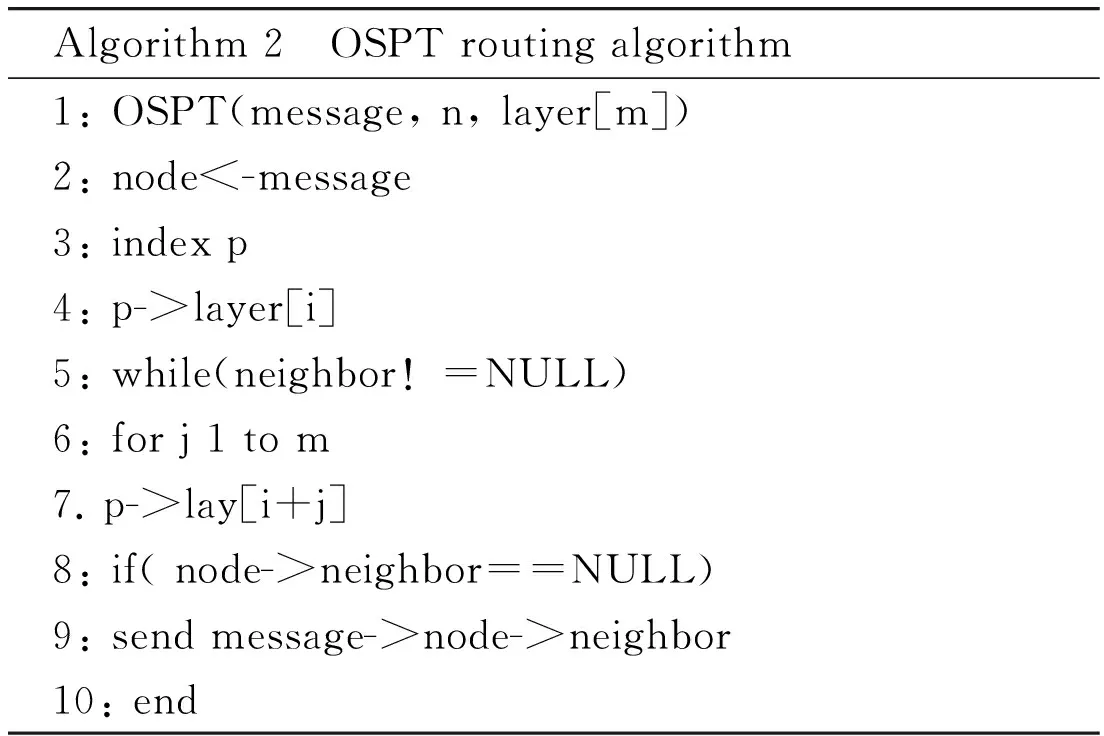
Table 2 Pseudo-code of OSPT routing algorithm
3.3 Delivery rate calculation
In opportunistic networks, r is reached at target node parameter. Concerning reached delivery ratio function is defined d(ri). These are m messages delivered by nodes. Then during the transmission, the reached nodes of message D(r) are
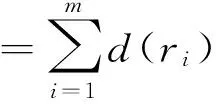
(1)
There are n nodes sending in opportunistic networks. R is parameter about delivery. Each message is delivered as d(Ri). Then the whole messages are delivered:
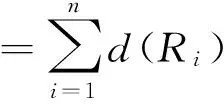
(2)
According to Eqs(1,2), the delivery ratio D is defined as
(3)
Then according Eq.(3), it is counted delivery ratio.
3.4 Energy consumption calculation
Each node sends messages, then it delivers consume energy. It is defined that energy consumption is divided to two parts. One of a part is send energy, the other is delivery energy.
There are k nodes to send message on the path; each node consumes the same energy ecto send. Then the path consumes energy Ecis
Ec=k×ec
(4)
If there are m paths taken part in sending messages, each road may have p nodes, sending messages consume energy Esis
Es=m×p×ec
(5)
A node needs the same energy edin delivery by itself. There are q nodes joined in delivery. Then energy consumption Edin deliver is
Ed=ed+ed+……+ed=q×ed
(6)
From Eqs(4,5), single node needs energy consumption Eais
Ea=Es+Ed=m×p×ec+q×ed
(7)
Then according to Eq.(7), it is counted energy consumption.
3.5 Cache time calculation
In opportunistic networks, cache time is taken to be the total time being used to cache nodes during the life circle of message. Supposed the cache time of a single node is ti, these are n nodes taken part in delivery. Then the cache time T is
(8)
According to Eq.(8), it is counted cache time.
4 Simulation and Analysis
4.1 Simulation environment
The performance of OSTP routing algorithm simulation and implementation can be evaluated in order to test in a real environment. Therefore, this paper used Helsinki University of Technology ONE1.4 (Opportunistic Network Environment simulator)[9]to develop tools for simulation test. The software uses different mobile models, depicting the trajectory. It can be expanded to various opportunistic networks routing algorithms, and then interactive interface can be provided to view real-time status to the nodes by the motion. This article is compared with OSTP, spray and wait and epidemic routing algorithms. Helsinki city topology is chosen as the background, in different streets, parks, shops are nearby in different streets and in different positions on the map to simulate the distribution, which is
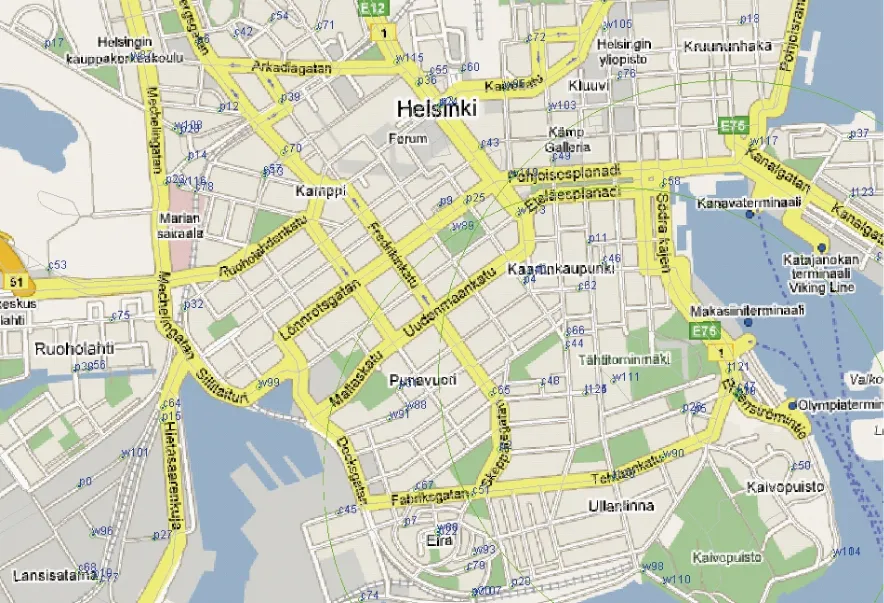
Fig.9 The map of Helsinki
more than the realistic simulation of real-life communication situations. Specifically it is shown with reference in Fig.9.
Experiment uses SPMBM (shortest path map based movement) mobile models. The model is used to calculate the shortest path algorithm Dijksatra between the source and destination. According to the map and the midpoint of the path, the mobile node is allowed moving according to the path. Table 3 is simulation parameters.
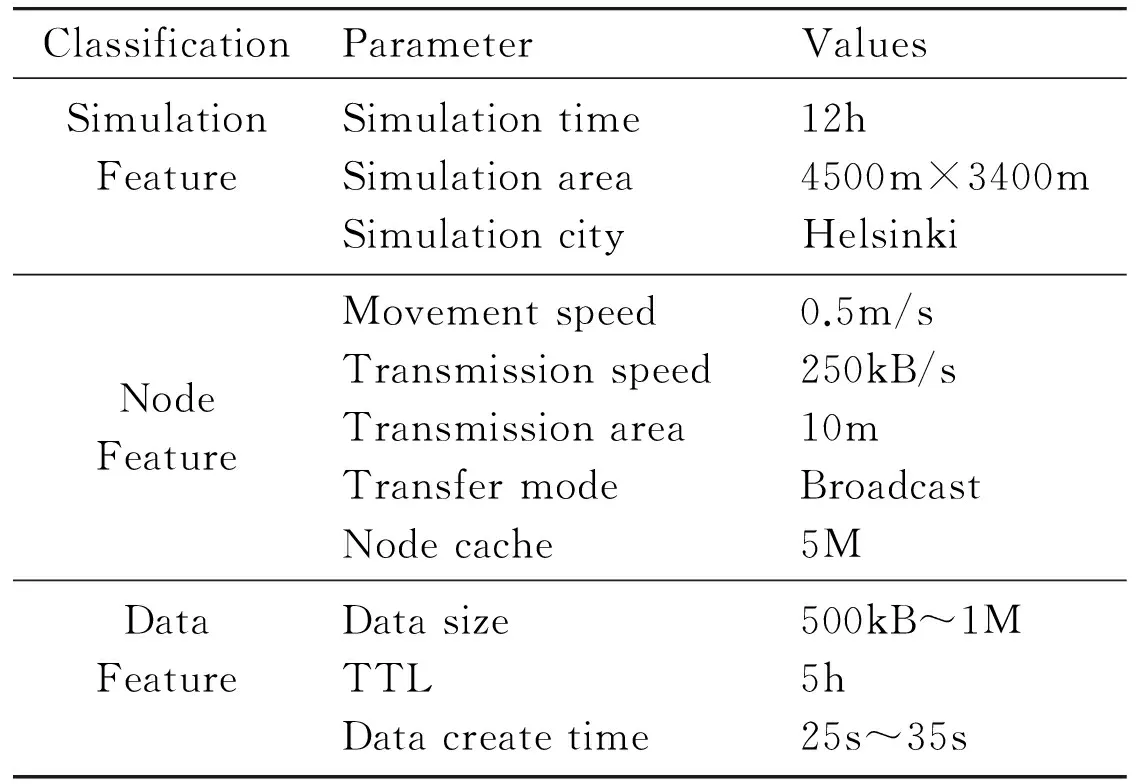
Table 3 Network simulation parameters
4.2 Parameters of performance comparison
This research focuses on the following parameters analyzed.
(1) Energy consumption: energy is consumed each time when node finishes transmitting information. More energy is consumed, the quicker the node withers away. Then information transmission in opportunistic networks will be blocked as a result of the node’s death.
(2) Delivery ratio: delivery ratio is an important indicator. It refers to the ratio of the total number of the messages that successfully reach the target nodes in a certain period of time to the number of the messages that need to be transmitted, which shows the ability of a routing algorithm to send information.
(3) Cache time: cache time is taken to be the total time being used to cache all nodes during the whole life circle of a message.
(4) Transmission delay: Time needed for the target node from the source node to arrive. The smaller propagation delay that the transmission capability of the algorithm, the stronger the higher transmission efficiency, less occupied network resources.
4.3 Analysis of simulation results
The simulation can be operated with the simulation environment and performance parameters on analysis.
Fig.10 shows delivery rate of several algorithms.
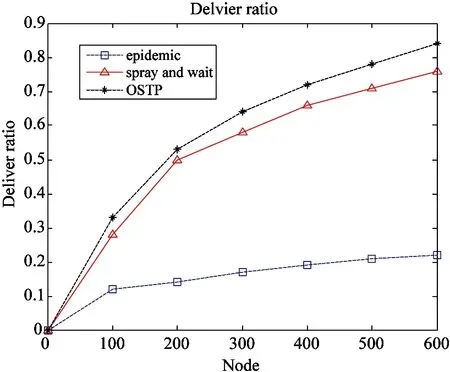
Fig.10 Deliver ratio
The abscissa represents the number of nodes, and the vertical axis indicates the transmission success rate. The number of nodes increase gradually over time when the success rate of transmission of different algorithms increases. It can been seen clearly that with the higher number of nodes increases. While Spray and Wait OSTP algorithm transmission success rate and Epidemic algorithm transmission success rate get lower. The nodes arrive at 100, the deliver ratio starts change because of nodes moving. Through experiments it can be seen the traditional epidemic algorithm will not increase the success rate of transmission nodes increased. Instead of spay and wait algorithm and OSTP algorithm after increasing transmission nodes, then messages are passing rate increased significantly. The rate of increasing is greater than spay and wait and OSTP algorithm.
Fig.11 shows the variation of several algorithms cache time.
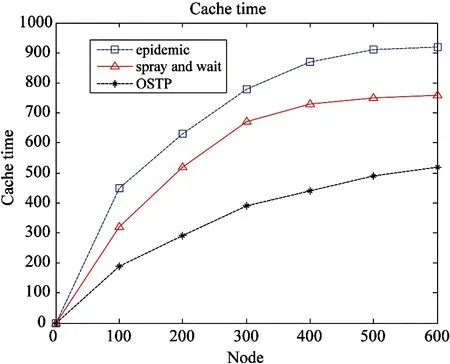
Fig.11 Cache time
Abscissa indicates the node, the vertical axis representing the cache time. It can be seen from the Figure, the node is gradually increased, and then cache time is gradually increased. The nodes arrive at 100, the cache time start change because of nodes moving. OSTP algorithm cache time reduces less than the epidemic and spay and wait algorithm. Fig.11 also shows by space OSTP algorithm consumes less than the network and spay and wait epidemic algorithm.
The abscissa represents the number of nodes, and the vertical axis indicates the energy consumption. It can be seen from the Figure, OSTP algorithm node shows low energy consumption and energy consumption
Fig.12 shows the variation of several algorithms energy consumption.
algorithm obvious trends. The result is better than spray and wait algorithm. The algorithm increases in the junction node in the process, then epidemic algorithms maximum energy consumption.
Fig.13 shows a transmission delay of several algorithms.
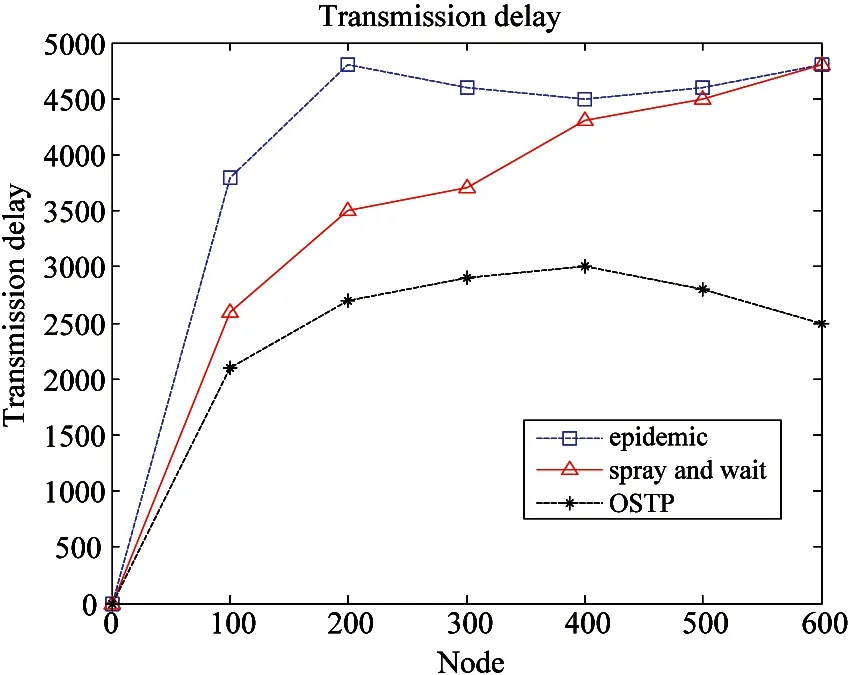
Fig.13 Transmission delay
The abscissa represents the number of nodes, and the vertical axis indicates the propagation delay. OSTP algorithm is, at beginning, the more nodes increased, the higher transmission delay, after getting to reach 400, the node reaches the maximum propagation delay, and then as the number of nodes increases, the transmission delay starts to decrease. In epidemic algorithm and the algorithm delay spay and wait, nodes are increased and the delay is risen.
In this work, three classic mobility models are found to validate the algorithm in order to validate the performance of the algorithm OSTP. These three models are SPMBM model, RM (random walk) model and the RWP (random way point) model.
RWP and RW are kinds of random motion model while RW model is based on a simple random speed and direction of movement model and no memory of exercise. Then a mobile node’s current speed and direction of movement are completely independent of the previous speed and direction. The idealized model is one of poor performance in the simulation process. The RWP random walks model can be considered to improve the model. And then it is compared with the RW model, the main speed changes each time at the pause time. RWP model is the reflection of an entity's basic law of motion with good realistic.
Fig.14 shows in three models, when the node is gradually increased, the rate of change of transmission success OSTP. RM model transmission success rate is significantly lower than RWP and SPMBM models.
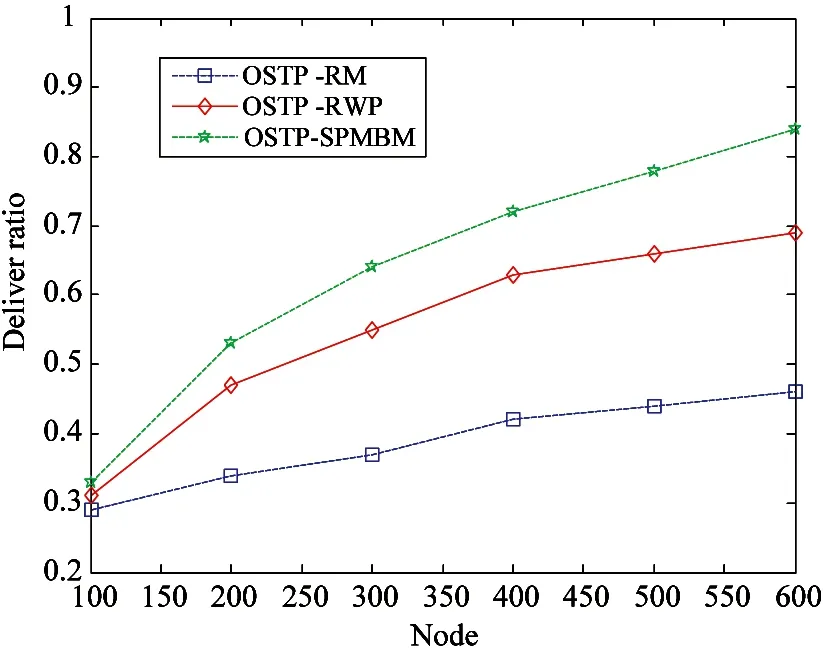
Fig.14 Deliver ratio of OSTP in different models
Fig.15 shows three models of OSTP when increasing node, cache time of the change. In SPMBM mode, cache time is less than the change in the magnitude of OSTP RM and RWP model. In the actual scene, OSTP under SPMBM mode consumes a minimum of network resources.
5 Conclusion
This research designs an OSTP algorithm and generates a model which facilitates the transmission message in opportunistic networks. In the light of simulation, algorithm is improved in deliver ratio, reduced in energy consumption, cache time and transmission delay. Compared with the epidemic algorithm and spray and wait algorithm, produced better results.
[1] Conti M, Giordano S, May M, et al. From opportunistic networks to opportunistic computing. Communications Magazine, IEEE, 2010, 48(9): 126-139
[2] Jacquet P, Mans B, Rodolakis G. Information propagation speed in mobile and delay tolerant networks. Information Theory, IEEE Transactions on, 2010, 56(10): 5001-5015
[3] Dvir A, Vasilakos A V. Backpressure-based routing protocol for DTNs. ACM SIGCOMM Computer Communication Review, 2010, 40(4): 405-406
[4] Grossglauser M, Tse DNC. Mobility increases the capacity of ad hoc wireless networks. IEEE/ACM Transactions on Networking, 2002,10(4): 477-486
[5] Wang G, Wang B, Gao Y. Dynamic spray and wait routing algorithm with quality of node in delay tolerant network. In: Proceedings of the International Conference on Communications and Mobile Computing (CMC), Shenzhen, China, 2010, 3: 452-456
[6] Burgess J, Gallagher B, Jensen D, et al. MaxProp: Routing for vehicle-based disruption-tolerant networks. In: Proceedings of the 25th IEEE International Conference on Computer Communications infocom, Barcelona, Spain, 2006, 6: 1-11
[7] Leguay J, Friedman T, Conan V. Evaluating MobySpace-based routing strategies in delay-tolerant networks. Wireless communications and mobile computing, 2007, 7(10): 1171-1182
[8] Burns B, Brock O, Levine B N. MORA routing and capacity building in disruption-tolerant networks. Ad hoc networks, 2008, 6(4): 600-620
[9] Keränen A,Ott J,Kärkkäinen T.The ONE simulator for DTN protocol evaluation. In: Proceedings of the 2nd International Conference on Simulation Tools and Techniques, New York, USA, 2009
Wu Jia, born in 1983, received his BS Degree from Gui Zhou University in China 2006, and he received his MS Degree from Yun Nan Uniersity in China 2009. He is a PhD candidate in software engineering at Central South University. He is system analyst and member of China Computer Federation (CCF). His research interests are opportunistic networks, wireless networks, software engineering, and big data research.
10.3772/j.issn.1006-6748.2015.03.012
①Supported by the National Natural Science Foundation of China (No. 61379057, 61073186, 61309001, 61379110, 61103202), Doctoral Fund of Ministry of Education of China (No. 20120162130008) and the National Basic Research Program of China (973 Program) (No. 2014CB046305).
②To whom correspondence should be addressed. E-mail: jiawu5110@163.com Received on Apr. 28, 2014, Yi Xi, Chen Zhigang
杂志排行

High Technology Letters的其它文章
- Probability density analysis of SINR in massive MIMO systems with matched filter beamformer①
- An energy-saving scheduling scheme for streaming media storage systems①
- Design and analysis on four stage SiGe HBT low noise amplifier①
- Diversity-multiplexing tradeoff of half-duplex multi-input multi-output two-way relay channel with decode-and-forward protocol①
- Edge detection of magnetic tile cracks based on wavelet①
- Probabilistic data association algorithm based on ensemble Kalman filter with observation iterated update①