SPECIALIZED RADAR DATA PROCESSING FOR THE LOCATION OF LARGE GEOLOGIC TARGETS
2015-03-28GilmanovaRybasGoroshko
G.Z.Gil'manova,O.V.Rybas,M.V.Goroshko
Kosygin Institute of Tectonics and Geophysics,Far East Branch,Russian Academy of Sciences,Khabarovsk,Russia
SPECIALIZED RADAR DATA PROCESSING FOR THE LOCATION OF LARGE GEOLOGIC TARGETS
G.Z.Gil'manova,O.V.Rybas,M.V.Goroshko
Kosygin Institute of Tectonics and Geophysics,Far East Branch,Russian Academy of Sciences,Khabarovsk,Russia
The technology of applying the scale-space theory for processing digital elevation models(DEMs)is developed to single out and analyse relief structures and to solve geologic problems.
Analysis of families of signals often involves the task of deriving their structures,i.e.frequency responses, invariants,and relationships among them[1-3].Structures, derived from the original data and presented at different scales,on the one hand,can differ significantly from each other,and on the other,can be used as mutually complementary ones allowing the most complete image of a given signal to be generated.The term“scale”should be understood in terms of accuracy of the presented data. Below follows the procedure of applying the theory to single out relief structures from DEM data.
Without going into mathematical details described in Reference[4],we consider thebasic assumptions of the theory,where the subject of study are two DEMs,i.e. SRTM03(~90 m/pixel)and Aster_DEM(30 m/pixel).

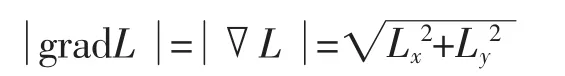
A derivative,by definition,is a rate of change of a function.A partial derivative of each of the spatial variables for the surface topography is a rate of change of elevation in corresponding directions.For brevity we write them Lxand Ly,then a vector(Lx,Ly)Tis a function gradient L(x,y;t),which indicatesthedirection of thesteepest increase in the function at each point(x,y)and whose module equals the rate of its change in this direction.Thus,a gradient describes the surface state with relation to both steepness and slope(azimuth).A gradient module is computed using the formula:

The need to use multi-scale representation is determined by the absence of universal scale for realworld objects when it would be possible to single out all elements of the structure within a single series of transformations.Most often fine-scale details appear better at small values of the smoothing scale parameter t with coarse-scale details lost.Generalization of the image smoothed surface f(x,y)resulting in a loss of detail takes place with increasing t,but there occurs a possibility to show more generalized structural components.Thus, stepwise smoothing of the image surface f(x,y)(it may be a modulus of gradient,the Laplace operator on the Gaussian surface or any other transformation)with varying degree of generalization yields a series of results which in turn can be used for further processing in analytical systems(lineaments,texture,etc.).
One of the options of presenting results is the computation of synthesized colour images.These images are no longer DEMs.They lack a vertical component.In particular,in the case of RGB-images,each of the colour channels is a space-scale representation of the original relief or its derivatives,each with its own scale parameter t.The ultimate goal is to generate a visual image of geologic or tectonic structures.
Scales are selected with linearly decreasing detailing considering the use of computer resources.In our case, the operators are:the original relief,first-(gradient modulus)and second-order(Laplace operator)derivatives, and scale parameters t=1,16 and 81.Depending on the specific research objectives,a combination of parameters(scales,operators and colours)is empirically selected, which allows geological targets to be best interpreted.
Consider the example of geologic interpretation of elements differing in shape-lineaments and concentric structures.
The Lan deep fault of the Dzhagdy mountain ridge(Fig.1)is a perfectly pronounced lineament.This ridge is an orogenic belt(part of the eastern segment of the Mongol-Okhotsk fold system)comprised of mid-and upper Paleozoic and Mesozoic volcanogenic-sedimentary rock associations.In the north,it is bordered by the Lan deep fault which separates it from the Upper Zeya and Uda depressions infilled by Cenozoic deposits as well as from Paleozoic-Mesozoic folding of the Lan ridge.Pre-Cenozoic movements along the Lan fault were transpressional thrusting with a large sinistral strike-slip component(Dzhagdy ridge shifted eastward)[4-5].
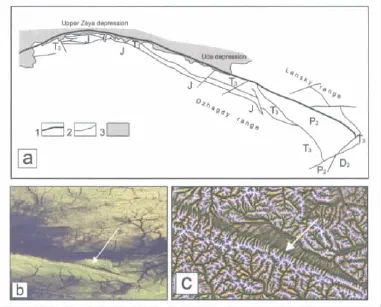
Fig.1 The Dzhagdy ridge,the eastern segment of the Mongol-Okhotsk fold system
The Lan fault is seismically active currently.The Dzhagdy ridge is thrusting along it onto the basins occurring northward.The Lan river and its right tributary and the left tributary of the Shevli river flow through a narrow tectonic valley that extends along the eastern part of the fault.Thus,the Lan fault is clearly seen on any kind of aerial and satellite survey images.Since the fault is categorized as deep,it appears as a wide zone of altered rocks,within which are common faults varying in extent and direction.The largest of them are of the same strike as the Lan fault zone as a whole.For this reason,there always would arise a question when compiling geologic mapswhere exactly the line indicating the Lan fault should bedrawn,i.e.which of the faults mapped is the main fault strand?
The selected synthesized images clearly show that in the eastern part,present-day movements cut off the piedmontalluvialplainand,apparently,thewell expressed lineament coincides with the main fault strand. In the western part of the fault,the main fault strand is overlain by loose sediments of the piedmont alluvial plain and present-day alluvium;here lineaments are well defined-valleysofsmallwatercoursesandsurface watersheds among them.Apparently they are defined by fault surfaces of rockslides along which brows of that part of the ridge that overhang the depressions are truncated as a result of its uplift,and the fallen rocks overlie the fault surface of the Lan fault.None of the structural features of the terrain are visible in the downdip(northern)block of the fault.This clearly points to the fact that it is the Dzhagdy ridge that moves while the Upper Zeya and Uda depressions are not currently experiencing subsidence.
Concentric ridges defining both intrusive bodies(often volcanic necks)and caldera of different types are perfectly visualized in the processed images(Fig.2).A good example is a concentric ridge on the Samarga right bank.It edges an almost perfectly circular(at the erosion level)outcrop of granites in the field of upper Cretaceous andesites.The ridge is undoubtedly associated with the ring fault-the central intrusion and the ring of effusions are of different ages and petrographic composition.The processed images visualize very impressive fields of Quaternary basalts hosting exhumed volcanic cones,the latter being identified in numbers significantly greater than in the course of the field work or analog image interpretation.
The developed technique was successfully employed in combination with the WinLessa program of automatic search for lineaments for the purposes of geological and structuralzoningofmajorcrustalblocks,studying structural features of the region where interact the Eurasian plate and the Amurian plates,South Sinegorye basin,Khankai massif[6],Elkon ore district,Meso-Propterozoic UchurvMaya basin,etc.
Application of the scale-space theory for DEM processing yields good results in solving problems of geologicalandstructuralzoning.Interpretationof synthesized images obtained by DEM processing allows dimensions and relationship among different geologic features to be determined much more precisely and the enhanced visibility-discrete natural elements to be linked together and a large number of homogeneousand heterogeneous geological targets to be recognized.
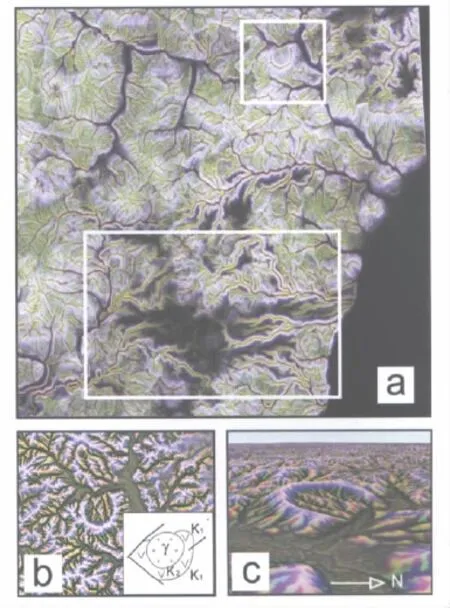
Fig.2Synthesized RGB-images
[1]Koenderink J J,van Doorn A J.Representation of local geometry in the visual system[J].Biol Cyb,1987,55:367—375.
[2]Romeny H.Front-end vision and multi-scale image analysis[M].Kluwer: Springer,2003:484.
[3]Witkin A P.Scale-space filtering[C]//Proc 8th Int Joint Conf Art Intell,1983:1019—1022.
[4]Rybas О V,Gil'manova G Z.Application of scalable space theory for the recognition and analysis of relief structures from radar data[J].Study of the Earth from Space,2011(6):45—52.(in Russian)
[5]Zabrodin V Yu,Turbin М T.The largest faults of the western Dzhagdy ridge(Far East of Russia)[J].Geotektonika,1970(3):104—114.(in Russian)
[6]Goroshko M V,Gil'manova G Z.Analysis of digital elevation models in the study of metallogeny of the South Южно-Синегорской depression of the Khankai massif[J].Vestnik DVO,2012(6):50—57.(in Russian)
应用特殊处理的雷达数据进行大型地质体划分
G.Z.Gil'manova,O.V.Rybas,M.V.Goroshko
俄罗斯科学院远东分院大地构造和地球物理研究所,俄罗斯哈巴罗夫斯克
1671-1947(2015)03-0283-04
P628
A
2014-04-30.编辑:张哲.