西北黑河中游荒漠绿洲农田作物蒸腾与土壤蒸发区分及作物耗水规律
2015-03-10赵丽雯赵文智吉喜斌
赵丽雯,赵文智,吉喜斌
中国生态系统研究网络临泽内陆河流域研究站,中国科学院内陆河流域生态水文重点实验室,中国科学院寒区旱区环境与工程研究所,兰州
730000
西北黑河中游荒漠绿洲农田作物蒸腾与土壤蒸发区分及作物耗水规律
赵丽雯,赵文智*,吉喜斌
中国生态系统研究网络临泽内陆河流域研究站,中国科学院内陆河流域生态水文重点实验室,中国科学院寒区旱区环境与工程研究所,兰州
730000
利用中国生态系统研究网络临泽内陆河流域研究站绿洲农田2009年小气候、湍流交换、土壤蒸发和叶片气孔导度等综合观测试验数据,应用Shuttleworth-Wallace(S-W)双源模型以半小时为步长估算了绿洲农田玉米生长季实际蒸散量,并利用涡动相关与微型蒸渗仪实测数据对田间蒸散发量和棵间土壤蒸发量计算结果进行了检验。结果表明:S-W模型较好地估算研究区的蒸散量,并能有效区分农田作物蒸腾和土壤蒸发;全生育期玉米共耗水640 mm,其中作物蒸腾累积量为467 mm,土壤蒸发累积量为173 mm,分别占总量的72.9%和27.1%;日时间尺度上,作物蒸腾和土壤蒸发分别在0—6.3 mm/d和0—4.3 mm/d之间变化,其日平均分别为2.9 和1.0 mm/d;田间供水充足,作物蒸腾与土壤蒸发比值明显受作物生长过程影响,播种—出苗期、出苗—拔节期、拔节—抽雄期、抽雄—灌浆期、灌浆—成熟期,其比值分别为0.04、0.8、7.0、5.2和1.4,不同阶段的比值差异主要受叶面积指数影响。
Shuttleworth-Wallace模型;作物蒸腾;土壤蒸发;耗水规律
作物蒸散发与耗水规律研究是制定节水灌溉制度和提高作物水分生产率的重要依据。目前在理论和实验方面开展了大量关于蒸散发研究,逐渐形成了水量平衡法、波文比-能量平衡法、涡动相关实测法、模型模拟等一系列成熟可靠的蒸散发研究方法[1- 7]。国内外对于上述几种方法展开了大量的研究,对于蒸散发有了较为成熟的理解,然而为了进一步研究蒸散发的机理,需对作物蒸腾和土壤蒸发进行区分。目前基于实验能够将蒸散发区分为土壤蒸发和作物蒸腾的方法主要有:直接观测和模型估算。基于实测资料区分的方法主要有植物生理学方法[8- 11]和水热平衡法[1, 12]。Yunusa等基于茎秆液流及微型蒸渗仪实测数据估算了澳大利亚干旱区葡萄园3—5月的作物蒸腾与土壤蒸发,但对于如何将茎秆液流观测值转化为田间作物蒸腾速率,并没有给出进一步科学的解释。Zeggaf等基于实测数据利用波文比能量平衡法对日本干旱区玉米生长季中典型天气下的作物蒸腾及土壤蒸发进行了区分,其方法较为合理,但是研究时间尺度较短(仅4d)。虽然直接观测方法能更精准的反映实际情况,但是耗时费力。相比而言,模型计算简单易操作。模型计算方法主要有双作物系数法(FAO- 56)[7, 13]和Shuttleworth-Wallace(S-W)双源模型[6, 14]等。Liu等使用双作物系数法估算了禹城冬小麦和夏玉米的蒸散发,但是未对作物蒸腾与土壤蒸发进行区分[15],Er-Raki等是利用双作物系数法区分了摩洛哥干旱区橄榄树的作物蒸腾与土壤蒸发[16]。相比于双作物系数法,S-W模型双源模型从动量吸收、能量和物质转化传输过程及两者相互关系角度将土壤蒸发和作物蒸腾分开,具有较清晰的物理含义[17]。David等针对科罗拉南部半干旱区稀疏植被,利用S-W双源模型估算了该植被的蒸散发[18];Odhiambo等不仅利用S-W双源模型估算了内布拉斯加州滴灌条件下大豆农田的蒸散发,而且有效区分作物蒸腾与土壤蒸发[19]。此外,大量的研究都利用S-W双源模型对不同地区作物蒸腾和土壤蒸发进行了区分[20- 23],但是这些研究对于干旱区荒漠绿洲却研究甚少。吉喜斌等基于Penman-Monteith(P-M)模型,对黑河流域中游山前绿洲农田春小麦生长季土壤蒸发、作物蒸腾及总蒸散发进行了模拟研究[24]。该研究应用SPAC水热传输理论对S-W双源模型的参数进行改进,但是由于当时实验条件限制,叶片气孔导度及土壤热通量等参数均通过计算得到,与实际值难免会产生偏差,进而影响模型的模拟精度。因此,有必要针对干旱区荒漠绿洲,对作物蒸腾与土壤蒸发区分及其耗水规律展开进一步的研究。
本研究利用中国生态系统研究网络临泽内陆河流域研究站荒漠绿洲农田2009年的小气候、土壤蒸发及叶片气孔导度等综合观测试验数据,应用S-W双源模型估算了作物蒸腾和土壤蒸发,采用涡动相关实测蒸散发数据对计算值进行了验证,得到了合理的作物蒸腾和土壤蒸发比值,探讨了不同生育期玉米耗水规律以及蒸散发对环境因子的响应。
1 研究地区与观测方法
1.1 研究区概况
实验于2009年4—9月在中国生态系统研究网络临泽内陆河流域研究站荒漠绿洲农田综合观测场进行。该观测场位于黑河中游荒漠边缘(100°08′27″E、39°19′38″N,海拔1381 m),为典型的荒漠绿洲农田,属温带干旱气候,年均气温为7.6 ℃,最高气温在7月为39.1 ℃;最低气温在1月为-27.3 ℃。年均降雨量为113.4 mm,主要集中在7—9月份,占年降雨量的56.7%—62.6%。年蒸发量为1900—2088 mm,年均日照时数3051 h,年均无霜期165 d,平均地下水位为(6.18±0.08) m。试验场位于制种公司制种区内,面积高达25 km2,内外地势平坦,种植结构相同作物分布均匀且长势一致。2009年种植大田制种玉米,生长季为4月10日—9月20日,在制种公司统筹管理下统一播种、施肥、灌溉、去父本和收获。
1.2 田间观测项目

图1 农田小气候观测系统(a)、涡动相关观测系统(b)及微型蒸渗仪(c)Fig.1 Farmland microclimate observation system (a)、Eddy covariance observation system (b) and Micro-Lysimeters (c)
(1)综合环境观测
采用站内安装的绿洲农田小气候观测系统(图1a),配有五层常规气象要素探头(包括风速(LISA, Siggelkow, 德国)、气湿与气温(HMP45D, Vaisala, 芬兰)分别安装在2、4、6、12、20 m处;总辐射、净辐射仪(Kipp & Zonen, Delft, 荷兰))均安装在地面以上4 m处;土壤温度探头(Pt100, IMKO, 德国)安装在地表0 cm和地表以下5、10、20、40、80、120 cm;土壤湿度探头TDR(TRIME-IT, IMKO, 德国)安装在地表以下5、20、60、100、200、300 cm处;土壤热通量探头(HFP01, Hukseflux, 荷兰)安装在地表以下2 cm处,均以30 min为步长输出。
(2)涡动相关观测
站内安装有涡动协方差系统(图1b),配有三维超声风速仪(HS50, Gill Instruments, 英国)、快速响应红外CO2/H2O气体分析仪(LI- 7500, LI-COR Inc., 美国);原始数据采集频率为20 Hz。
(3)土壤蒸发观测
采用微型蒸渗仪(Micro-Lysimeter)进行观测,蒸渗仪为内外双桶设计,内桶由不锈钢制成,内径为0.10 m,高0.25 m,外桶由PVC管制成,放置于制种玉米行间(图1c),顶部与大田保持一致,设置6个重复,每日8:00称重换土,使用精度为0.1 g的电子天平称重,前后两次的差值即为当天的蒸发量,取6组微型蒸发仪测量的平均值作为当天的土壤蒸发实测值。
(4)叶片气孔导度测定
利用Li- 6400便携式光合仪(LI-COR Inc., 美国)于作物出苗后每月对玉米叶片的气孔导度(Gs)进行测定,同时测得净光合速率(Pn)、蒸腾速率(Tr)等参数,测定时间从8:00到20:00,间隔1 h。
(5)其它测定项目
每隔10d随机取18个2 m×2 m的样方测量植株密度和高度,采用LI- 3100叶面积仪测定叶面积指数(LAI)。播种时采用覆膜式播种,灌溉方式为畦灌。2009年生长季中共灌溉7次,总灌溉定额为797 mm,平均灌溉定额为114 mm。
1.3 Shuttleworth-Wallace双源模型

图2 双源蒸散发模型系统水热传输示意图 Fig.2 The sketch of two-source evapotranspiration model scheme
1985年Shuttleworth和Wallace[17]研究了稀疏植被覆盖条件下土壤表面的蒸散,在P-M模型的基础上,假设作物均匀覆盖,引入植被冠层阻力和土壤表面阻力两个阻力参数,建立了由植被和植被覆盖下的土表两部分组成的双源模型。该模型通过研究与作物生理特性(气孔导度、光合作用)、作物生长环境(太阳辐射、大气温度、水汽压)以及土壤水热传输等有关的阻力系统(图2),基于能量平衡原理,将作物上方的蒸散量分解为两部分:
λE=CcPMc+CsPMs
(1)
式中,PMc为冠层潜热通量(MJ m-2d-1),PMs为冠层下部土壤潜热通量(MJ m-2d-1),分别用于计算冠层蒸腾和土壤蒸发,用参考水平面饱和水汽压差(D)表示的计算公式为:
(2)
(3)
系数Cc和Cs由下式给出:
(4)
(5)
其中:
(6)
(7)
(8)

A=Rn-G
(9)
(10)
式中,Rn和Rns分别为冠层和地面的净辐射通量(W/m2),G为土壤热通量(W/m2)。
(11)
式中,C为净辐射在植被冠层群体中的衰减系数,和叶片特征相对应由作物属性决定,变化幅度在0.3—1.5之间,根据Monsi和Saeki的经典著作中的指数公式[25]τ(L)=exp(-C(LAI))确定,τ为太阳辐射在植物群落中的穿透系数,对于农作物玉米的经验取值见表1。

表1 叶面积指数与穿透系数τ的关系表
2 结果
2.1 农田小气候特征
根据绿洲农田小气候观测系统及开路涡动相关观测系统观测数据对2009年制种玉米生长季内总辐射、净辐射、土壤热通量、温度、相对湿度及风速等小气候资料进行分析,各个环境因子的月均值如表2所示。作物生长季中净辐射基本呈先升后降的单峰曲线,在7.8—218.9 W/m2之间变化,日均值为138.5 W/m2,在制种玉米生长旺盛的6月和7月,净辐射维持在一个较高水平。日均温在-1.3—28.8 ℃之间波动,其中4月份温度最低,5月中旬以前波动较大,6—8月日均温维持在20 ℃左右。风速在4月和5月份作物生长初期日均值大于2 m/s,在作物主要生长季6—8月较低。相应的饱和水汽压差在整个生长季中随着大气水分及作物生长的影响呈脉冲状波动,日均值为1.2 kPa,其中8月份日均值最大,达到1.4 kPa。土壤含水量在整个生长季也呈现先增加后减小的变化趋势,共出现了8个峰值,与7次灌溉及1次强降水对应,且峰值的大小与灌溉及降水量的强度成正相关性。

表2 各环境因子的月均值Table 2 Mean monthly values for some environmental factors
2.2 作物蒸散发模拟及其验证
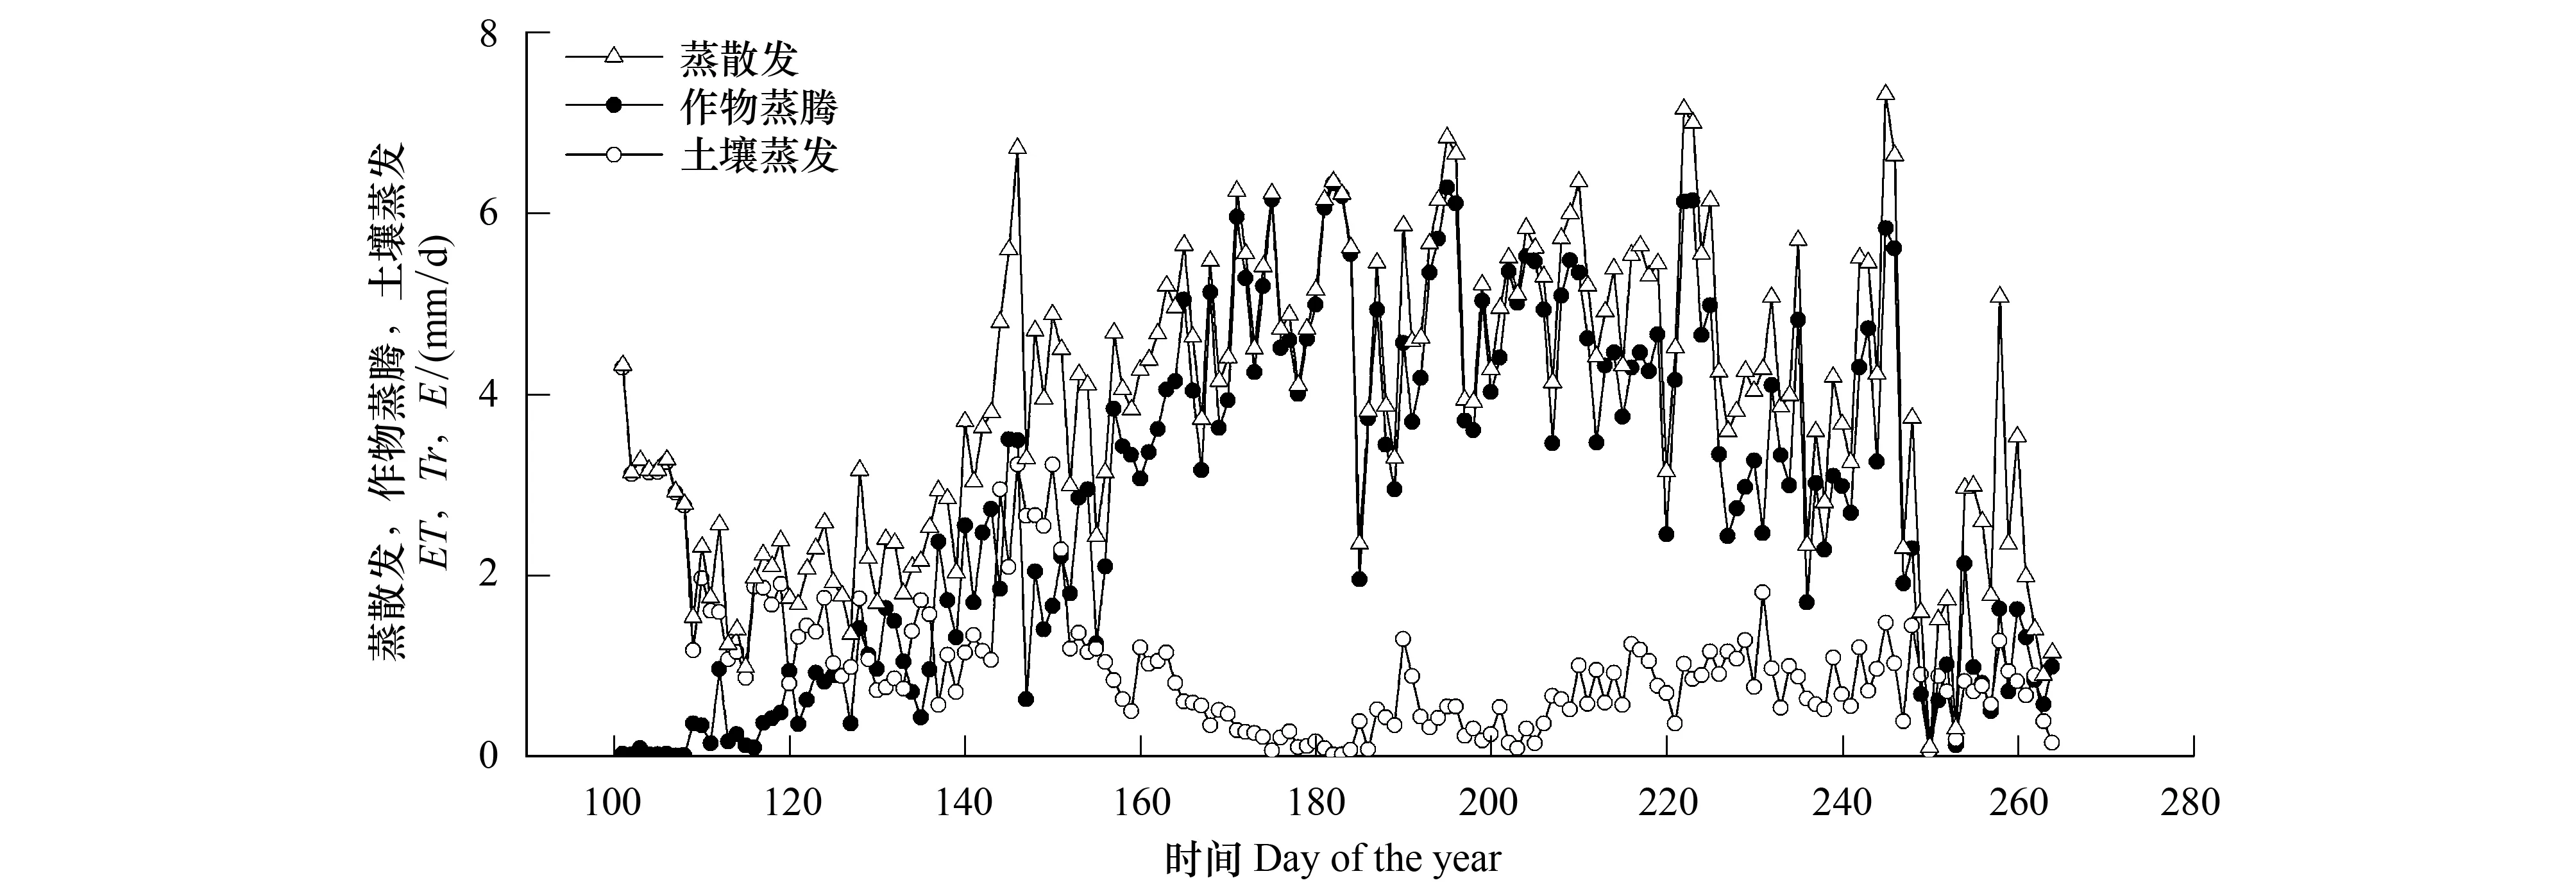
利用绿洲农田小气候数据、作物生长参数及叶片气孔导度等实测数据,基于S-W双源模型(公式(1)—(11))估算了甘肃临泽荒漠绿洲农田2009年制种玉米生长季实际蒸散发,如图3所示。在整个生长季中,累积蒸散量为640 mm,日均蒸散发为3.9 mm/d, 其中最大值出现在5月31日,最小值出现在9月6日;作物蒸腾为467 mm,日均值为2.9 mm/d,最大值出现在6月30日,最小值出现在4月初播种-出苗期间;土壤蒸发为173 mm,日均值为1.0 mm/d,最大值出现在4月10日,最小值出现在6月30日,植物蒸腾和土壤蒸发分别占总量的71.9%和28.1%,日时间尺度上,作物蒸腾和土壤蒸发分别在0—6.3 mm/d和0—4.3 mm/d之间变化,其日平均分别为2.9 和1.0 mm/d。在生长初期阶段至发育阶段,土壤蒸发大于作物蒸腾,从发育阶段开始作物蒸腾逐渐占主导,到后期阶段作物蒸腾开始逐渐减小而土壤蒸发又逐渐增强(图3)。
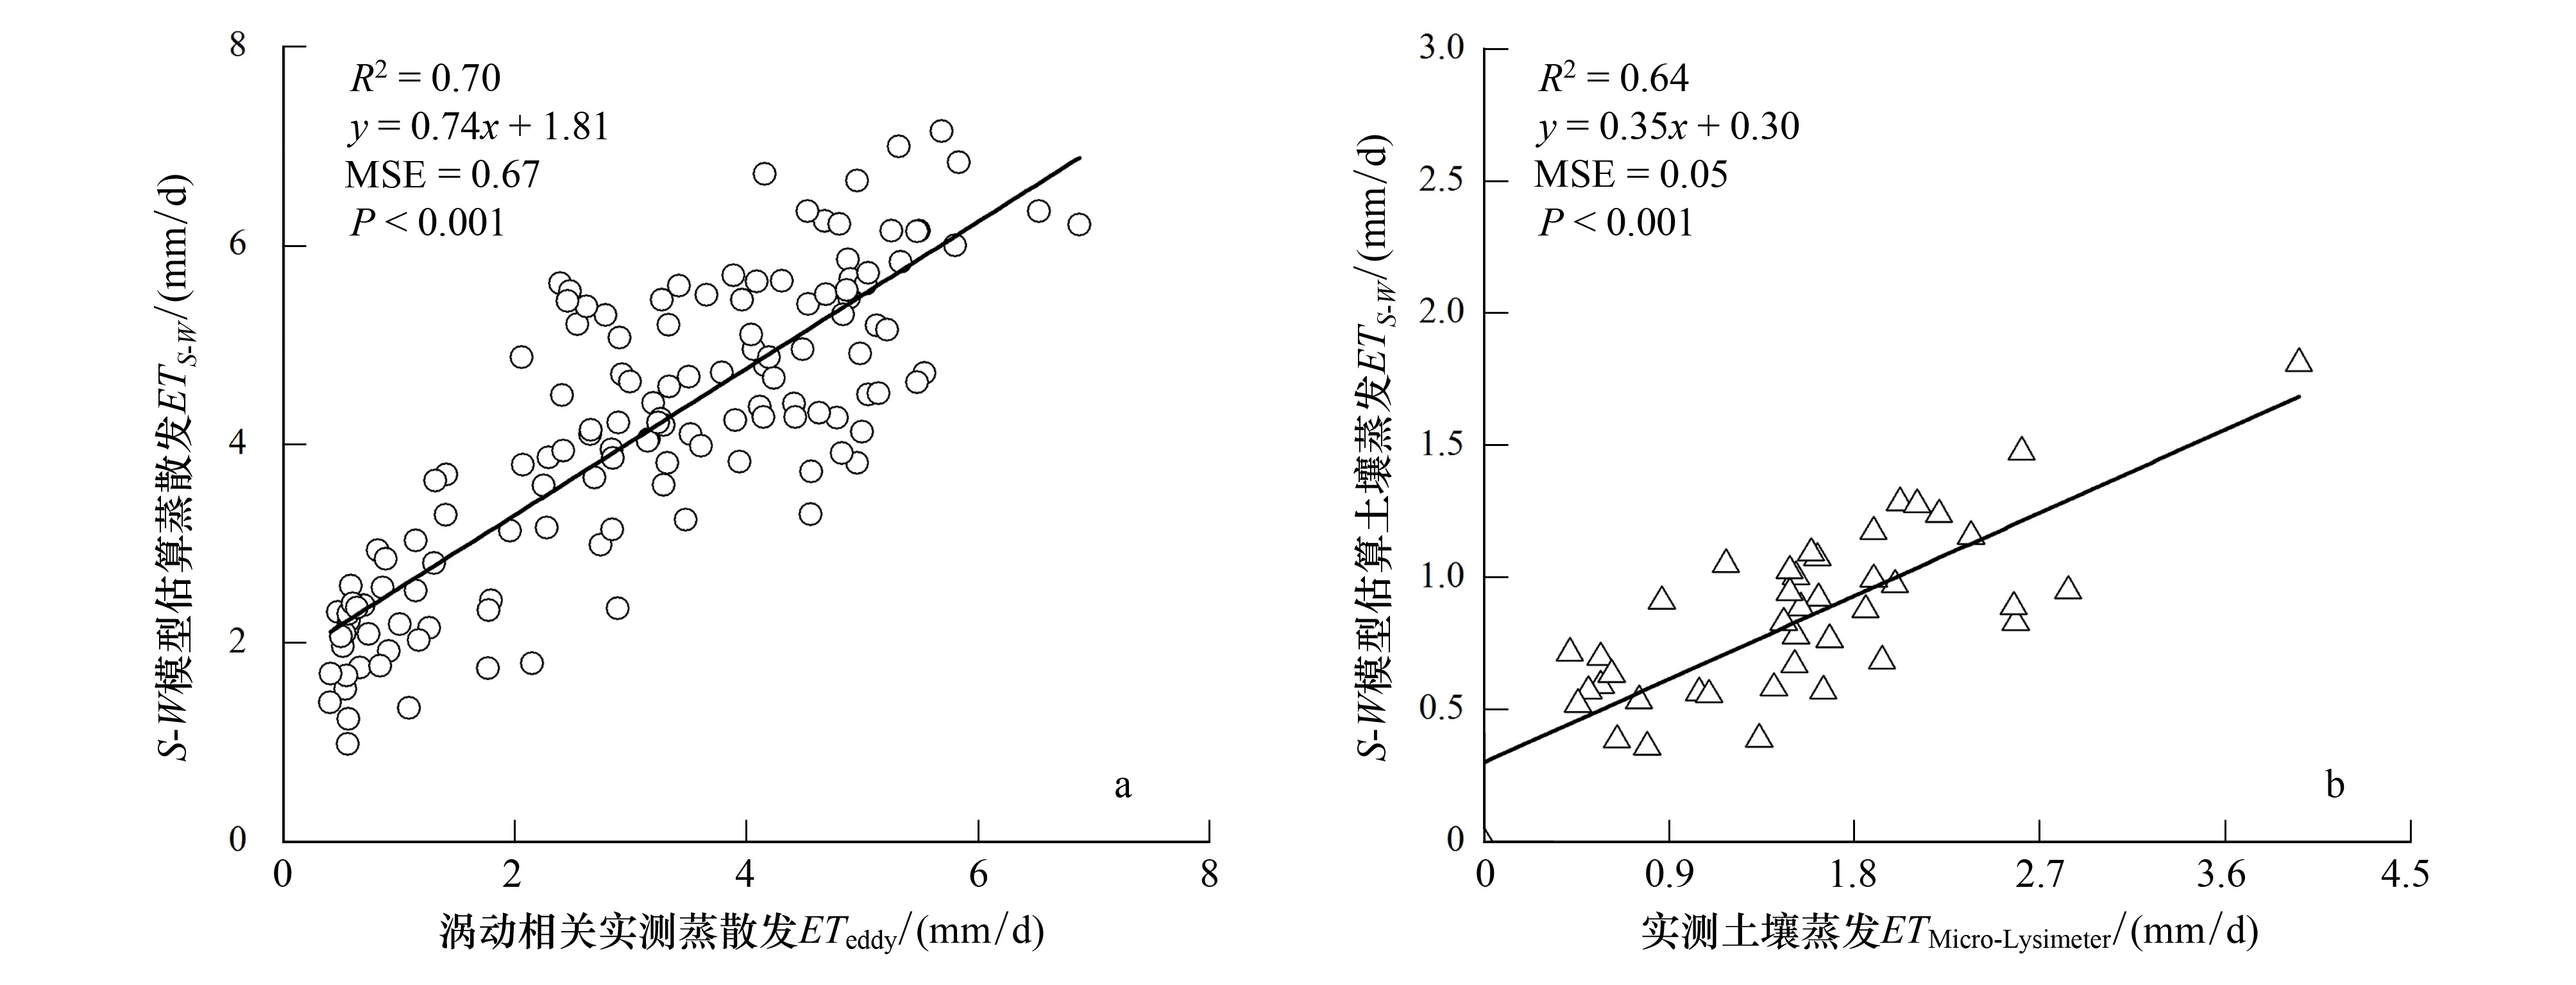
为了验证S-W双源模型的估算结果,采用涡动相关实测蒸散发数据对估算结果进行分析。可知S-W双源模型估算的蒸散量与实测值规律较一致,其相关系数R2=0.70,均方差MSE=0.67,P<0.001(图4)。采用微型蒸渗仪实测的土壤蒸发数据对S-W双源模型估算的土壤蒸发进行验证,从7月27日开始,剔除下雨或灌溉等不可抗拒因素影响的实测日蒸发数据,其余数据与模拟的日蒸发量进行回归分析,相关系数R2=0.64,均方差MSE=0.05,P<0.001(图4)。可知S-W双源模型能够较理想的估算绿洲农田蒸散发并区分田间作物蒸腾和土壤蒸发,可为田间水分管理提供理论依据。

图3 S-W模型估算的农田蒸散发、作物蒸腾与土壤蒸发逐日变化Fig.3 Daily Evapotranspiration、Evaporation and transpiration estimated by S-W model

图4 S-W估算蒸散发与涡动相关实测蒸散发相关分析;S-W估算土壤蒸发与微型蒸渗仪实测土壤蒸发相关分析Fig.4 The relationship between ETS-W and ETeddy, the relationship between ES-W and E micro-Lysimeter
3 讨论
3.1 作物耗水规律
作物耗水规律是确定灌水量、灌水时期、灌水方式等的依据,是制定大田作物灌溉制度,提高水分利用效率的理论基础。根据作物生长发育将制种玉米生长划分为5个阶段:播种-出苗、出苗-拔节、拔节-抽雄、抽雄-灌浆和灌浆-成熟期,基于S-W双源模型估算结果,对绿洲农田作物耗水规律进行分析(表3)。在播种-出苗期,LAI≈0,作物蒸腾与土壤蒸发比Tr/E=0.04,此阶段农田蒸散发以土壤蒸发为主;出苗-拔节期,随着天气变暖农田小气候发生相应变化,净辐射及温度增大,作物蒸腾与土壤蒸发均有所增加,但作物蒸腾增加幅度远大于土壤蒸发增加的幅度,主要原因是由于此阶段作物快速生长,叶面积指数逐渐增大,相应的地表覆盖也随之增加,表现为作物蒸腾与土壤蒸发之比Tr/E=0.8,其中作物蒸腾占此段总蒸散量的45.0%,土壤蒸发占55.0%;拔节-抽雄期,作物已发育完全,叶面积指数达到最大值(3.81 m2/m2),地表基本完全覆盖,冠层-土壤截获的能量绝大部分用于作物蒸腾,作物蒸腾成为农田蒸散的主导力量,此阶段Tr/E=7.0,其中作物蒸腾占此阶段总蒸散量的87.4%,土壤蒸发仅占12.6%;抽雄-灌浆期:由于母本去除,且在去除过程中对剩余植株叶片造成伤害,加之此阶段末期叶片开始衰老,致使作物蒸腾较之上一阶段有所减弱,但作物蒸腾仍占主导,Tr/E=5.2,作物蒸腾占此阶段总蒸散发的83.8%,土壤蒸发所占比例提高为16.2%;灌浆-成熟期,作物已成熟,叶片衰老枯黄,制种玉米所需水分减小,作物蒸腾明显减弱,且进入深秋,净辐射减弱温度降低,土壤蒸发能力也较弱,故此阶段Tr/E=1.4。相比于荒漠绿洲,北京地区夏玉米生长季约为114 d,其作物蒸腾与土壤蒸发比在拔节后期、孕穗期、抽雄灌浆期和成熟期差异性较小依次为,2.7、3.5、3.3和3.0[29]。而河南新乡冬小麦夏玉米共生期作物蒸腾与土壤蒸发比呈现无规律变化,于拔节-抽雄期达到最大为7.0[30]。由此可知作物耗水规律在不同地区、不同时间和不同供水条件下,其强度和变化趋势不同。制种玉米在生育期内不能受到水分胁迫,田间供水充足,故其耗水规律不同与其它地区。
在制种玉米生育期内,拔节-抽雄期和抽雄-灌浆期作物蒸腾量最大(表3),而此时对应的灌溉量也最大,说明这两个生育阶段内灌溉合理;整个生育期累积土壤蒸发为173 mm,占总蒸散发量的27.1%,可采用覆膜或秸秆覆盖等措施,减少灌溉用水量;整个生育期内蒸散发量为640 mm,灌溉和降水总量约为895 mm,可知在当前降雨条件下,灌溉量可保证制种玉米供水充足,故当生长季内降雨量减小或者增大时,可相应的调控灌溉量以减少水资源浪费;田间高效节水灌溉措施需要在田间耗水规律的基础上,根据田间水分动态平衡及作物实际生长生理状况才可得到进一步完善。

表3 不同生长阶段农田水分利用状况Table 3 Farmland water use during different growing stage
3.2 农田蒸散发对环境因子的响应
作物蒸散发强度与气象要素、土壤水分状况、作物种类及其生长发育阶段、农业技术措施、灌溉排水措施等有关[7]。制种玉米在生长过程中要求水分供应充足,不能受到水分胁迫,故农田蒸散发变化主要由环境因素及作物生长状况引起。对于环境因子而言,净辐射与蒸散发具有较好的相关性,本文监测数据显示,净辐射小于137 W/m2时,农田蒸散发随着净辐射的增加而加大,净辐射在137—226 W/m2时,农田蒸散发最大,日均值达到6.4 mm/d; 对于农田作物蒸腾,净辐射在137—199 W/m2时,作物蒸腾速率最快,日均值达到6.0 mm/d。当日均温为17.4—25.7 ℃时,农田蒸散发与作物蒸腾日均值均达到最大值。在水分条件良好的农田生态系统中,ET与饱和水汽压差呈现良好的线性正相关[31],例如在抽雄-灌浆期内,8月12日和8月20日对应的饱和水汽压差分别为2.65和0.38 kPa,其对应的日均蒸散发为6.1 mm/d和3.9 mm/d,这正好说明了这一点。风速对作物蒸散发的影响是通过加快水汽扩散、减少水汽扩散阻力来实现的,在一定范围内,蒸散发的增减与风速的0.5—1次方成正比[32],但是在生长季内,荒漠绿洲农田蒸散发与风速呈负相关,且相关性较小。
植物体作为植被蒸散中的生物因素,在很多方面对蒸散产生影响[33]。其中,不同作物的叶面积指数(LAI)因植物作物类型、生长阶段、环境状况及管理情况不同而呈现动态变化[34],其作为估计和评价植被蒸散耗水的指标比植物密度高度等更符合生物学逻辑[35]。经统计分析可知,制种玉米的土壤蒸发、作物蒸腾与LAI存在显著的相关关系,如图6所示。从图中可以看出作物蒸腾与蒸散发和LAI呈正相关,土壤蒸发与LAI呈负相关,这主要是因为作物蒸腾主要是通过叶片上的气孔散失到外界中[36],叶片的大小和浓密程度在很大程度上决定了蒸腾速率,叶片对于土壤蒸发的影响主要是通过影响地面覆盖率及太阳辐射的穿透率来控制的。叶面积指数首先影响蒸腾表面积,其次影响地表覆盖度和冠层通风状况,通过一系列反馈效应影响蒸散过程。当LAI<0.5 m2/m2时土壤蒸发日均值达到2.0 mm/d,当LAI>0.5 m2/m2时,土壤蒸发逐渐减小;作物蒸腾与LAI呈显著正相关,作物蒸腾能力随着LAI的增大而增强,当LAI>3.0 m2/m2时作物蒸腾日均值达到4.7 mm/d。当LAI≈3.2 m2/m2时,农田蒸散发日均值最大为6.5 mm/d。
从以上分析可知,气象要素(净辐射、温度等)和作物自身都会对农田蒸散发过程造成影响,但是气象要素主要通过改变农田微气候环境影响蒸散发的总量,而植物体本身的各个要素尤其是叶面积指数通过影响蒸腾表面积、地表覆盖度及冠层空气动力学状况等在很大程度上影响了作物蒸腾与土壤蒸发的比值。

图5 S-W双源模型估算土壤蒸发、农田蒸散及作物蒸腾对叶面积指数的响应Fig.5 Response of modeled E、ET and Tr on LAI, respectively
4 结论
(1)S-W双源模型能够有效的估算黑河中游荒漠绿洲农田制种玉米蒸散发并区分作物蒸腾与土壤蒸发,模型模拟结果表明2009年整个生长季荒漠绿洲农田制种玉米累积蒸散量为640 mm,日均蒸散量为3.9 mm/d,其中作物蒸腾为467 mm,土壤蒸发为173 mm,分别占总量的72.9%和27.1%。
(2)田间耗水规律表现为:作物蒸腾与土壤蒸发比值在播种—出苗期、出苗—拔节期、拔节—抽雄期、抽雄—灌浆期、灌浆—成熟期依次为0.04、0.8、7.0、5.2和1.4,呈现出先增大后减小的偏“凸”字变化趋势。气象要素(净辐射、温度等)主要影响农田蒸散发总量,植物体本身的各个要素尤其是叶面积指数主要影响作物不同生长阶段作物蒸腾与土壤蒸发的比值。
[1] Gochis D J, Cuenca R H. Plant water use and crop curves for hybrid poplars. Journal of Irrigation and Drainage Engineering, 2000, 126(4): 206- 214.
[2] Verma S B. Micrometeorological methods for measuring surface fluxes of mass and energy. Remote Sensing Reviews, 1990, 5(1): 99- 115.
[3] Leuning R, Moncrieff J. Eddy covariance CO2flux measurements using open and closed-path CO2analyzers-corrections for analyzer water vapour sensitivity and damping of fluctuations in air sampling tubes. Boundary-Layer Meteorology, 1990, 53(1/2): 63- 76.
[4] Priestley C H B, Taylor R J. On the assessment of surface heat flux and evaporation using large-scale parameters. Monthly Weather Review, 1972, 100(2): 81- 92.
[5] M Monteith J L. Evaporation and environment // Fagged G E, ed. The State and Movement of Water in Living Organism. Cambridge, UK: Cambridge University Press, 1965: 205- 234.
[6] Shuttleworth W J, Wallance J S. Evaporation from sparse crops an energy combination theory.Quarterly Journal of Meteorological Society, 1985, 111(469): 839- 855.
[7] Allen R G, Pereira L S, Raes D, Smith M. Crop evapotranspiration, Guide-lines for computing crop water requirements. FAO Irrigation and Drainage Paper 56, Rome, 1998.
[8] Garcia M, Raes D, Allen R G, Herbas C. Dynamics of reference evapotranspiration in the Bolivian highlands (Altiplano). Agricultural and Forest Meteorology, 2004, 125(1/2): 67-82.
[9] Granier A, Bobay V, Gash J H C, Gelpe J, Saugier B, Shuttleworth W J. Vapour flux density and transpiration rate comparisons in a stand of maritime pine (Pinus pinaster Ait.) in Les Landes forest. Agricultural and Forest Meteorology, 1990, 51(3-4): 309- 319.
[10] Cermak J, Nadezhdina N. Sapwood as the scaling parameter- defining according to xylem water content or radial pattern of sap flow? Annals Des Sciences Forestières, 1998, 55(5): 509- 521.
[11] Dugas W A. Sap flow in stems. Remote Sensing Reviews, 1990, 5(1): 225- 235.
[12] Meiresonne L, Nadezhdina N, Cermak J, Van Slycken J, Ceulemans R. Measured sap flow and simulated transpiration from a poplar stand in Flanders (Belgium). Agricultural and Forest Meteorology, 1999, 96(4): 165- 179.
[13] Allen R G, Clemmens A J, Burt C M, Solomon K, O′Halloran T. Prediction accuracy for project wide evapotranspiration using crop coefficients and reference evapotranspiration. Journal of Irrigation and Drainage Engineering, 2005, 131(1): 24- 36.
[14] Wallace J, Roberts J, Sivakumar M. The estimation of transpiration from sparse dryland millet using stomatal conductance and vegetation area indices. Agricultural and Forest Meteorology, 1990, 51(1): 35-49.
[15] Liu Y, Luo Y. A consolidated evaluation of the FAO- 56 dual crop coefficient approach using the lysimeter data in the North China Plain. Agricultural Water Management, 2010, 97(1): 31-40.
[16] Er-Raki S, Chehbouni A, Boulet G, Williams D G. Using the dual approach of FAO- 56 for partitioning ET into soil and plant components for olive orchards in a semi-arid region. Agricultural Water Management, 2010, 97(11): 1769- 1778.
[17] Shuttleworth W J, Gurney R J. The theoretical relationship between foliage temperature and canopy resistance in sparse crops. Quarterly Journal of Royal Meteorological Society, 1990, 16(492): 497-519.
[18] David I S. Comparison of Penman-Monteith, Shuttleworth-Wallace, and modified Priestley-Taylor Evapotranspiration models for wildland vegetation in semiarid rangeland. Water Resources Research, 1993, 29(5): 1379- 1392.
[19] Odhiambo L, Irmak S. Performance of extended Shuttleworth-Wallace model for estimating and partitioning of evapotranspiration in a partial residue-covered subsurface drip-irrigated Soybean field. Transactions of the ASABE, 2011, 54(3): 915- 930.
[20] Bernhofer C, Blanford J, Siegwolf R, Wedler M. Applying single and two layer canopy models to derive conductances of a Scots pine plantation from micrometeorological measurements. Theoretical and Applied Climatology, 1996, 53(1/3): 95- 104.
[21] Brisson N, Itier B, L′Hotel J C, Lorendeau J Y. Parameterisation of the Shuttleworth-Wallace model to estimate daily maximum transpiration for use in crop models. Ecological Modelling, 1998, 107(2): 159- 169.
[22] Iritz Z, Lindroth A, Heikinheimo M, Grelle A, Kellner E. Test of a modified Shuttleworth-Wallace estimate of boreal forest evaporation. Agricultural and Forest Meteorology, 1999, 98: 605- 619.
[23] Iritz Z, Tourula T, Lindroth A, Heikinheimo M. Simulation of willow short-rotation forest evaporation using a modified Shuttleworth-Wallace approach. Hydrological Processes, 2001, 15(1): 97- 113.
[24] 吉喜斌, 康尔泗, 赵文智, 陈仁升, 金博文, 张智慧. 黑河流域山前绿洲灌溉农田蒸散发模拟研究. 冰川冻土, 2004, 26(6): 713- 719.
[25] Montieth J L. Vegetation and the Atmosphere Volume 1 Principles. London: Academic Press, London, 1975.
[26] Brenner A J, Incoll L D. The effect of clumping and stomatal response on evaporation from sparsely vegetated shrublands. Agricultural and Forest Meteorology, 1997, 84(3-4): 187- 205.
[27] Noilhan J, Planton S. A simple parameterization of land surface processes for meteorological models. American Meteorological, 1989, 177(3): 536- 549.
[28] Ortega-Farias S, Poblete-Echeverria C, Brisson N. Parameterization of a two-layer model for estimating vineyard evapotranspiration using meteorological measurements. Agricultural and Forest Meteorology, 2010, 150(2): 276- 286.
[29] 石俊杰, 龚道枝, 梅旭荣, 马孝义, 郝卫平, 胡笑涛. 稳定同位素法和涡度-微型蒸渗仪区分玉米田蒸散组分的比较. 农业工程学报, 2012, 28(20): 114- 120.
[30] 高阳, 段爱旺, 刘浩, 刘战东, 申孝军. 冬小麦, 春玉米间作条件下作物需水规律. 节水灌溉, 2007, 3: 18- 25.
[31] 于贵瑞, 王秋风. 植物光合、蒸腾与水分利用的生理生态学. 北京:科学出版社, 2010: 355- 356.
[32] 彭世彰, 徐俊增. 农业高效节水灌溉理论与模式. 北京:科学出版社, 2009: 45-46.
[33] Baldocchi D D, Xu L K, Kiang N. How plant functional-type, weather, seasonal drought, and soil physical properties alter water and energy fluxes of an oak-grass savanna and an annual grassland. Agricultural and Forest Meteorology, 2004, 123(1): 13- 39.
[34] Weiss M, Baret F, Smith G J, Jonckheere I, Coppin P. Review of methods for in situ leaf area index (LAI) determination Part I: Estimation of LAI, errors and sampling. Agricultural and Forest Meteorology, 2004, 12l(1/2): 37- 53.
[35] 王彦辉, 熊伟, 于彭涛, 沈振西, 郭春明, 管伟, 马长明, 叶兵, 郭浩. 干旱缺水地区森林植被蒸散耗水研究. 中国水土保持科学, 2006, 4(4): 19- 25.
[36] Farquhar G D, Sharkey T D. Stomatal conductance and photosynthesis. Annual Review of Plant Physiology, 1982, 33(1): 317- 345.
Division between transpiration and evaporation, and crop water consumption over farmland within oases of the middlestream of Heihe River basin, Northwestern China
ZHAO Liwen, ZHAO Wenzhi*, JI Xibin
LinzeInlandRiverBasinResearchStation,ChineseEcosystemNetworkResearch,KeyLaboratoryofEcohydrologyofInlandRiverBasin,ColdandAridRegionsEnvironmentalandEngineeringResearchInstitute,ChineseAcademyofSciences,Lanzhou730000,China
The process of evapotranspiration (ET), which takes into account both evaporation (E) and plant transpiration (Tr), plays a prominent role in water and heat exchange in terrestrial ecosystem, given that it involves interactions between plants, soil and atmosphere. Evapotranspiration is also vital for developing water-saving irrigation schemes and improving the crop water productivity of farmland ecosystems. As for the components of evapotranspiration, investigating transpiration and evaporation separately can help us understanding crop water requirements more thoroughly. We investigated the variation in crop water consumption during the growing season for a maize field located in the Linze Inland River Basin Research Station of the Chinese Ecosystem Research Network. In this investigation, we obtained essential data, including microclimate, turbulent exchange, evaporation, and leaf stomatal conductance, in 2009. Based on these data, we simulated transpiration and evaporation in half-hour time steps using the Shuttleworth-Wallace (S-W) model. Comparing the calculatedETdata with eddy covariance data through correlation analysis, we found that the correlation coefficient (R2) was 0.70, the mean square error (MSE) was 0.67, andPless than 0.001. A correlation analysis between evaporation data measured by a micro-lysimeter and evaporation data simulated by S-W model shows a good accordance between them, withR2of 0.64, MSE of 0.67, andPless than 0.001. The S-W model was found to be useful for dividing evapotranspiration into transpiration and evaporation. After applying the model, it can be concluded that during the growing season, the cumulative evapotranspiration was about 640 mm, which consisted of 467 mm of transpiration and 173 mm of evaporation. It means that transpiration and evaporation accounted for 72.9% and 27.1% of evapotranspiration, respectively. On a daily basis, transpiration ranged from 0 to 6.3 mm/d (mean = 2.8 mm/d), while evaporation ranged from 0 to 4.3 mm/d (mean = 1.0 mm/d). The ratio of transpiration to evaporation varied with crop growth. Transpiration (water consumption) of maize during different growing stages can be summarized as follows. The ratio of transpiration to evaporation (Tr/E) was 0.04 when the leaf area index (LAI) was close to zero from seeding to emergence stage, indicating that evaporation constituted a large proportion of evapotranspiration. From emergence to jointing stage (LAI= 0.35), the ratio ofTrtoEwas 0.8, while transpiration and evaporation accounted for 45% and 55% of evapotranspiration, respectively. However, from jointing to tasseling stage (LAI= 3.81), when most of the solar radiation was captured by the canopy, transpiration accounted for 87.4% and evaporation dropped to only 12.6% of evapotranspiration, whileTr/Ewas 7.0. From tasseling to filling stage, the ratio ofTrtoEwas 5.2, while transpiration and evaporation constituted 83.8% and 16.2% of evapotranspiration, respectively. Finally, from filling to maturity, the ratio ofTrtoEdropped to 1.4 causing by little water requiring by mature maize. From these findings about evapotranspiration related to maize, it can be seen that water consumption varies by regions, growing stages of the crop, and water availability. Evapotranspiration was greatest during the tasseling and filling stages, and irrigation was also heavy at these times, indicating that the irrigation scheme was reasonable. The total evapotranspiration over the growing season was 640 mm, while the total water supply (the sum of irrigation and precipitation) was 895 mm, which means that the current irrigation scheme supplied a sufficient amount of water to the maize. However, as precipitation changes during the growth stage, the irrigation scheme should also be adjusted such that the water supplied is balanced with the water requirements of the crop for a particular growth stage. To keep water balance between supply and consumption will be help water saving in this area. Both meteorological factors and crop conditions can affect evapotranspiration. Microclimate changes with meteorological factors, leading the variation in total evapotranspiration. In addition, the earth surface coverage, canopy aerodynamics, and other conditions are affected by the crop itself (especially the LAI), which can alter the ratio of crop transpiration and water evaporation from soil.
Shuttleworth-Wallace model; transpiration; evaporation; water consumption
国家杰出青年科学基金(41125002); 国家自然科学基金项目(40930634, 41271036)
2013- 04- 22;
日期:2014- 04- 11
10.5846/stxb201304220778
*通讯作者Corresponding author.E-mail: zhaowzh@lzb.ac.cn
赵丽雯,赵文智,吉喜斌.西北黑河中游荒漠绿洲农田作物蒸腾与土壤蒸发区分及作物耗水规律.生态学报,2015,35(4):1114- 1123.
Zhao L W, Zhao W Z, Ji X B.Division between transpiration and evaporation, and crop water consumption over farmland within oases of the middlestream of Heihe River basin, Northwestern China.Acta Ecologica Sinica,2015,35(4):1114- 1123.
