基于“国家公项”生态足迹模型的青海省人口红线
2015-03-02李成英龚志起丁锐
◎李成英龚志起丁锐
基于“国家公项”生态足迹模型的青海省人口红线
◎李成英1龚志起2丁锐3
如何将人口有效控制在资源环境承载的范围内,是实现区域可持续发展的核心问题。本文以青海省为例,在生态红线视角下采用生态足迹模型对其适度人口规模进行了测度与评价,得出在2001-2013时间序列中,青海省一直存在不断增大的人口赤字,使得青海省人口与资源、环境之间的矛盾加剧,出现了不可持续发展状态,因此从降低生态足迹和提高生态承载力两个层面出发提出适宜青海省发展的人口红线规模,为青海省可持续发展提出建议与对策。

"Red line" mainly refers to 18 millions acres of arable land which is consent at the forth meeting of the tenth National People's Congress in 2006. Since then, the concept is used by the scholars in all fields. It can be seen that the essence of the "red line" is to protect the limits of a particular field. This paper, using the ecological footprint model, analyses the relationship of the ecological footprint, and the ecological carrying capacity in Qinghai from the perspective of the supply and demand.
1 . The model of the population redlines
The ecological footprint model
Ecological Footprint, which first proposed by William e. Rees in 1992, defined as: [1]"The corresponding area of productive land and aquatic ecosystems required to product The resources, informs, and assimilate The wastes produced, by a defined population at a specified material standard of living, wherever on Earth that land may be located. "
Calculation formula is: ED/ES = EF - EC
There EF for ecological footprint ,which transforms the biological consumption data of regional human activity and the energy consumption data into the corresponding ecological productive land area (Ai), EF = ∑ Airi (i=1,2,3….); there r ,the equivalent factor which is adjusted for the national average ecological productive land area.
EC for ecological carrying capacity, EC = ∑ R* yiri, i=1,2,3….. It means the summary of all kinds of ecological productive land area (R) which is transformed by the evaluating regional production factor (yi) and equivalent factor (ri).
ED (Ecological deficit) refers to the EC is less than the EF, that means human activity is beyond the bearing threshold of Ecological environmental; ES (Ecological surplus) refers to the EC is greater than the EF, that means the Ecological environment also can satisfy the human activities on the consumption of natural resources. Therefore, the calculation can be used to evaluate the relationship between population and environment.
The population redlines
Based on the concept of the red line, this paper which used the ecological footprint model, considered the population redlines is resolved by the per capita EC and per capita EF, which means it is decided by the supply and demand of the resources. The calculation formula is: P=n*EC/EF. P for population redlines, n for the population of the region.
2. The population redlines in Qinghai.
The correcting of the model
That is correction to the equivalent factor and the yield factor. [2]The genera lly units of the model is"Gobal hectare(g ha)", which means 1 gha refers to the p er hectare of all the ecological land area . However, with different regions have different ecological environment capacit y in a country; It is necessity to amend t he "global hectares" for the “national h ectra (nha)". The National hectare is not the generally hectares of land, [3]1 Nati onal ha refers to the pre ecological prod uctive land of arable land, forest land, grassland, fossil energy land, construc tion land and water area. The ecologicalfootprint of the concept of ecological productive land area is divided into six types: the cultivated land, grassland, forest land, fossil energy land, construction land and waters [4].
The calculation and analysis of 2001-2013 ecological footprints in Qinghai
The calculation of "national ha" ecological footprint involves in biological resources consumption account and energy consumption. Biological consumption accounts refer to the agricultural products, animal husbandry, aquatic products and forestry products of 27 projects. The energy consumption refers to the crude oil, raw coal, gasoline, natural gas and electricity.
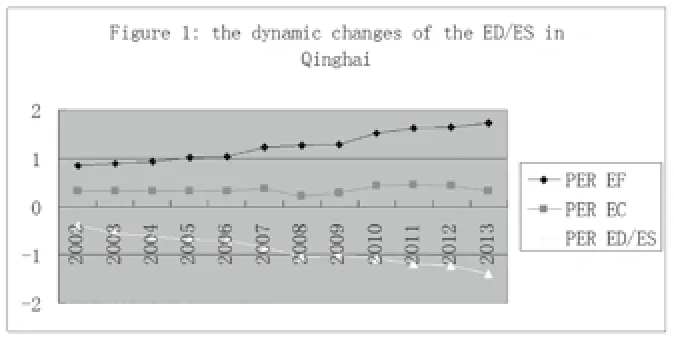
According to the calculation formula of the ecological footprint, using the date of Table 1, the paper calculated the ecological footprint and ecological carrying capacity in 2002-2013 in Qinghai. The calculation results are shown in Figure 1.

Figure 1: the dynamic changes of the ES/ ED in Qinghai ( 2002-2013)
From figure 1, it can be seen a growing trend of the per capita ecological footprint which has 0.7848 nha/cap net growth rate and 89.1% growth rate in Qinghai in the last 10 years. We can see that with the growing per capita GDP, the people's living standards improved which lead to increase the per capita consumer goods and rise the demand of the per capita ecological productive land in Qinghai. There is a severe ecological environment pressure in the process of development of Qinghai. From the year 2001 to 2013 there is always the presence of ecological deficit which means there be an imbalance between the supply and the demand. The ecological deficit shows 128.19% growth rate that increase from 0.5172 to 1.1802nha/cap. Human activities on ecological environment is greater than its ability to supply, the economic development is unsustainable in Qinghai.
The calculation and analysis of the population redlines in Qinghai
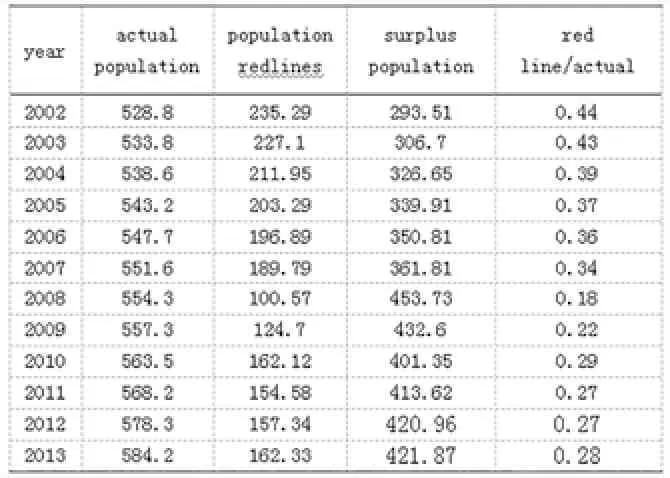
Based on the calculation results of the ecological footprint and ecological carrying capacity, it can be calculate the population redlines in Qinghai which are shown in table 3.

Table 3 2002~2011 the population redlines in Qinghai unit: ten thousand
According to table 3 it can be seen the population capacity showed a trend of decline in Qinghai, which down from 2.3961 million in 2001 to 1.0057 million in 2008 with the decline range of 58.03%; It shows the largest rising in 2009 that there is a relationship with the ecological carrying capacity in Qinghai. In the series, the actual population in Qinghai witch has an average annual growth rate of 0.78% has soared with an increase of 451000 and the growth rate is far less than the speed of economic development. From the results it also can be seen that the proportion of population redlines in actual population is low, this means that the population growth is relatively faster than the repairing speed of natural environment in Qinghai. There is an opposite direction between the actual population and the population redlines. It can be seen from the contradiction between human and natural resources that the needs of economic development have been far beyond the threshold of a regional natural resources. Based on all these analysis, the current population is no longer room for growth in Qinghai.
3. The conclusion and countermeasures
It is necessity to correct the technical parameters when the Model is used. Thus the results can improve the accuracy of the population in Qinghai and reflects the relationship between human activities and ecological environment in Qinghai.
Ecological footprint deficit leads to the population deficit. The higher the per capita ecological deficit, there will be the higher degree of excessive in Qinghai. It also cause the social and economic development in a state of unsustainable in Qinghai.
According to the analysis, we should increase the productivity of all kinds of ecological productive land. The productivity in Qinghai is far below the national average level. Because it is constrained by the natural conditions and also there be a low scientific and technological level which is lack of technical personnel. Thus the development of high-tech industries is necessity to improve the productivity in Qinghai.
To change people's ecological consumption style and reduce the ecological consumption, there is a change for singe dietary structure from food to diversification, which increased the demand of meat and dairy products in Qinghai. On this point , it is meat that is the most demand for the ecological productive land. Thus the reasonable and healthy consumption patterns and consumption structure can effectively reduce the ecological footprint.
青海市社科联项目评价研究经济和生态协调度青海基于生态红线”(14030);
青海大学“集约合理用地在青海东部的“创新方法研究青年项目(2014-qgy-6)。
(作者单位:青海大学)
基金项目:国家自然科学基金项目“集成管理系统模型为惰性建筑废物”(71463047);
