二氧化钛负载的镍氧化态对乙腈气相加氢的影响
2015-02-18夏龙飞上官文峰顾顺超平野真一
夏龙飞 江 治 上官文峰,* 顾顺超 平野真一
(1上海交通大学机械与动力工程学院,上海200240;2上海交通大学化学化工学院,上海200240;3上海交通大学平野创新研究所,上海200240)
1 lntroduction
Lower aliphatic amines are valuable products widely used in the manufacture of medicinal,agricultural,textile,rubber,and plastic chemicals.There are two main methods to prepare amines,one is the classical liquid-phase hydrogenation of nitriles,and the other one is the gas-phase hydrogenation of nitriles.But commercially the most commonly used procedure is the hydrogenation of nitriles.1-5An example is the hydrogenation of adiponitrile to produce hexamethylenediamine,a starting compound for nylon 6,6 production.6However,due to the high reactivity of partially hydrogenated reaction intermediates,i.e.imines or Schiff bases,a conventional hydrogenation process leads to a mixture of primary,secondary,and tertiary amines,7-9and the separation of these by-products is usually difficult due to their close boiling points.10
The reaction selectivity is usually of crucial importance for industrial catalysis process.Verhaaket al.11have studied the selective of acetonitrile on alumina,magnesia,aluminosilicate,and aluminophosphate supported nickel catalysts.They claimed that the selectivity of the hydrogenation of acetonitrile is greatly influenced by the nature of the support used.The mechanism implied that the hydrogenation function of the catalyst is located on the metal,while the acid function,responsible for the condensation reactions,is located on the support.Zhaoet al.12have investigated Ni/MgAlO and K2CO3-Ni/MgAlO catalysts for the hydrogenation of acetonitrile to primary amine.They found that the presence of K2CO3weakened the strength of H―Ni and strengthened the bonding of CH3CN onto Ni by changing adsorptive states of CH3CN,which might be two main reasons for the decreased activity of Ni doped with K2CO3.The addition of K2CO3decreased adsorptive strength of monoethylamine on Ni,resulting in an increase in monoethylamine selectivity.Thus,the choice of the support and the active phase can greatly influence the reaction selectivity toward a particular amine.7,11,13-15
Gluhoiet al.16have investigated nickel black and nickel deposited on MgO,Al2O3,Cr2O3,SiO2,TiO2,ZrO2,ThO2,and UO2,at ambient pressure and 70°C.They found that the selectivity to monoethylamine is the highest with nickel black,Ni/MgO,Ni/ThO2,and Ni/UO2catalysts(molar fraction>80%),while it is the lowest with Ni/TiO2catalysts(molar fraction<20%).But when the catalytic activity was normalized by the metal surface area unit,the most efficient support was TiO2.
Thus,previous researches mainly focus on the reaction selectivity to monoethylamine,but few pay attention to the reaction conversion and the effect of state of Ni.The aim of this study is,therefore,to investigate the relationship between the oxidation states of Ni supported on TiO2and the activity for the gas phase hydrogenation of acetonitrile.The oxidation state of supported Ni is tailored by the temperature of reduction on the catalytic properties of Ni/TiO2,prepared by wetness impregnation.
2 Experimental
2.1 Catalyst preparation
Ni/TiO2catalysts with Ni mass fraction of 3%,actual mass fraction of 2.8%tested by Inductive Coupled Plasma Emission Spectrometer(ICP),were prepared by wetness impregnation on TiO2support with nickel acetate(C4H6O4Ni∙4H2O)in aqueous solution.Firstly,the TiO2support was calcined in air at 500°C for 4 h.After that,the nickel acetate aqueous solution was impregnated onto TiO2support under stirring at 80°C until dryness,and drying at 80°C for 12 h.Then solid products were calcined at 400 °C for 2 h(5 °C∙min-1heating rate).The catalysts obtained were denoted as NiOx/TiO2.
2.2 Characterization of catalysts
The catalyst phase was identified using X-ray diffraction with CuKα(40 kV,20 mA)radiation(Rigaku D/max-2200/PC,Japan).Diffraction patterns were recorded from 20°to 80°at a rate of 6(°)∙min-1.Average particle size and morphology were obtained by transmission electron microscopy(TEM,JEM-2100F,Japan).
The chemical states of Ni,Ti,O,and C in the prepared NiOx/TiO2catalysts were determined using X-ray photoelectron spectroscopy(XPS).The XPS signals were collected using an AXIS UltraDLD X-ray source with an aluminum crystal,operating at an anode voltage of 12 kV and an emission current of 12 mA to generate the required AlKαradiation.Subsequently,curve fitting and background subtraction were performed using Casa XPS software.All the binding energy(EB)values were calibrated by using the standardEBvalue of contaminant carbon(EBof C 1sis 284.8 eV)as a reference.
Temperature-programmed reduction(TPR)was performed using a quartz U-tube reactor loaded with about 20 mg of NiOx/TiO2.A mixture of N2and H2(5%H2by volume)was used,and the flow rate was maintained at 30 mL∙min-1.The temperature wasraisedataprogrammedrateof 10 °C∙min-1from100to600 °C.
Ammonia temperature programmed desorption(NH3-TPD)profiles of catalysts were obtained by placing 100 mg of NiOx/TiO2reducedin situin a tubular reactor.After cleaning with He(30 mL∙min-1)from room temperature to 400 °C,and holding for 20 min,then cooling to 50°C,the adsorption of ammonia(5 min)at this temperature was performed.He flow(30 mL∙min-1)was next passed to eliminate the physical absorption of ammonia.Temperature programmed desorption was then carried out by heating the samples from 50 to 500 °C,at a heating rate of 10 °C∙min-1.
2.3 Catalytic tests
The hydrogenation reactions were performed in a quartz fixedbed reactor.The catalysts(NiOx/TiO2)were pelletized,crushed,and sieved to a fraction of size 0.25-0.38 mm.A sample of the catalyst(0.2 g)was placed in the middle of the vertical quartz reactor(inner diameter 5.6 mm).Then the catalyst was reduced in a flow of hydrogen at different temperatures for 4 h.For convenience,catalysts obtained were denoted as,R200(the catalyst reduced at 200 °C),R300(the catalyst reduced at 300 °C),and R400(the catalyst reduced at 400 °C).The hydrogen flow(60 mL∙min-1)was subsequently saturated with acetonitrile by bubbling the gas stream through a saturator,held at-5°C by means of a cooled circulator,resulting in a volume concentration of 2.5%acetonitrile in the gas stream.The gas mixture was passed through the fixed catalyst bed that consisted of Ni/TiO2catalyst.The temperature was measured with a thermocouple.11,12
Firstly the reactor temperature was raised from room temperature to 50°C and then the temperature of the catalyst bed was stabilized for 25 min.Following the stabilization,the bed temperature was raised to 180 °C at a step of 10 °C with a 25-min stabilization time between two measurements.
Sampling of the reactant and product gases was performed with pneumatically controlled six-way valves and the gas samples were analyzed by means of gas chromatography(GC)using a gas chromatograph equipped with a flame ionization detector.Data points were collected every 30 min.
The conversionCof acetonitrile is defined as equation(1).In the equation,Soutis the peak area of acetonitrile in the flame ionization detector when the reaction proceeded.AndSinis the peak area of acetonitrile in the flame ionization detector before the reaction.

3 Results and discussion
3.1 Reaction conversion activity
The bare TiO2supports is reported to have no catalytic activity in acetonitrile hydrogenation,under the reaction conditions used in present study.16As shown in Fig.1,the conversion of acetonitrile is slightly higher than 0%at the beginning temperature point(50°C),and it further decreases to below 0%in the temperature range from 50 to 70°C,which can be ascribed to the adsorption and following desorption process of acetonitrile on Ni/TiO2catalyst during the initial heating process.The temperature for 100%conversion of acetonitrile is 100,120,and 110°C for R300,R200 and R400 respectively.And the R300 also have higher reaction conversion ratio in the lower temperature range.Thus,R300 shows the highest reaction activity for hydrogenation of acetonitrile.
3.2 Yield of products

Fig.1 Conversion of acetonitrile as a function of temperature with R200,R300,R400
Monoethylamine(MEA),diethylamine(DEA),and triethylamine(TEA)are the main products for the hydrogenation of acetonitrile with Ni/TiO2catalysts.Yield(Y)of products is defined as equations(2)-(4).In equations,SMEA,SDEA,andSMEAare peak areas corrected for different response factors in the flame ionization detector and normalized to moles of product.
As shown in Fig.2,TEAis produced at 70 and 80°C for R300 and R200 respectively,while TEA and DEA are produced simultaneously at 90°C for R400.Thus,TEA can be regarded as the initial product during the hydrogenation reaction for R300 and R200.And TEA and DEA are the initial hydrogenation products for R400 as shown in Fig.2,which may be due to the difficulty of the desorption of TEAbelow 90°C for R400.
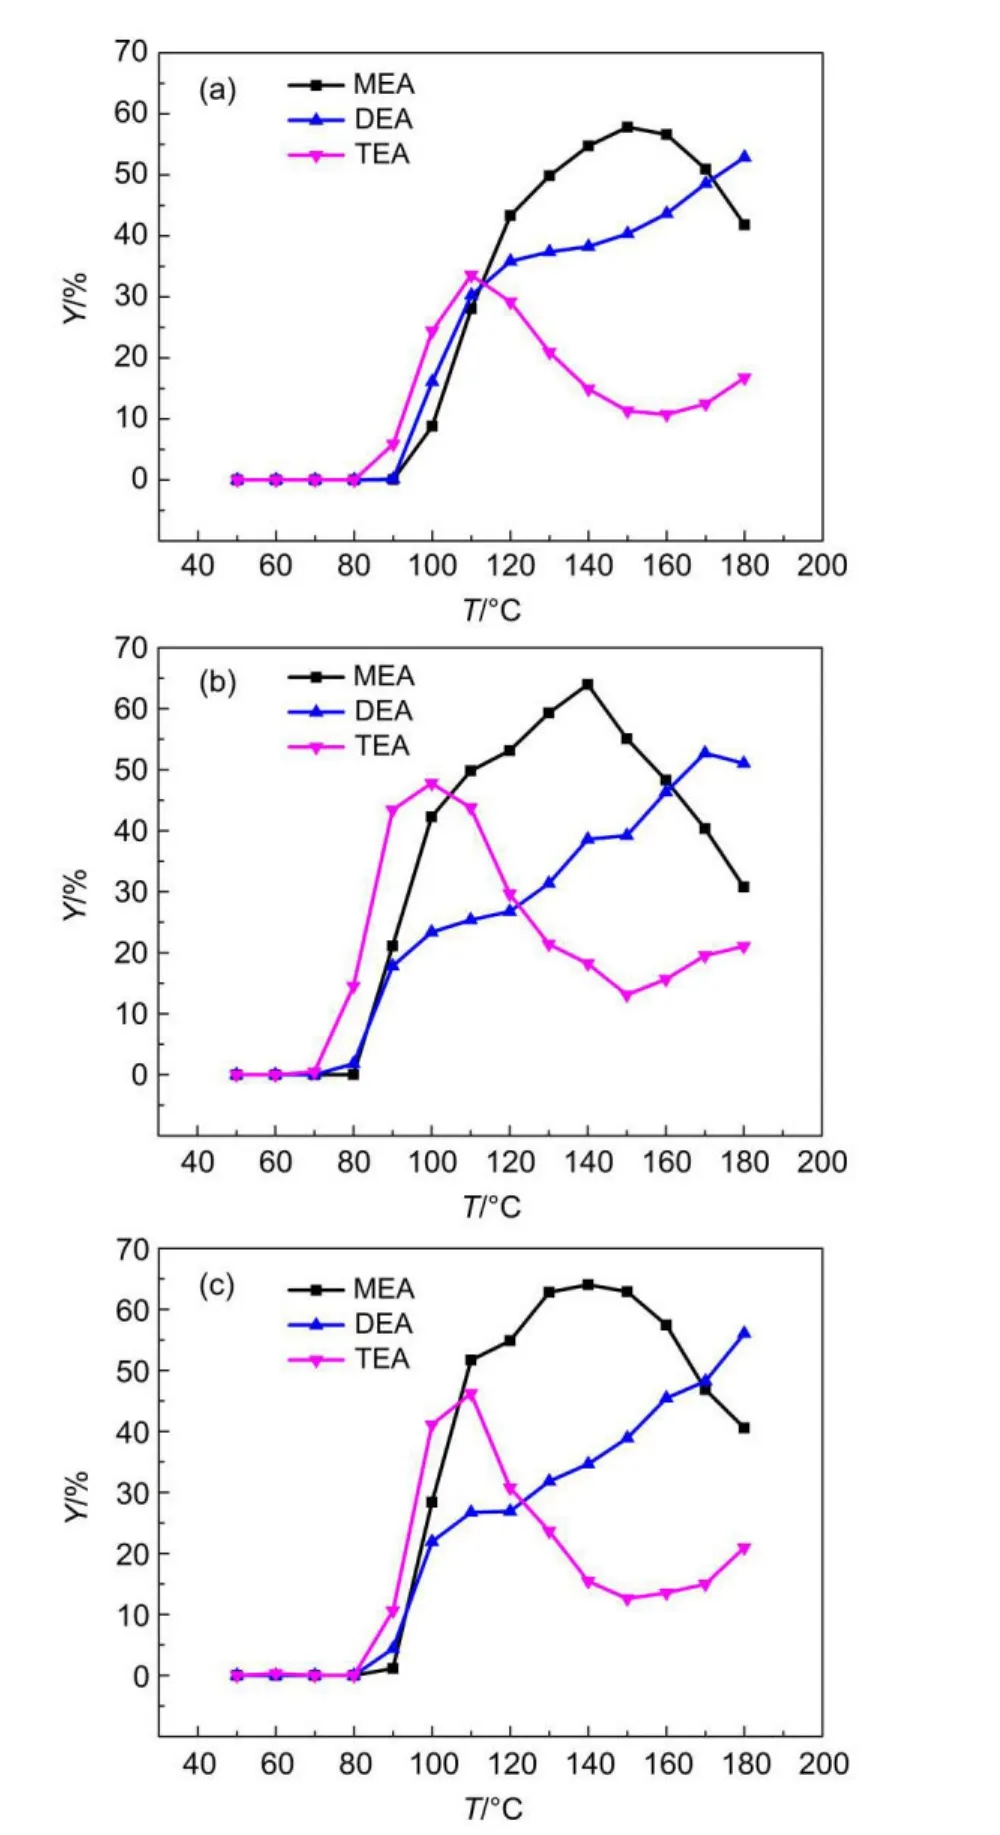
Fig.2 Yield of products as a function of temperature with(a)R200,(b)R300,(c)R400
The selectivity in acetonitrile hydrogenation is determined by the production of the intermediate products,imine CH3―CH=NH,which can either accept two hydrogen atoms to form primary amine or can react with already-formed amine to obtain superior amines by condensation reactions17.These latter reactions can occur on both the metal site and acid sites of the support through a bifunctional mechanism.7,11,18Verhaak11and Cabello19et al.proposed that the secondary amine is obtainedviathe reaction of amine with imine,the tertiary amine is obtainedviathe reaction of secondary amine with imine.However,in this study,TEAis the only initial product.Thus,the initial reaction step in this system may not be the formation of TEA between the reaction of one secondary amine and one imine6,14as shown in equation(5).Meanwhile,Feng20has found that at 198 K the CH3CN molecule rehybridized and chemisorbed on metal catalysts by di-σ-bond with carbon and nitrogen atom paralleled to the surface,which means that CH3CN can be activated by metal catalysts.Thus it is proposed that the formation of TEA between the interactions of two imines with one nitrile as shown in equation(6)may be the initial step in this system.

The maximum yield of products over Ni/TiO2catalysts are presented in Table 1.It suggests the increase of the maximum yield of TEA with the increase of the reduction temperature.However,the maximum yield of MEA only increases slightly while the maximum yield of DEA is almost identical which may be due to the appearance of the maximum yields of MEA and DEAat high temperature(>150 °C)range.
3.3 Structure of catalysts
As shown in Fig.3,nickel particles are homogenously distributed on the TiO2and the average size of nickel increases with the increase of the reduction temperature.As shown in Fig.4,typical X-ray diffraction peaks of P25,mixture of anatase and rutile,are observed.The peaks at 25.3°,37.0°,37.8°,38.6°,48.0°,52.0°,53.9°,55.1°,62.7°,68.8°,and 70.3°,correspond to the anatase crystalline phase[JCPDS 78-2486].While the other peaks at 27.4°,36.1°,41.2°,54.3°,and 56.6°,correspond to the rutile crystalline phase[JCPDS 21-1276].And these peaks are more intensive for NiOx/TiO2than for R200,R300,and R400,indicating that reducing in H2may change part of the anatase and/or rutile to amorphous titanium dioxide.However diffraction peaks of Ni and NiOxare not observed,indicating its high dispersion state in catalysts.
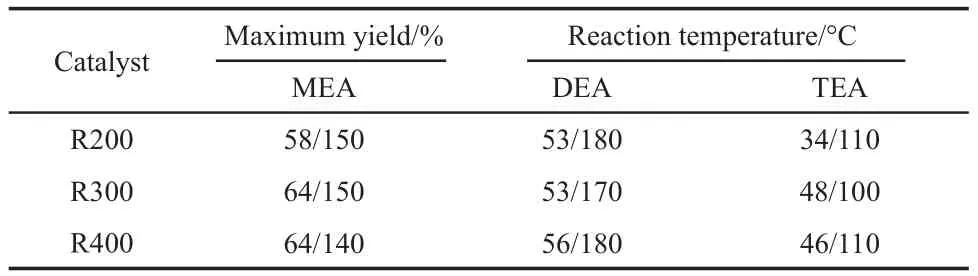
Table 1 Results of maximum yields of products over different catalysts
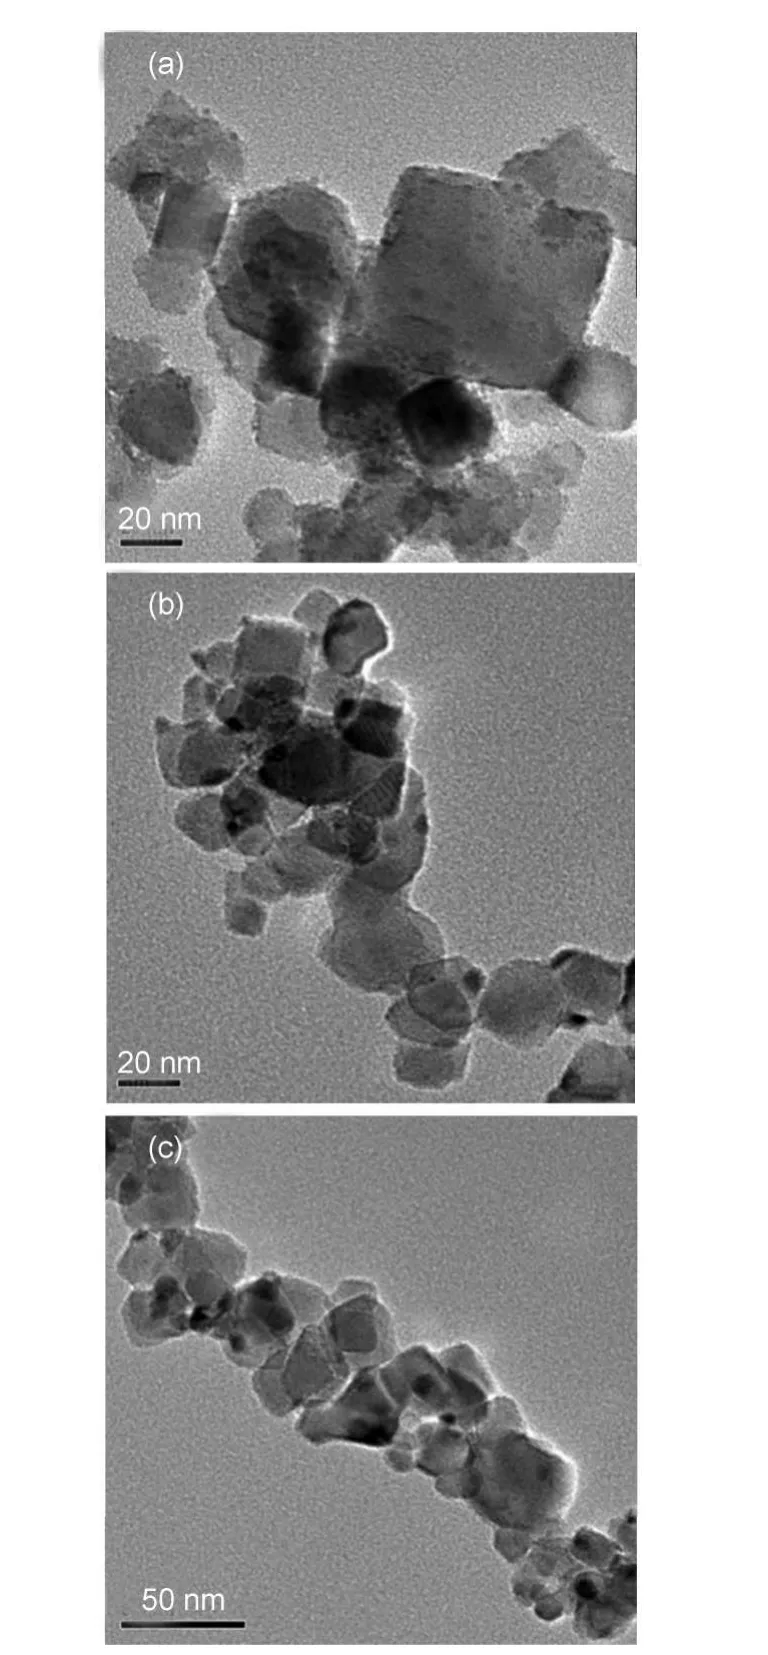
Fig.3 TEM images for(a)R200,(b)R300,(c)R400
3.4 XPS analysis
XPS studies are further performed to obtain the surface chemical states information of catalysts(Fig.5,Fig.6,Fig.7,and Fig.8).XPS results are fitted with Casa XPS software.

Fig.4 XRD patterns for(a)NiOx/TiO2,(b)R200,(c)R300,(d)R400
The XPS spectrum of Ni 2pis shown in Fig.5.It shows that the peak intensity of NiO decreases with the increase of the reduction temperature from 200 to 400°C,while Ni0peak appears when the reduction temperature reaches to 300°C,and peaks of Ni2O3exist in all temperature range.21,22The XPS spectrum of Ti 2pis shown in Fig.6.The peaks centered at 458.6 eV represent the Ti4+in TiO2.22-26The appearance of the strong peak at 455.7 eV for R200 suggests the existence of two kinds of Ti state on the surface of R200.As shown in Fig.7,the C 1score level includes four components;the peaks centered at 284.8 eV represent the pure carbon contribution,and the peaks at about 286 eV correspond to carbon linked to single oxygen species,the peaks at 288.3 eV correspond to carbon linked with an oxygen atom(C=O),26which should arise from surface contamination,the peaks centered at about 282 eV correspond to carbide species.26,27It is also worth mentioning that the appearance of the second Ti species as shown in Ti 2pspectrum and possible carbide species in C 1sspectrum for R200 may suggest the formation of Ti―C bond in this catalyst.As shown in Fig.8,the O 1sincludes three components;the peak centered at 529.1 eV corresponds to NiO,28the peaks centered at 529.7 eV represent TiO2,25,29and the peaks at about 531.0 eV correspond to Ni2O3,28which is corresponding to the Ni 2pXPS results as shown in Fig.5.
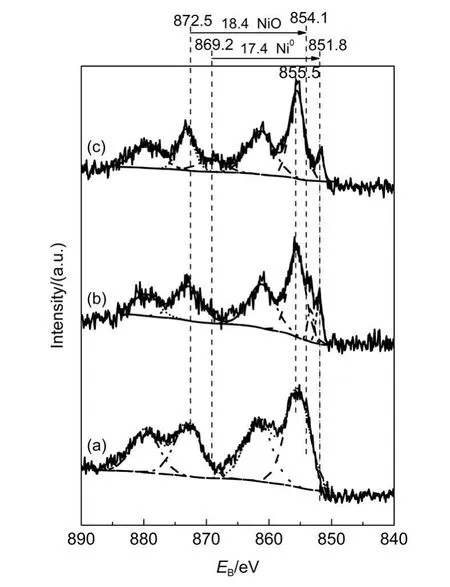
Fig.5 XPS sperctra of Ni 2p for Ni/TiO2catalysts
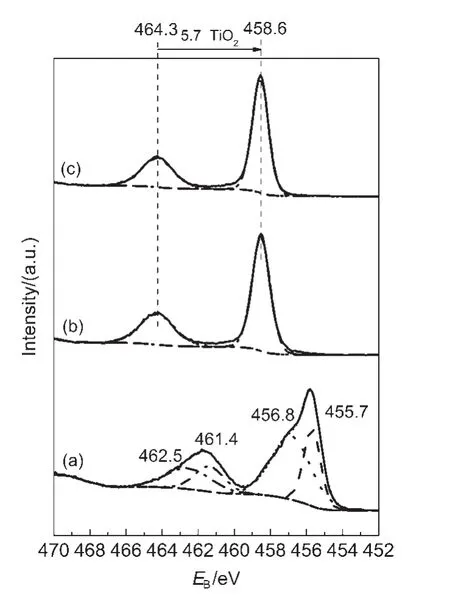
Fig.6 XPS sperctra of Ti 2p for Ni/TiO2catalysts

Fig.7 XPS sperctra of C 1s for Ni/TiO2catalysts
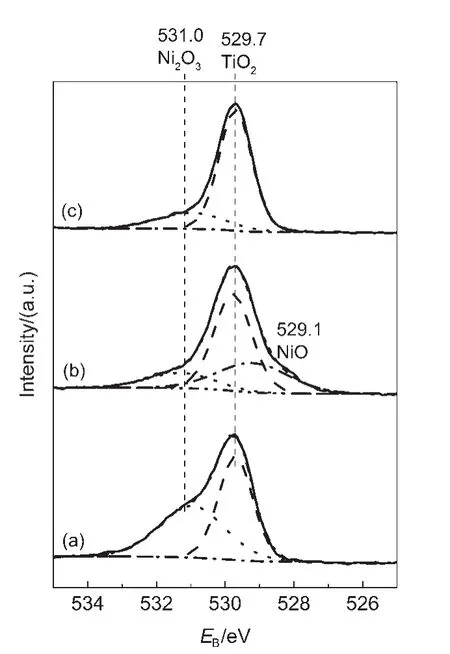
Fig.8 XPS sperctra of O 1s for Ni/TiO2catalysts

Fig.9 TPR profiles for(a)TiO2calcined at 500°C for 4 h and(b)NiOx/TiO2
3.5 H2-TPR
H2-TPR has been employed to explore the states of nickel under different reduction temperatures.As shown in Fig.9,the TPR profile of TiO2shows a small peak at 550°C,which suggests the reduction of TiO2to Ti2O3at 550°C.The TPR profile of NiOx/TiO2shows four reduction peaks,centered at 271,308,394,and 550°C.Combining with the result of XPS,it indicates that the residue of carbon on the surface of catalysts reacts with oxide at 271°C;the reduction process of Ni2O3to NiO proceeds at 308°C;and the strongest peak centered at 394°C corespond to the process of NiO to Ni.Although only a little fraction of Ni2O3can be reduced to NiO,most of the NiO can be reduced to Ni metal as suggested by the peak area ratio shown in Fig.9.
3.6 NH3-TPD
NH3-TPD has been used to investigate the acidic and catalytic properties.As shown in Fig.10,the NH3-TPD profile for Ni metal is just a straight line,which suggests there is no desorption of NH3on Ni.A small peak centered at about 150°C appears on the profile of NiO,which corresponds to weak acid sites.Ni2O3showed abnormal desorption peak(not shown here),which may be due to the possible decomposition of Ni2O3in NH3-TPD circumstance.The NH3-TPD profile for TiO2support exhibits two desorption peaks,centered at 95 and 380°C.Compared with pure TiO2,two additional peaks centered at lower temperature,i.e.252 and 330°C,appear in NH3-TPD profiles of Ni/TiO2while the peak intensity centered at 380°C decreases.
Considering the preferential condensation reaction under weak acidity conditions,the above results thus suggest the gradual appearance of Ni0in Ni/TiO2and corresponding decrease of intrinsic acidity of the Ni/TiO2catalyst with the increase of the reduction temperature,which may be responsible for the increase of the maximum yield of TEAwith the increases of the reduction temperature.

Fig.10 Ammosnia desorption profiles for(a)Ni,(b)NiO,(c)TiO2 calcined at 500°C for 4 h,(d)R200,(e)R300,(f)R400
4 Conclusions
The Ni/TiO2catalysts reduced at different temperatures exhibited different activities and yields of products in hydrogenation of acetonitrile.R300 achieved the highest conversion acitivity.TEA was the initial product produced during the hydrogenation of acetonitrile reaction in Ni/TiO2.Increase of the temperature from 200 to 300 and 400°C leads to the increase of the maximum yield of TEA.Characterization results showed the formation of dispersed Ni catalyst with different oxidation states when NiOx/TiO2was reduced at different temperatures,which further influenced the acid sites of Ni/TiO2and the formation of TEA during the initial stage of acetonitrile hydrogenation reaction.
(1) Weissermel,K.;Arpe,H.J.Industrial Organic Chemistry;Verlag Chemie:Berlin,1978.
(2) Grayson,M.Kirk-Othmer Encyclopedia of Chemical Technology,2nd ed.;Wiley:New York,1983;Vol.2,p 272.
(3)Li,H.X.;Wu,Y.D.;Luo,H.S.;Wang,M.H.;Xu,Y.P.Journal of Catalysis2003,21,15.
(4)Wang,M.H.;Li,H.X.;Wu,Y.D.;Zhang,J.Materials Letters2003,57,2954.doi:10.1016/S0167-577X(02)01404-0
(5) Braos-García,P.;García-Sancho,C.;Infantes-Molina,A.;Rodríguez-Castellón,E.;Jiménez-López,A.Applied Catalysis A:General2010,381,132.doi:10.1016/j.apcata.2010.03.061
(6) Medina,F.;Salagre,P.;Sueiras,J.E.;Fierro,J.L.G.Journal of Molecular Catalysis1991,68,L17.
(7) Medina,F.;Dutartre,R.;Tichit,D.;Coq,B.;Dung,N.T.;Salagre,P.;Sueiras,J.E.Journal of Molecular Catalysis A:Chemical1997,119,201.doi:10.1016/S1381-1169(96)00484-0
(8) Braos-García,P.;Maireles-Torres,P.;Rodríguez-Castellón,E.;Jiménez-López,A.Journal of Molecular Catalysis A:Chemical2003,193,185.doi:10.1016/S1381-1169(02)00454-5
(9) Yang,P.F.;Jiang,Z.X.;Ying,P.L.;Li,C.Journal of Catalysis2008,253,66.doi:10.1016/j.jcat.2007.10.029
(10) Gomez,S.;Peters,J.A.;Maschmeyer,T.Adv.Synth.Catal.2002,344,1037.
(11) Verhaak,M.J.F.M.;Dillen,A.J.;Geus,J.W.Catalysis Letters1994,26,37.doi:10.1007/BF00824030
(12) Zhao,J.;Chen,H.;Tian,X.C.;Zang,H.;Fu,Y.C.;Shen,J.Y.Journal of Catalysis2013,298,161.doi:10.1016/j.jcat.2012.11.010
(13)Rode,C.V.;Arai,M.;Shirai,M.;Nishiyama,Y.Applied Catalysis A:General1997,148,405.doi:10.1016/S0926-860X(96)00238-4
(14) Huang,Y.Y.;Sachtler,W.M.H.Journal of Catalysis1999,188,215.doi:10.1006/jcat.1999.2645
(15) Huang,Y.Y.;Adeeva,V.;Sachtler,W.M.H.Applied Catalysis A:General2000,196,73.doi:10.1016/S0926-860X(99)00457-3
(16) Gluhoi,A.C.;Mărginean,P.;Stănescu,U.Applied Catalysis A:General2005,294,208.doi:10.1016/j.apcata.2005.07.036
(17) Cerveny,L.Catalytic Hydrogenation;Elsevier:Amsterdam,1986.
(18) Coq,B.;Tichit,D.;Ribet,S.Journal of Catalysis2000,189,117.doi:10.1006/jcat.1999.2694
(19) Cabello,F.M.;Tichit,D.;Coq,B.;Vaccari,A.;Dung,N.T.Journal of Catalysis1997,167,142.doi:10.1006/jcat.1997.1523
(20) Feng,W.M.Acta Phys.-Chim.Sin.1992,8,313.[冯言貝民.物理化学学报,1992,8,313.]doi:10.3866/PKU.WHXB19920307
(21) Barr,T.L.J.Phys.Chem.1978,82,1801.doi:10.1021/j100505a006
(22) Moulder,J.F.;Stickle,W.F.;Sobol,P.E.;Bomben,K.D.Handbook of X-ray Photoelectron Spectroscopy;Perkin Elmer Eden Prairie:Minnesota,MN,1992.
(23)Ramqvist,L.;Hamrin,K.;Johansson,G.;Fahlman,A.;Nordling,C.Journal of Physics and Chemistry of Solids1969,30,1835.doi:10.1016/0022-3697(69)90252-2
(24) Hopfengärtner,G.;Borgmann,D.;Rademacher,I.;Wedler,G.;Hums,E.;Spitznagel,G.Journal of Electron Spectroscopy and Related Phenomena1993,63,91.doi:10.1016/0368-2048(93)80042-K
(25) Leinen,D.;Fernandez,A.;Espinos,J.;Holgado,J.;González-Elipe,A.Applied Surface Science1993,68,453.doi:10.1016/0169-4332(93)90226-2
(26) Rats,D.;Vandenbulcke,L.;Herbin,R.;Benoit,R.;Erre,R.;Serin,V.;Sevely,J.Thin Solid Films1995,270,177.doi:10.1016/0040-6090(95)06913-5
(27) Perry,S.S.;Ager,J.W.,III;Somorjai,G.A.;McClelland,R.J.;Drory,M.D.Journal of Applied Physics1993,74,7542.doi:10.1063/1.354980
(28) Kim,K.S.;Davis,R.Journal of Electron Spectroscopy and Related Phenomena1973,1,251.
(29) Kuznetsov,M.;Zhuravlev,J.F.;Gubanov,V.Journal of Electron Spectroscopy and Related Phenomena1992,58,169.doi:10.1016/0368-2048(92)80016-2