Infuence of sulfate ion concentration and pH on the corrosion of Mg-Al-Zn-Mn(GA9)magnesium alloy
2015-02-16SudrshnShettyJgnnthNykNitynndShetty
Sudrshn Shetty,Jgnnth Nyk,A.Nitynnd Shetty,*
aDepartment of Chemistry,National Institute of Technology Karnataka,Surathkal,Srinivasnagar,Mangalore 575025,Karnataka,India
bDepartment of Metallurgy and Materials Engineering,National Institute of Technology Karnataka,Surathkal,Srinivasnagar,Mangalore 575025,Karnataka,
India
Infuence of sulfate ion concentration and pH on the corrosion of Mg-Al-Zn-Mn(GA9)magnesium alloy
Sudarshana Shettya,Jagannath Nayakb,A.Nityananda Shettya,*
aDepartment of Chemistry,National Institute of Technology Karnataka,Surathkal,Srinivasnagar,Mangalore 575025,Karnataka,India
bDepartment of Metallurgy and Materials Engineering,National Institute of Technology Karnataka,Surathkal,Srinivasnagar,Mangalore 575025,Karnataka,
India
The corrosion behavior of Mg-Al-Zn-Mn(GA9)alloy in sodium sulfate solutions was studied over a range of concentrations and solution temperatures at different pH conditions by electrochemical techniques likeTafel extrapolation and electrochemical impedance spectroscopy(EIS). The studies were carried out in solutions with sodium sulfate concentrations 0.1M,0.5M,1M,1.5M and 2M;and at fve different temperatures of 30,35,40,45 and 50°C in a pH range of 3–12.As per the experimental data,the corrosion rate of the alloy increased with the increase in temperature,and also with the increase in concentration of sodium sulfate in the medium.It was observed that the rate of corrosion decreased with the increase in pH.The activation parameters like activation energy,enthalpy of activation and entropy of activation for the corrosion process were calculated.The surface morphology of the alloy was examined before and after corrosion using scanning electron microscopy(SEM).
GA9 magnesium;EIS;Polarization;SEM
1.Introduction
Magnesium is an attractive metal due to its low density and relative seawater abundance[1].Magnesium alloys offer a unique combination of desirable high physical and mechanical properties such as strength to weight ratio,good damping capacity and admirable machinability;and these properties have been well exploited in the design of consumer products containing magnesium[2,3].The automobile is one of the main industries,which has benefted from the development in the feld of magnesium research[4].However,the poor corrosion resistance of magnesium and its alloys has been the main impediment in their applications.Magnesium-aluminum-zinc (Mg-Al-Zn)alloys and magnesium-aluminum-zinc-manganese (Mg-Al-Zn-Mn)alloys are widely used in the automotive feld. The presence of aluminum imparts better castability and an increase in ambient tensile,compressive and fatigue strengths. The presence of manganese improves the corrosion resistance of Mg-Al alloys and Mg-Al-Zn alloys by removing iron and other heavy metal elements to avoid the formation of harmful intermetallic compounds.Besides,manganese also refnes the grain size and improves the welding properties of the magnesium alloys[5].
The search in the literatures reveals that the earlier studies have established the relationship between the effects of microstructure and environmental factors on the corrosion behavior of magnesium and its alloys[1,6,7].Magnesium quickly develops an oxide flm on the surface in air,but magnesium oxide (MgO)can only provide limited protection[8–10].In wet air and aqueous solutions,oxide and hydroxide layers(MgO/ Mg(OH)2)are formed spontaneously on the surface.The oxide and hydroxide flms tend to break down chemically in the solution containing chloride,sulfate and bromide[10,11].It is well known that Cl−promotes the corrosion of magnesium and its alloys in aqueous solutions,and the corrosion rate usually increases with the increasing Cl−concentration.SO42−is believed to have less infuence than Cl−,and is sometimes served as a supporting electrolyte for electrochemical investigations[7,10,11].
Many of the magnesium alloy parts fnd applications outdoor,where they get exposed to open atmosphere and oftenencounter aqueous salt environments(acidic rain,salts in polluted humid air and road splash for automobile parts)in which the alloy is highly susceptible for corrosion.A good understanding of the corrosion behavior of the alloy in aqueous salt environment like aqueous sulfate solutions is essential in the development of any corrosion controlling measure.So the present study is intended to explore the corrosion behavior of Mg-Al-Zn-Mn alloy having a specifc composition in a medium with variable concentration of sulfate ions and pH,at different temperaturesusing electrochemicalcorrosion monitoring techniques.
2.Experimental
2.1.Materials
The experiments were carried out on the specimen of Mg-Al-Zn-Mn(GA9)alloy,whose composition is as given in Table 1.The working electrode GA9 was in the form of a cylindrical rod embedded in epoxy resin leaving an open surface area of 0.6363 cm2.The coupon was abraded as per standard metallographic practice,belt grinding followed by polishing on emery papers of grades 600,800,1000,1200,1500, 2000,fnally on polishing wheel using legated alumina abrasive to obtain a mirror fnish.Then the coupon was degreased with acetone,rinsed with distilled water and dried before immersing in the experimental electrolyte medium.
2.2.Electrolytes
The electrolytes,sodium sulfate solutions of concentrations 0.1 M,0.5 M,1 M,1.5 M and 2 M were prepared by dissolving the salt in doubled distilled water.The pH of the solution was adjusted to the desired value(pH=3,5,7,9,12 for each sulfate concentration)by the addition of H2SO4and NaOH,and the pH value of the solution was measured using a calibrated pH meter. The corrosion tests were carried out at temperatures 30°C, 35°C,40°C,45°C and 50°C(±0.5°C),by putting the corrosion cell in a calibrated thermostat.
2.3.Electrochemical measurements
Electrochemical measurements were carried out under unstirred conditions using an electrochemical workstation,Gill AC having ACM instrument version 5 software.The experimental corrosion cell employed was a conventional threeelectrode Pyrex glass cell with a platinum counter electrode,a saturated calomel electrode(SCE)as reference and the GA9 magnesium alloy specimen as the working electrode.All the potential values reported are referred to the SCE.The polarization studies were carried out immediately after the electrochemical impedance spectroscopy(EIS)studies on the same exposed electrode surface without any additional surface treatment.

Table 1Composition of Mg-Al-Zn-Mn alloy(%by weight).
2.3.1.Potentiodyanamic polarization studies
Finely polished GA9 magnesium alloy,sealed by epoxy resin with an exposure surface of 0.6363 cm2as working electrodes was exposed to the corrosion medium of different concentrations of sodium sulfate(0.1M to 2.0M)at different temperatures(30°C to 50°C)and allowed to establish a steady state open circuit potential(OCP).The potentiodynamic current-potential curves were recorded by polarizing the specimen to−250 mV cathodically and+250 mV anodically with respect to open circuit potential(OCP)at a scan rate of 1 mV s−1.
2.3.2.Electrochemical impedance spectroscopy(EIS)studies
EIS measurements were carried out at the steady state open circuit potential(OCP)by the application of a periodic small amplitude(10 mV)ac voltage signal with a wide spectrum of frequency ranging from 100 kHz to 0.01 Hz.The impedance data were analyzed using Nyquist plots.The charge transfer resistance,Rct,wasextracted from thediameterofthe capacitive loop in the Nyquist plot.
In all the electrochemical measurements,at least three similar results were considered and their average values are reported.
2.4.Scanning electron microscopy(SEM)analysis
The surface morphology of the GA9 alloy specimens in the presence and absence of the corrosive medium was established by recording SEM images using JEOL JSM-6380LA.
3.Results and discussion
3.1.Potentiodynamic polarization measurements
The polarization measurements of GA9 magnesium alloy specimen were carried out in Na2SO4media of different concentrations and different medium pH at different solution temperatures.The potentiodynamic polarization curves for the corrosion of GA9 magnesium alloy in different concentrations of Na2SO4at pH 7 and at 40°C are represented in Fig.1.It is observed from Fig.1 that the polarization curves are shifted to the high current density region with the increase in the sulfate ion concentration,indicating an increased rate of corrosion. Similar plots have been obtained at other conditions of pH and temperatures under consideration.The anodic polarization curves do not exhibit distinct Tafel region and are assumed to represent anodic oxidation of magnesium.However,the cathodic branch of polarization curves showed linear behavior in the Tafel region and thought to represent cathodic hydrogen evolution through the reduction of water.The corrosion current density(icorr)was deduced from the extrapolation of cathodic branch of the Tafel plots to the corrosion potential.
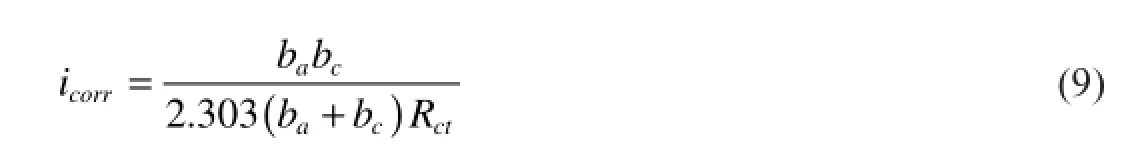
The potentiodynamic polarization parameters like corrosion potential(Ecorr),corrosion current density(icorr),cathodic slope (bc)werededucedfromtheTafelplotsandaretabulatedinTable2. The corrosion rate is calculated using Equation below[12].
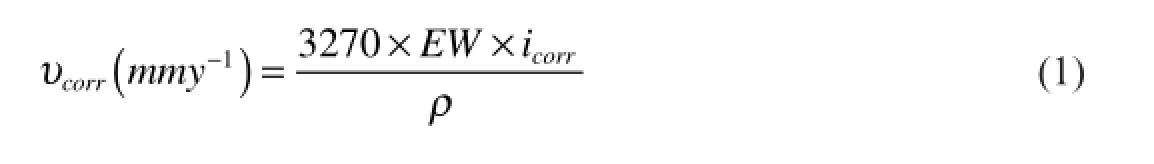
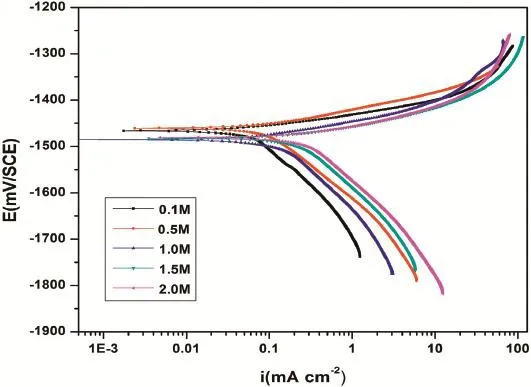
Fig.1.Potentiodynamic polarization curves for the corrosion of GA9 magnesium alloy in different concentrations of Na2SO4at 40°C.
where 3270 is a constant that defnes the unit of corrosion rate,icorris the corrosion current density inA cm−2,ρis the density of the corroding material,1792 kg m−3,EWis the equivalent weight of the alloy calculated using the equation shown below:
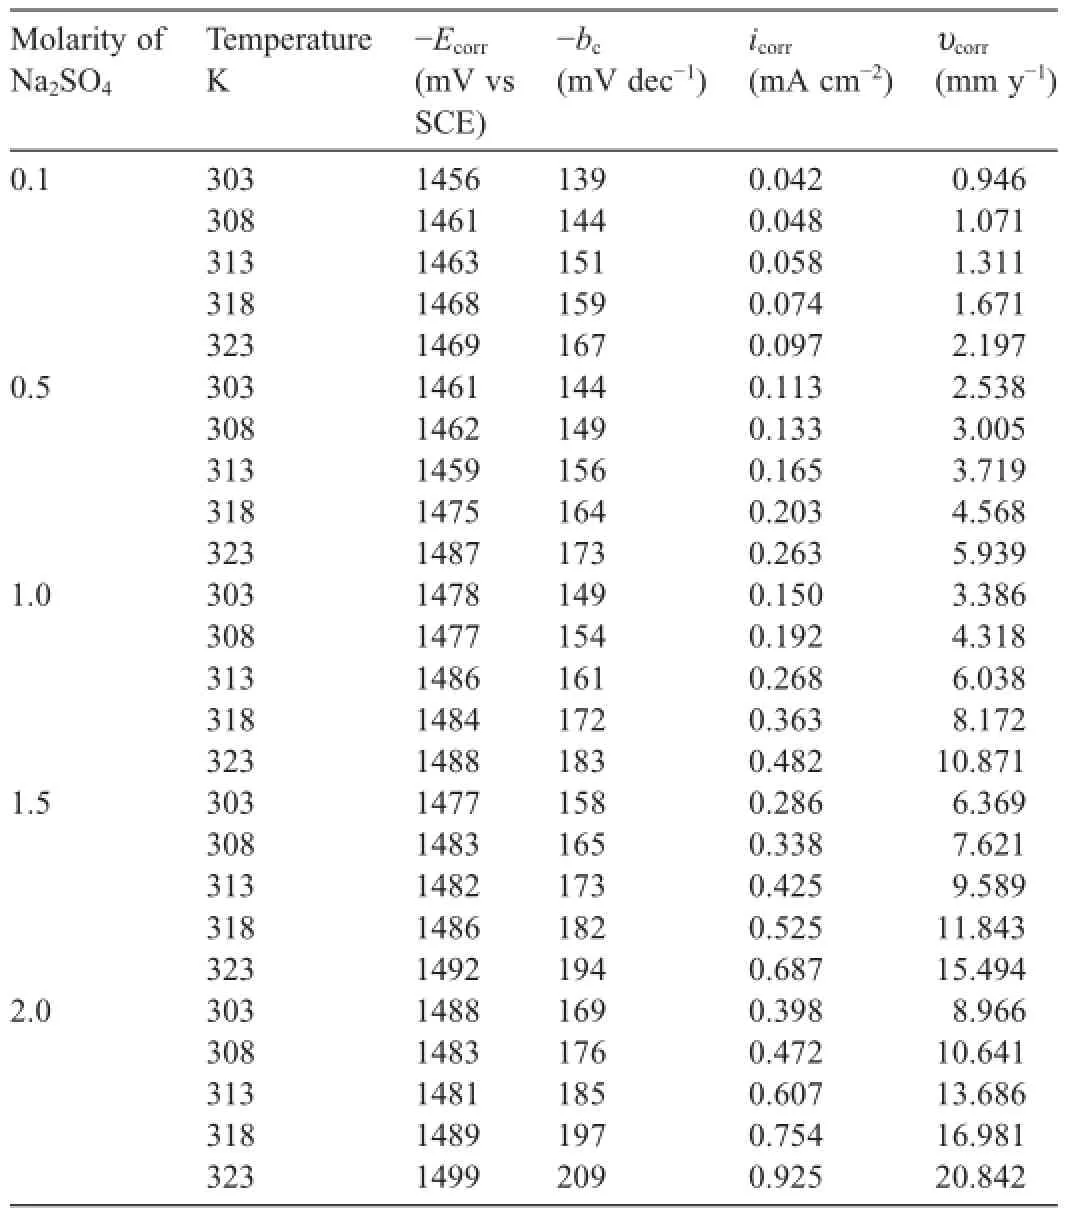
Table 2Electrochemical polarization parameters for the corrosion of GA9 magnesium alloy in different concentrations of Na2SO4at different temperatures.

wherefiis the weight fraction of the ithelement in the alloy,wiis the atomic weight of the ithelement in the alloy andniis the valence of the ithelement of the alloy[11]
It is evident from the data summarized in Table 2 that the corrosion rate of GA9 magnesium alloy increases with the increase in the concentration of sulfate ions in the solution. While sulfate is regarded as mild compared to corrosive chloride,it has been reported to have an appreciable infuence on the electrochemical behavior of pure magnesium and some of its alloys[1,3,7,13].The corrosiveness of sulfate ions toward magnesium and its alloys arises from their tendency to cause surface flm breakdown by transforming the deposited corrosion product,Mg(OH)2,to easily soluble MgSO4[14].As the concentration of sulfate increases in the solution,anodic branches are shifted to more negative(more active)potential direction, and cathodic branches are shifted to more positive potential direction.It is also observed that the corrosion potential is shifted to more negative values with the increase in sulfate ion concentration.While this trend of more negativeEcorrassociated with a higher rate of corrosion was observed by Baril and Pebere[1]for pure magnesium corrosion in sulfate medium and by Zhao et al.[15]for corrosion of magnesium zinc alloy in chloride medium.However,this behavior cannot be concluded as a phenomenon,as in most studies no direct relationship betweenEcorrand corrosion rate had been reported[16].
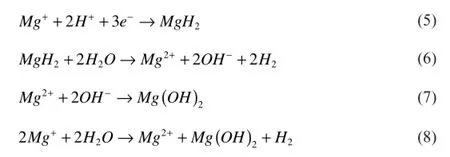
Magnesium is a very active metal due to its low standard electrochemical potential.In aqueous solutions,corrosion of magnesium converts metallic Mg into stable ion,Mg2+in two electrochemical steps,involving the uni-positive ion,Mg+having short-life intermediate,as represented by following reactions[6,16,17].

The standard electrode potential of magnesium is−2.38 V, but the steady state working potential is about−1.5 V.The difference in potential has been attributed to the formation of Mg(OH)2flm on the metal surface[18].As depicted in equations 3 and 4,the anodic dissolution of magnesium and its alloys involves two oxidation processes.At the most active potential around−2.78 V(vs SCE),magnesium is oxidized to monovalent magnesium ion and at a little higher potential of−1.56 V(vs SCE),the oxidation of magnesium ion to magnesium divalent ion takes place in parallel with the frst oxidation [5].As the monovalent magnesium ion is unstable,undergoes oxidation to divalent magnesium ion through a series of reactions involving unstable intermediate magnesium hydride as shown in the following equations.
The SEM image of the freshly polished surface of GA9 magnesium alloy,after etching in acetic-picral,is shown in Fig.2,which indicates the alloy as a dual phase alloy,consisting of a primary α-phase and a divorced eutectic β-phase,distributed along the grain boundaries of primary phase.The α-phase is an Mg-Al-Zn solid solution with the same crystal structure as pure magnesium and the β-phase is the discontinuous precipitate of inter-metallic compound Mg17Al12[19–21].The corrosion behavior of the alloy is decided by the corrosion tendency of the α-phase and the β-phase,indicating the infuence of the microstructure of multi-phase alloys like GA9,on the corrosion of the specimen.The α-Mg matrix corrodes due to its very negative free corrosion potential and there is the tendency for the corrosion rate of the α-Mg matrix to be accelerated by micro-galvanic coupling between the α-phase and the β-phase. The β-phase has a relatively low corrosion rate and it is a more effcient site for the cathodic reactions[8,9,22,23].However, the β-Mg17Al12phase may act as a barrier against corrosion propagation if it is in the form of a continuous network[8,22]. The corrosion of the alloy in the sulfate media indicates the discontinuities in the β-phase.According to reports in the literature,magnesium alloys exhibit higher corrosion resistance than pure magnesium[8].The improvement of the corrosion behavior of Mg alloys due to the alloying elements has been attributed to a number of factors such as refning of the β-phase and formation of more continuous network,suppression of β-phase formation by forming another intermetallic,which is less harmful to the α-Mg matrix,and added elements may incorporate into the protective flm and thus increasing its stability[24–26].Small additions of Mn have been reported to increase the corrosion resistance of magnesium alloys and reduce the effects of metallic impurities[27,28].The presence of aluminum has also been reported to enhance the corrosion resistance of the magnesium alloy[23,29–31].
3.2.Electrochemical impedance spectroscopy(EIS)
The Nyquist plots for the corrosion of GA9 specimen in sulfate solutions of different concentrations at pH 7 and at 40°C are shown in Fig.3.Similar plots were obtained at other conditions of concentrations of sulfate,pH and temperatures also.
The Nyquist plots consists of a capacitive loop,extended from high frequency(HF)to low frequency(LF)range,an inductive loop in the low frequency region(LF)range and a tail at the medium frequency(MF)range.The high frequency capacitive loop is usually due to the charge transfer resistance and the double layer capacitance at the metal solution interface [32,33].The low frequency inductive loop is due to existence of relaxation processes of adsorbed species on the electrode surface[1]or due to partial protection of the discontinuoussurface oxide flm[23]or due to the presence of adsorbed surface ions Mg(OH)+,Mg(OH)2and Mg+[8,10].Also the tail in the medium frequency range correlates with the rupture of native corrosion product flm[34].The charge transfer resistance(Rct)and the double layer capacitance(Cdl)are deduced from the analysis of a higher frequency capacitive loop[35,36].
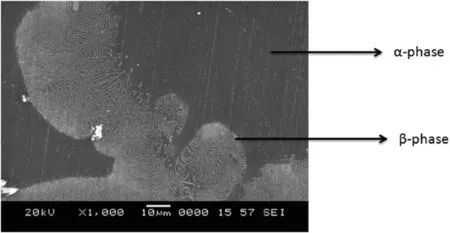
Fig.2.SEM image of the GA9 magnesium alloy surface after etching in acetic-picral,showing the α-and β-phases.
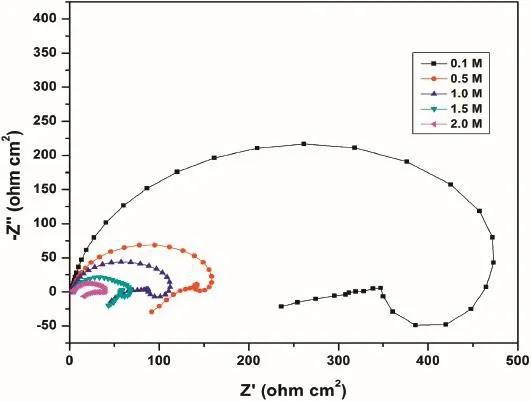
Fig.3.Nyquist plots for the corrosion of GA9 magnesium alloy in different concentrations of Na2SO4at 40°C.
The corrosion current density is calculated using the Stern–Geary equation:
The decrease in the diameter of the capacitive loop with the increase in the concentration of sulfate ions,as seen in Fig.3, indicate the decrease inRctvalue and increase in the corrosion rate.The results of EIS measurements are listed in the Table 3.
The variation ofRctandCdltogether hint that at lower sulfate concentrations,the protective flm on the alloy surface is affected to a lesser extent or the protective layer remains more intact on the alloy surface offering considerable extent of protection to the underlying alloy,hence the lower rate of corrosion.The scenario is reversed at higher sulfate concentrations, which can be accounted by taking into consideration of the tendency of sulfate ions to destabilize the Mg(OH)2surface flm by dissolution.These results are well in agreement with the results obtained from potentiodynamic polarization measurements.
The impedance results are best understood when interpreted through equivalent circuit models simulating the electrochemical behavior of alloy-medium interface.The circuit ftment was done by ZSimpWin software of version 3.21.Fig.4 shows the simulation of the impedance data points.The equivalent circuit modeling of the electrochemical behavior of the interface is shown at the right hand side of Fig.4.
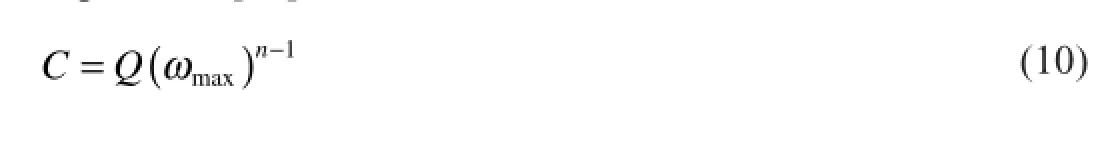
The equivalent circuit comprises fve circuit elements,Rerepresenting the electrolyte resistance,Rcstanding for thecharge transfer resistance,Lis the inductance andRLis the resistance of the inductor element.The capacitive loops appear as depressed semicircles,as a result of porous,non-uniform and heterogeneous electrode surface causing frequency dispersion during impedance analysis.The constant phase element(CPE) is substituted for ideal capacitive element for a better ft of depressed capacitive loop.The real capacitance after accounting for frequency dispersion was deduced using the following expression[37]: whereQis the CPE constant,ωmaxis the frequency at which the imaginary part of the impedance(Z”)has a maximum and n is a CPE exponent which provides a measure of the unevenness of the electrode surface.The value ofnis given by(−1≤n≤1); whenn=1,CPE behaves like an ideal capacitor.
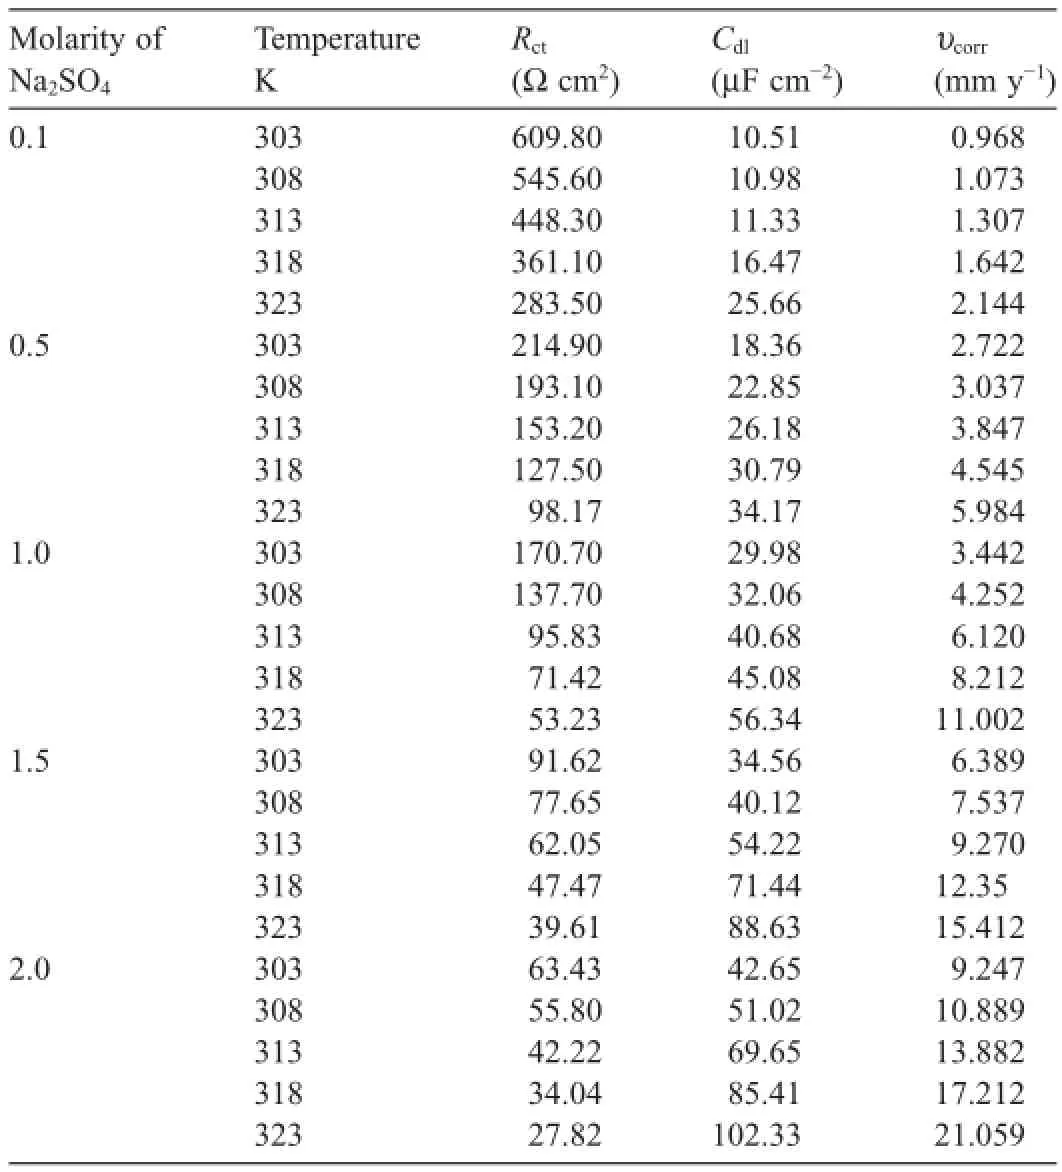
Table 3Impedance parameters for the corrosion of GA9 magnesium alloy in different concentrations of Na2SO4at different temperatures.
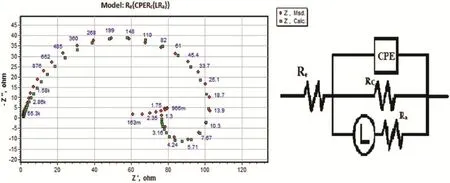
Fig.4.The equivalent circuit model used to ft the experimental data for the corrosion of GA9 magnesium alloy in 0.5 M Na2SO4solution of pH 7 at 50°C.
3.3.Effect of pH
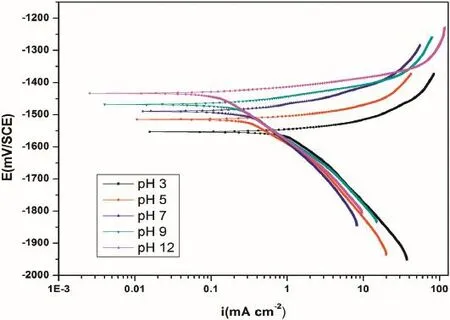
Fig.5.Potentiodynamic polarization curves for the corrosion of GA9 magnesium alloy in 2 M Na2SO4solutions of different pH at 30°C.
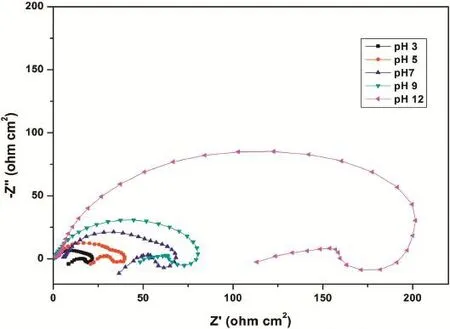
Fig.6.Nyquist plots for the corrosion of GA9 magnesium alloy in 2 M Na2SO4solutions of different pH at 30°C.
The effect of varying pH on the corrosion behavior of GA9 magnesium alloy was studied by measuring the corrosion rates at different pH values in the range 3–12.The results confrm the infuential role of the medium pH in GA9 alloy corrosion. Figs.5 and 6 representpotentiodynamic polarization curves and Nyquist plots,respectively,at different pH for the corrosion of GA9 magnesium alloy in 2 M Na2SO4at 30°C. Similar plots were obtained at other concentrations and temperatures also.
As seen from Fig.5,polarization curves shift to the higher current density region implying an increased corrosion rate as the medium pH decreases from highly basic(pH=12)to highly acidic(pH=3)conditions.From Fig.6 it is clear that the diameter of the semicircle in the Nyquist plots decreases with the decrease in pH,indicating the decrease inRctvalue and increase in corrosion rate.
The corrosion behavior of magnesium and its alloys in a wide range of pH can be best explained by the Pourbaix diagram for pure magnesium as shown in Fig.7[38].The Pourbaix diagram,a potential—pH plot represents the stability of metallic magnesium and its corrosion product magnesium hydroxide(Mg(OH)2)as a function of the potential and pH of aqueous solutions.The overall corrosion reaction of magnesium can be summarized as per the following reactions [39]:

The anodic reaction involves dissolution of magnesium as Mg2+,the cathodic reaction is the hydrogen evolution by the reduction of water.Because of the low solubility,Mg(OH)2precipitates creating a surface layeron the corroding metal.According to the Pourbaix diagram,the corrosion product Mg(OH)2is stable only in alkaline conditions, with pH above 10.5.Even though Mg(OH)2is thermodynamically unstable atpH below 10.5,metallic magnesium can readily develop the Mg(OH)2surface flm even at acidic pH values,if the dissolution rate of Mg(OH)2is lower than the rate of its formation.Moreover,as a result of the cathodic reaction of hydroxyl ion generation,an alkaline pH zone develops at the electrode interface,which facilitates Mg(OH)2precipitation and flm formation,even when the bulk pH is acidic [15].

Fig.7.Potential-pH(Poubaix)diagram for the system of magnesium and water at 25°C,showing theoretical domains of corrosion,immunity and passivation.
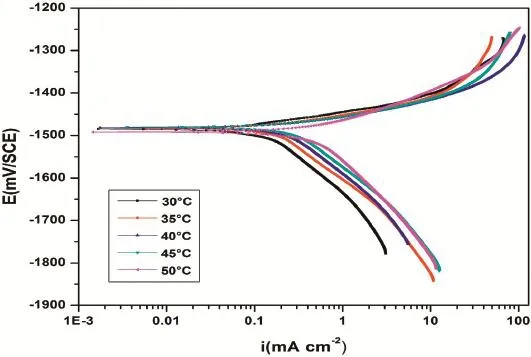
Fig.8.Potentiodynamic polarization curves for the corrosion of GA9 magnesium alloy in 1.5 M Na2SO4at different temperatures.
With the above mechanism,the observed trend of the increased corrosion rate of GA9 alloy with the decrease of pH at every sulfate concentration was tested.At alkaline conditions the Mg(OH)2surface flm is highly stable and protective,resulting in a slow corrosive attack.The decrease in medium pH increases the solubility of the surface flm,which accounts for the higher corrosion rates in acidic media. However,the corrosion rate observed in alkaline media is signifcant,though small.This is because the Mg(OH)2surface flm is thin with a Pilling–Bedworth ratio~0.81[40]and the flm is discontinuous and partially protective,hence incapable of imparting complete passivity to the underlying metal. This results in the corrosion reactions taking place predominantly at the breaks and imperfections of the flm[41–43].Also, bothEcorrandbcgradually change with varying pH,which shows that pH of the medium do infuence on the kinetics of cathodic hydrogen evolution and anodic metal dissolution reactions.

Fig.9.Nyquist plots for the corrosion of GA9 magnesium alloy in 1.5 M Na2SO4at different temperatures.

Fig.10.Arrhenius plots for the corrosion of GA9 magnesium alloy in Na2SO4solution.
3.4.Effect of temperature
The effect of temperature on the corrosion behavior of GA9 magnesium alloy was studied by measuring the corrosion rates at different temperatures between 30°C and 50°C.Figs.8 and 9 represent the potentiodynamic polarization curves and Nyquist plots,respectively,for the corrosion of GA9 alloy at different temperatures in 1.5 M Na2SO4solution.Similar plots were obtained at other solution concentrations as well.With the increase in the medium temperature,the polarization curves shift to the higher current density region and the capacitive loops in Nyquist plots shrink in diameter,both indicating the increased rate of corrosion.
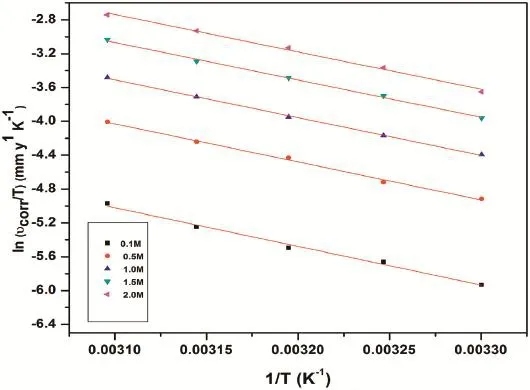
Fig.11.Plots of ln(υcorr/T)vs 1/T for the corrosion of GA9 magnesium alloy in Na2SO4solution.

Table 4Activation parameters for the corrosion of GA9 magnesium alloy in Na2SO4solution.
The temperature effect is more apparent from the Tafel polarization results and EIS results at different temperatures as listed in Tables 2 and 3,respectively.The values ofbcandRctchange with the varying temperature,which indicate the infuential role of temperature in the kinetics of the corrosion reactions.However,the basic shape of polarization curves and Nyquist plots remain unaltered,which illustrate that temperature modifes only the rate of alloy corrosion but not the mechanism.A smaller value ofCdlin combination with largerRctis observed at lower temperatures which indicates,respectively, that the thickness and protective performance of the surface flm are good at lower temperatures;in other words,the dissolution of Mg(OH)2surface flm occurs at higher temperatures [16].
Activation energy(Ea)values for the corrosion reaction of GA9 magnesium alloy in Na2SO4solutions were calculated from the Arrhenius equation.


Fig.13.SEM images of the alloy surface after 1 h immersion in 2 M Na2SO4solution of(a)pH 3,(b)pH 7 and(c)pH 12.
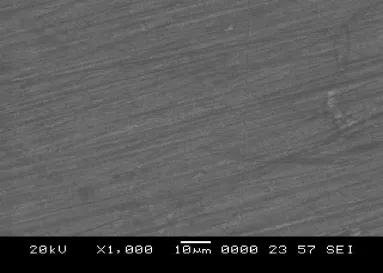
Fig.12.SEM image of freshly polished GA9 magnesium alloy surface.
whereBis a constant which depends on the metal type,andRis the universal gas constant.The plot of ln(υcorr)versus reciprocal of absolute temperature(1/T)gives a straight line whose slope=-Ea/R,from which the activation energy values for the corrosion process were calculated.The Arrhenius plotsfor the corrosion of GA9 magnesium alloy specimen in Na2SO4solutions of different concentrations are shown in Fig.10.

Fig.14.EDX image of freshly polished surface of GA9 magnesium alloy surface.
The transition state theory Equation(15)was used for the calculation of enthalpy of activation(ΔH#)and entropy of activation(ΔS#)for the corrosion of the alloy.

wherehis Planck’s constant,andNis Avagadro’s number andRis the ideal gas constant.The plots of ln(υcorrr/T)versus 1/Tfor the corrosion of GA9 magnesium alloy in different concentrations of sodium sulfate are shown in Fig.11.The activation parameters calculated are listed in the Table 4.
TheEavalue or the energy barrier for the occurrence of corrosion reaction reduces with the increased sulphate ion concentration,which implies that the corrosion is thermodynamically more favored in the concentrated media.The entropy of activation is negative;implying the activated complex in the rate-determining step represents association rather than dissociation,indicating that a decrease in randomness takes place on going from the reactants to the activated complex[44].
3.5.SEM nd EDX analysis of the alloy surface
The effect of corrosion on the surface morphology of the alloy was analyzed by recording the SEM images of the alloy specimen surface.The SEM image of a freshly polished surface of GA9 alloy is shown in Fig.12,which shows the uncorroded surface with few scratches due to polishing.

Fig.15.EDX image of the corroded surface of GA9 magnesium alloy after 1 h immersion in 2 M Na2SO4solution of pH 3.
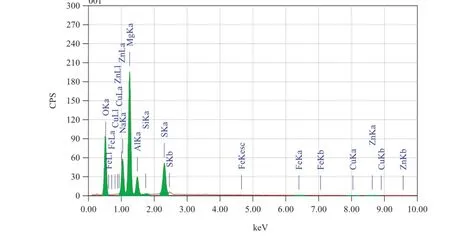
Fig.16.EDX image of the corroded surface of GA9 magnesium alloy after 1 h immersion in 2 M Na2SO4solution of pH 7.
Fig.13a–c are SEM images of the GA9 alloy surfaces after 1 hour of immersion in 2 M Na2SO4solutions of pH 3,pH 7 and pH 12,respectively.From the fgure,it can be seen that,at lower pH values,surface of the GA9 alloy is extensively corroded (Fig.13a),with the corrosion pits distributed almost on the entire surface.The extent of corrosion effect is reduced in the neutral pH(Fig.13b)and the effect is least in alkaline pH(Fig.13c).
The energy dispersion X ray(EDX)images of a freshly prepared surface of the alloy,corroded surface in Na2SO4solutions of pH 3,pH 7 and pH 12 are shown in Figs.14–17, respectively.The EDX profle of the non-corroded sample shows peaks corresponding to Mg,Al,Mn and Zn.Additional peaks corresponding to O,S and Na are seen in the EDX profle of the corroded specimens.In addition to the above,it is also seen that magnesium peak is reduced on the corroded surfaces. The oxygen peak is attributed to the presence of Mg(OH)2
formed at the alloy surface as a result of corrosion.The peaks corresponding to S and Na can be attributed to the electrolyte.
4.Conclusions
•The corrosion behavior of GA9 magnesium alloy in Na2SO4solutions is strongly infuenced by both the concentration of the sulfate in the medium and its pH.
•The corrosion rate increases with the increase in the concentration of sodium sulfate,increase in the temperature and decrease in the pH of the medium.
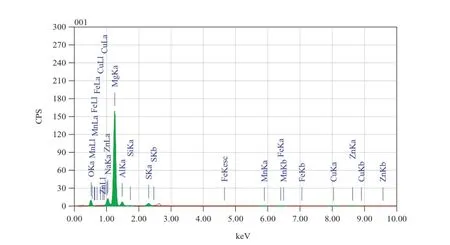
Fig.17.EDX image of the corroded surface of GA9 magnesium alloy after 1 h immersion in 2 M Na2SO4solution of pH 12.
•The Mg(OH)2surface flm is partially protective due to imperfections like breaks and non-uniformity.Higher ionic concentrations,lower pH and higher temperatures further destabilize the surface flm possibly by dissolution.
•The results of electrochemical studies in combination with surface analysis confrm the formation of Mg(OH)2flm on the surface of the corroding specimen.
•The corrosion kinetics of GA9 magnesium alloy in Na2SO4medium follows Arrhenius law.
Declaration
The present work has not been supported by any funding agency.
[1]G.Baril,N.Pebere,Corros.Sci.43(2001)471–484.
[2]J.Hu,D.Zeng,Z.Zhang,T.Shi,G.L.Song,X.Guo,Corros.Sci.74 (2013)35–43.
[3]T.Yun,Y.L.Jing,L.Y.Fang,W.Y.Hui,H.L.Feng,L.Y.Gong,et al.,Trans. Nonferrous Met.Soc.China 21(2011)912–920.
[4]L.J.Liu,M.Schlesinger,Corros.Sci.51(2009)1733–1737.
[5]M.G.Lopez,B.Natta,J.Sci.Eng.57(2001)712–720.
[6]Q.Qu,J.Ma,L.Wang,L.Li,W.Bai,Z.Ding,Corros.Sci.53(2011) 1186–1193.
[7]L.J.Yang,Y.H.Wei,L.F.Hou,D.Zhang,Corros.Sci.52(2010)345–351.
[8]W.A.Badawy,N.H.Hilal,M.E.Rabiee,H.Nady,Electrochim.Acta 55 (2010)1880–1887.
[9]R.Ambat,N.N.Aung,W.Zhou,Corros.Sci.42(2000)1433–1455.
[10]J.Chen,J.Wang,E.Han,J.Dong,W.Ke,Electrochim.Acta 52(2007) 3299–3309.
[11]G.Song,A.Atrens,D.S.John,X.Wu,J.Nairn,Corros.Sci.39(1997) 1981–2004.
[12]M.G.Fontana,Corrosion Engineering,McGraw-Hill,Singapore,1987,p. 173.
[13]R.Ambat,N.N.Aung,W.Zhou,J.Appl.Electrochem.30(2000) 865–874.
[14]H.Altun,S.Sen,Mater.Des.25(2004)637–643.
[15]M.C.Zhao,M.Liu,G.Song,A.Atrens,Corros.Sci.50(2008) 3168–3178.
[16]N.Dinodi,A.N.Shetty,J.Magnesium Alloys 1(2013)201–209.
[17]Z.Shi,A.Atrens,Corros.Sci.53(2011)226–246.
[18]R.Udhayan,D.P.Bhatt,J.Power Sources 63(1996)103–107.
[19]G.Song,A.Atrens,X.Wu,B.Zhang,Corros.Sci.40(1998)1769–1791.
[20]L.Wang,B.P.Zhang,T.Shinohara,Mater.Des.31(2010)857–863.
[21]F.H.Froes,D.Eliezer,E.Aghion,JOM 50(1998)30–34.
[22]M.C.Zhao,M.Liu,G.Song,A.Atrens,Corros.Sci.50(2008) 1939–1953.
[23]Y.L.Cheng,T.W.Qin,H.M.Wang,Z.Zhang,Trans.NonferrousMet.Soc. China 19(2009)517–524.
[24]W.Guohua,F.Yu,G.Hongtao,Z.Chunquan,Z.Y.Ping,Mater.Sci.Eng. A 408(2005)255–263.
[25]F.Yu,W.Guohua,Z.Chunquan,Mater.Sci.Eng.A 433(2006)208–215.
[26]F.Yu,W.Guohua,G.Hongtao,L.Guanqun,Z.Chunquan,J.Mater.Sci. 41(2006)5409–5417.
[27]B.E.Carlson,J.W.Jones,Light Metals Processing andApplications,1993. METSOC Conference,Quebec.
[28]I.J.Polmer,PhysicalMetallurgy ofMagnesium Alloys,DGM Informationsgesellschaft,Oberursel,Germany,1992,p.201.
[29]O.Lunder,J.E.Lein,T.K.Aune,K.Nisancioglu,Corros.Sci.45(1989) 741–748.
[30]T.J.Warner,N.A.Thorne,G.Nussbaum,W.M.Stobbs,Surf.Interface Anal.19(1992)386–392.
[31]F.Hehmann,F.H.Froes,J.Metals 39(1987)14–21.
[32]C.M.A.Brett,L.Dias,B.Trindade,R.Fischer,S.Mies,Electrochim.Acta 51(2006)1752–1760.
[33]G.Baril,G.Galicia,C.Delsouis,N.Pebere,B.Tribollet,V.Vivier,J. Electrochem.Soc.154(2007)108–113.
[34]D.Song,A.Ma,J.Jiang,P.Lin,D.Yang,J.Fan,Corros.Sci.52(2010) 481–490.
[35]G.Song,D.St John,Corros.Sci.46(2004)1381–1399.
[36]H.Ardelean,I.Frateur,P.Marcus,Corros.Sci.50(2008)1907–1918.
[37]N.Dinodi,A.N.Shetty,Corros.Sci.85(2014)411–427.
[38]M.Pourbaix,Atlas of Electrochemical Equilibria Aqueous Solutions, NACE,Houston,1974,p.139.
[39]M.Baghni,Y.Wu,J.Li,W.Zhang,Trans.Nonferrous Met.Soc.China 14 (2004)1–10.
[40]K.W.Guo,Recent Patents Corros.Sci.2(2010)13–21.
[41]G.Song,A.Atrens,Adv.Eng.Mater.1(1999)11–33.
[42]G.Song,A.Atrens,Adv.Eng.Mater.5(2003)837–858.
[43]G.Song,A.Atrens,Adv.Eng.Mater.9(2007)177–183.
[44]M.Boulakh,B.Hammouti,M.Benkaddour,T.Benhadda,J.Appl. Electrochem.35(2005)1095–1101.
Received 5 June 2015;revised 23 July 2015;accepted 28 July 2015 Available online 28 September 2015
*Corresponding author.Department of Chemistry,National Institute of Technology Karnataka, Surathkal, Srinivasnagar, Mangalore 575025, Karnataka,India.Tel.:+91 9448779922;fax:+92 8242474033.
E-mail address:nityashreya@gmail.com(A.N.Shetty).
http://dx.doi.org/10.1016/j.jma.2015.07.004
2213-9567/©2015 Production and hosting by Elsevier B.V.on behalf of Chongqing University.
©2015 Production and hosting by Elsevier B.V.on behalf of Chongqing University.
杂志排行
Journal of Magnesium and Alloys的其它文章
- GUIDE FOR AUTHORS
- Research of growth mechanism of ceramic coatings fabricated by micro-arc oxidation on magnesium alloys at high current mode
- Infuence of solution treatment on microstructure,mechanical and corrosion properties of Mg-4Zn alloy
- Effect of experimental parameters on the micro hardness of plasma sprayed alumina coatings on AZ31B magnesium alloy
- Electrochemical deposition of Mg(OH)2/GO composite flms for corrosion protection of magnesium alloys
- Effect of temperature and strain rate on compressive response of extruded magnesium nano-composite