Merhod for Evaluaring Insranraneous Secror Capaciry
2015-02-09ZhaoZheng赵征YangLei杨磊HuMinghua胡明华LiuGuoyi刘国毅
Zhao Zheng(赵征),Yang Lei(杨磊),Hu Minghua(胡明华),Liu Guoyi(刘国毅)
College of Civil Aviation,Nanjing University of Aeronautics and Astronautics,Nanjing 210016,P.R.China
(Received 13 November 2014;revised 10 December 2014;accepted 19 December 2014)
Merhod for Evaluaring Insranraneous Secror Capaciry
Zhao Zheng(赵征)*,Yang Lei(杨磊),Hu Minghua(胡明华),Liu Guoyi(刘国毅)
College of Civil Aviation,Nanjing University of Aeronautics and Astronautics,Nanjing 210016,P.R.China
(Received 13 November 2014;revised 10 December 2014;accepted 19 December 2014)
Absrracr:A method for evaluating instantaneous sector capacity based on the workload of air traffic controller(ATC)is developed.The basic characteristics of the assessed sector is described and a model to correlate the workload with the instantaneous sector capacity is developed using workload data.The correlation between the regional sector/approach sector capacity and the traffic flow organization is analyzed.Experimental results show that the instantaneous sector capacity assessment is reasonable and the instantaneous capacity is strongly correlated with the spatial and temporal distributions of the traffic flow and the sector operation mode.These results can provide an important reference for sector operation safety,capacity prediction,air traffic management,and airspace design.
air traffic controller(ATC)workload;control sector;instantaneous capacity
0 Inrroducrion
Sector capacity assessments are very important in airspace operation safety,airspace design and flight flow management.The sector capacity can be primarily classified into a period capacity and an instantaneous capacity.The period capacity is a measure of the maximum number of aircraft that the sector operating position can serve during a certain period of time.The instantaneous capacity is a measure of the maximum number of aircraft that the sector operating position can serve simultaneously.The Chinese civil aviation air traffic management regulations state that under normal conditions,an approach sector operating position can simultaneously provide radar service to no more than eight aircraft,and the regional sector operating position can simultaneously provide radar service to no more than 12 aircraft[1].The number of aircraft that can be simultaneously served by radar corresponds to the instantaneous capacity.The instantaneous capacity plays an important role in supporting the air traffic controller(ATC)in task planning,mental preparation,predicting the remaining airspace capacity,and traffic flow management.However,in practice,the guidelines for the instantaneous capacity in the Chinese civil aviation air traffic management regulations are incompatible with current air traffic control conditions.ATC has not provided any scientific basis for its objective judgments on instantaneous sector capacity. Therefore,there is an urgent need to develop scientific and reasonable methods to assess the instantaneous sector capacity.Welch and Andrews[2]developed an analytical relationship between the instantaneous sector capacity and the sector volume in 2007.The primary goal is to correlate the number of aircraft in the sector with the sector volume at which the ATC workload reaches 80%of the total capacity and to thereby infer a universal relationship between the instantaneous sector capacity and the sector volume. The limitation of this method is that an instantaneous sector capacity derived from a static sector volume is also a static capacity.In this paper,when the sector volume does not change,the instantaneous sector capacity remains strongly correlated with the traffic flow organization in thesector.In addition,the reasonable workload distribution of ATC is not considered in the aforementioned method,i.e.,workloads of 90%must not be exceeded more than 2.5%of the time[3]. In 2012,Federal Aviation Administration(FAA)defined the correlation between the average sector flight time and the maximum instantaneous capacity(Monitor alert parameter,MAP)in its newly released order[4].However,the key issue of MAP is that the sector maximum instantaneous capacity cannot be determined solely on the basis of the average time for aircraft to pass through the sector.For example,even when aircraft pass through the sector in the average time,the ATC workload imposed by an aircraft on a single route is different from the workload for an aircraft on an intersecting route.Thus,the maximum instantaneous capacity is also different[5].
In this paper,the sector routes/flight path structure,the temporal-spatial distribution of the traffic flow and the operation mode are comprehensively investigated to correlate the instantaneous sector capacity with the ATC workload.A method for evaluating the instantaneous sector capacity based on the ATC workload is developed in accordance with the related provisions in International Civil Aviation Organization document,ICAO 9426.The correlation between the sector traffic flow organization and the instantaneous sector capacity is also analyzed.
1 ATC Workload Model
The ATC workload is divided into the communication workload,the non-communication workload and the mental workload.The communication workload is the time spent in communication between ATC and the pilot for each direction and flight path in a sector.The non-communication workload is the time spent in filling the flight progress strips and on equipment operation,among other functions.The mental workload is the average thinking time used for specific actions such as calculating the aircraft navigational elements and judging and resolving conflicts while an aircraft is flying on an assigned route through a sector[6].Real-time statistical results for various activities of ATC during the directing process are used in a formula to calculate the corresponding ATC workload.
2 Kernal Algorirhm for Assessing Insranraneous Secror Capaciry
2.1 Paramerer definirions
Parameter definitions are shown in Table 1.
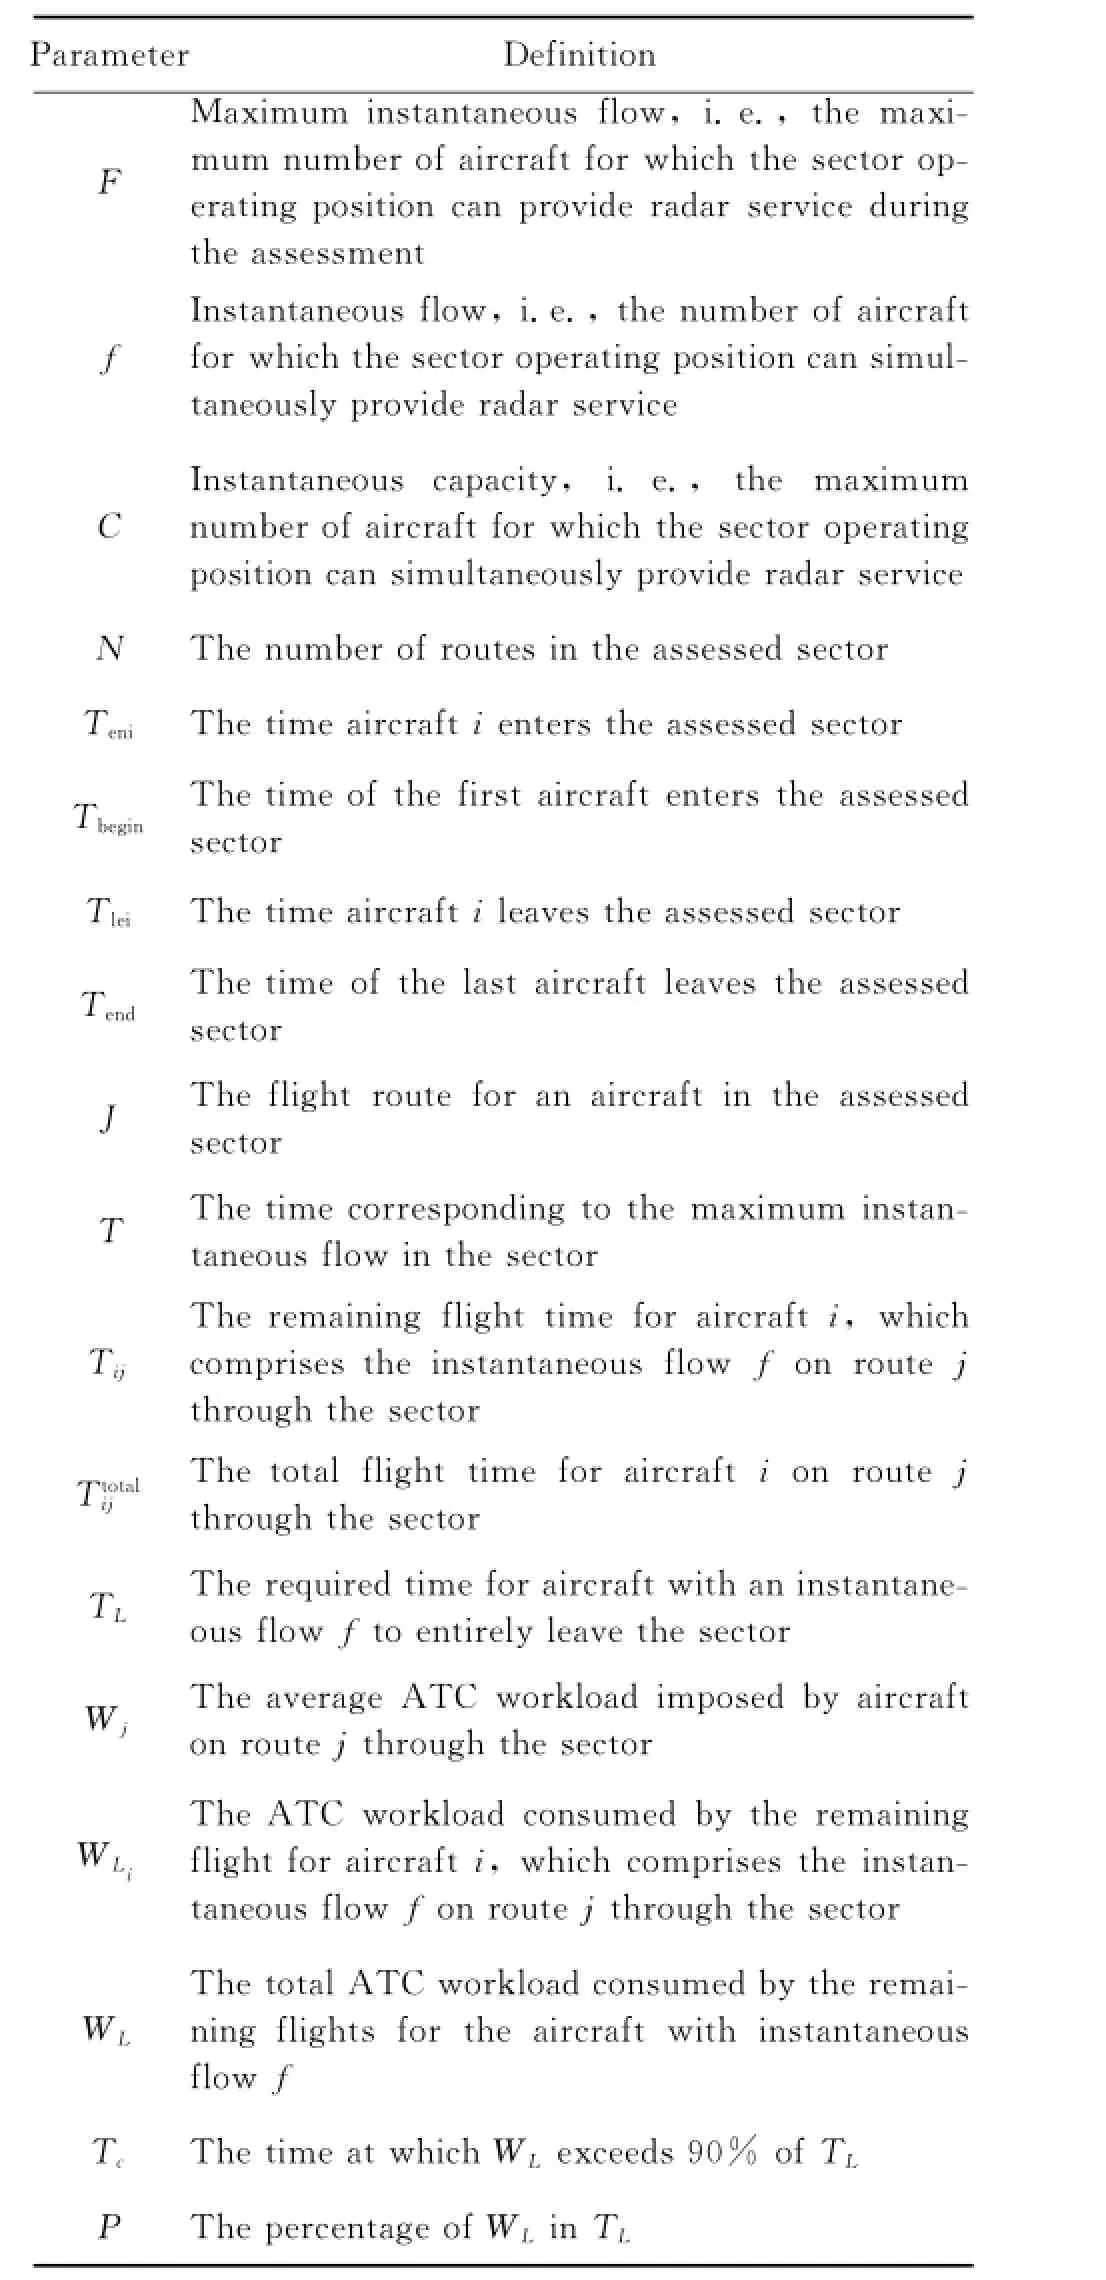
Table 1 Definirions of assessmenr paramerers
2.2 Underlying concepr and assessmenr procedure
The underlying concept of the assessment method for the instantaneous sector capacity is that,after assessing the basic characteristics of a sector(e.g.,the airspace structure and the flow distribution),the workload of ATC for handling current aircraft in a certain sector is calculated by the ATC workload data collected on-site and statistical route travel time.The maximum number of aircraft that ATC can simultaneously control is determined in accordance with the related rules stated in ICAO9426,i.e.,the average workload at capacity must be less than 80%and workloads of 90%must not be exceeded more than 2.5%of the time[3].
2.2.1 Procedure
The primary steps in the procedure for assessing the instantaneous sector capacity based on the ATC workload are given below.
Srep 1Count the number of routes in the sector,N.
Srep 2Calculate the flow allocation ratio for each route in the sector.
Srep 3Record the time for each aircraft entering and leaving the sector Teni,Tleiand route j and calculate the total flight time for aircraft i on route j in the sector

Srep 4Determine the time T of the maximum instantaneous flow F of the sector as follows:
Set the time interval of sector operation period[Tbegin,Tend],where Tbegin=min(Teni),Tend= max(Tlei).
Set time step length for one second and calculate the instantaneous aircraft number N(ti)at time ti,ti∈[Tbegin,Tend].

where N(ti)=F.
Srep 5Record aircrafts operating in the sector at time T and calculate their remaining flight time of aircraft i according to the aircraft distribution,denoted by Tij=(Tlei-T),respectively.

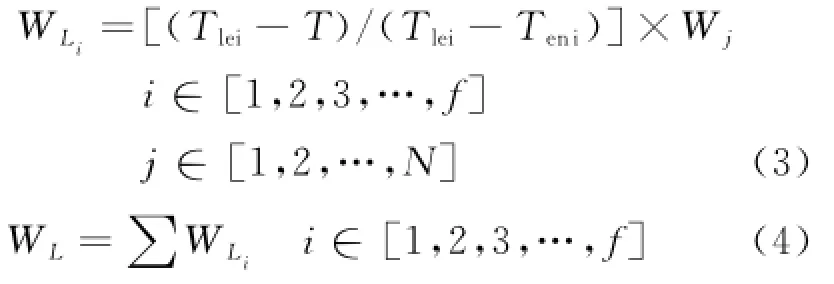
Srep 6Statistically analyze Tijand its maximum value TLSrep 7Calculate WLiusing Wj,T,Teniand Tleiand the sum of WLi,WLSrep 8Calculate Tcand P that correspond to the instantaneous flow f
Srep 9If Tc<TL×2.5%and P<80%,go to Step 10 and C=f;Otherwise,go to Step 11.
Srep 10If Tc>TL×2.5%,f=f-1 and go to Step 6;Otherwise,if P>80%,f=f-1 and go to Step 6.
Srep 11Add the flights to the maximum instantaneous flow F,in accordance with the flow allocation ratio for each path in the sector and the empirical arrival time distribution of aircraft.Repeat Step 6 until C in Step 9 is determined.
This assessment procedure is shown in Fig.1.
2.2.2 Procedure for flight increments
The primary steps for adding flights to the maximum instantaneous flow are given below. The full procedure is shown in Fig.2.
Srep 1The distribution function for the flight arrivals at each route entrance,Dn,where n∈(1,…,N),is determined by using historical radar track statistics.
Srep 2The cumulative route ratio(β1,…,βN),whereβn=100(α1+…+αn),is determined in accordance with the set flow ratio(α1,…,αN),whereα1+…+αN=1.A sequence of random numbers is generated by using the linear congru-ential method,Xm+1=(a·Xm+b)mod(100). X0is a random initial value.If Xm∈(βn,βn+1],then the flight is assigned to route n+1.Otherwise,it is assigned to route l.

Fig.1 Flow chart for assessing instantaneous sector capacity
Srep 3The time of the peak instantaneous flow is the time at which an incremental flight enters the route.
Srep 4Assume that n is the assigned route for a current flight and determine whether it is the first time flights have been assigned to this route.If yes,go to Step 5;otherwise,go to Step 6.
Srep 5Revise the remaining flight time for the preceding incremental flight on route n in accordance with the flight-arrival distribution function.
Srep 6The flight increment procedure is complete.

Fig.2 Incrementing flight flow
3 Example Assessmenr and Analysis
The operation data for control sector 14 in Shanghai area are used to illustrate the method for assessing the instantaneous sector capacity by using control data collected at a control site.The operation cases for sector 14 controlled by Shanghai area and sector 01 controlled by the Nanjing approach are studied to correlate the relationship between instantaneous capacity and traffic flow organization for the sector.
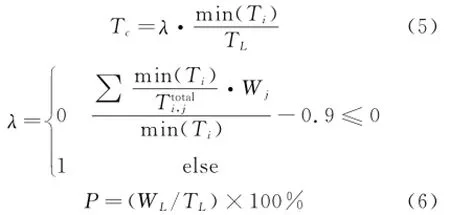
3.1 Assessmenr of insranraneous secror capaciryFig.3 is a schematic for control sector 14 in Shanghai area.Table 2 shows the flight flow parameters at the maximum instantaneous flow in this sector under a typical flow ratio F,and Table 3 shows the flight flow parameters at the incremented instantaneous capacity C.Fig.4 shows the typical flow distribution for the sector,theflow distribution at the maximum flow F and the flow distribution at the instantaneous capacity C.
Fig.3 Structural diagram for sector 14 in Shanghai area

Fig.4 Flow distribution for assessed sector
Fig.3 shows that the primary flight paths for sector 14 in Shanghai area,including ZJ-GSMADUK,MADUK-GS-RANGA,RANGA-GSMADUK,and MADUK-GS-ESBAG.
Table 2 shows that there are 12 flights in the sector at the maximum flow F,in accordance with the temporal-spatial characteristics of the sector flight flow distribution during the assessment.The remaining flight time and workload for each aircraft on each route are recorded.The statistical and incrementing calculations are then performed in accordance with the procedure(See Fig.1).The distribution function for the flight arrivals,Dn,follows a Poisson distribution.The instantaneous capacity C is then solved.
The flight distribution and the workload distribution for the instantaneous capacity are shown in Table 3.The instantaneous capacity for sector 14 in Shanghai area is 16 flights,which is 4 flights more than the maximum instantaneous flow(12 flights)during the assessment.At this time,the remaining workload(WL)accounts for 74.9%of the remaining work time(TL),i.e.,P=74.9%,which conforms to the requirements and rules in ICAO9426.
Fig.4 shows the relationship among the typical route flow ratio distribution for sector 14 in Shanghai area,the flight flow ratio distribution at the instantaneous capacity and the route flowratio distribution at the peak instantaneous flow. The route flow ratio distribution at the peak instantaneous flow is similar to the typical route flow ratio distribution for the sector.The route flow ratio distribution at the instantaneous capacity after the incrementing procedure is also similar to the typical flow ratio distribution,suggesting that the calculated instantaneous capacity of 16 flights follows a typical route flow ratio distribution.

Table 2 Paramerers for secror ar rhe maximum insranraneous flow F s
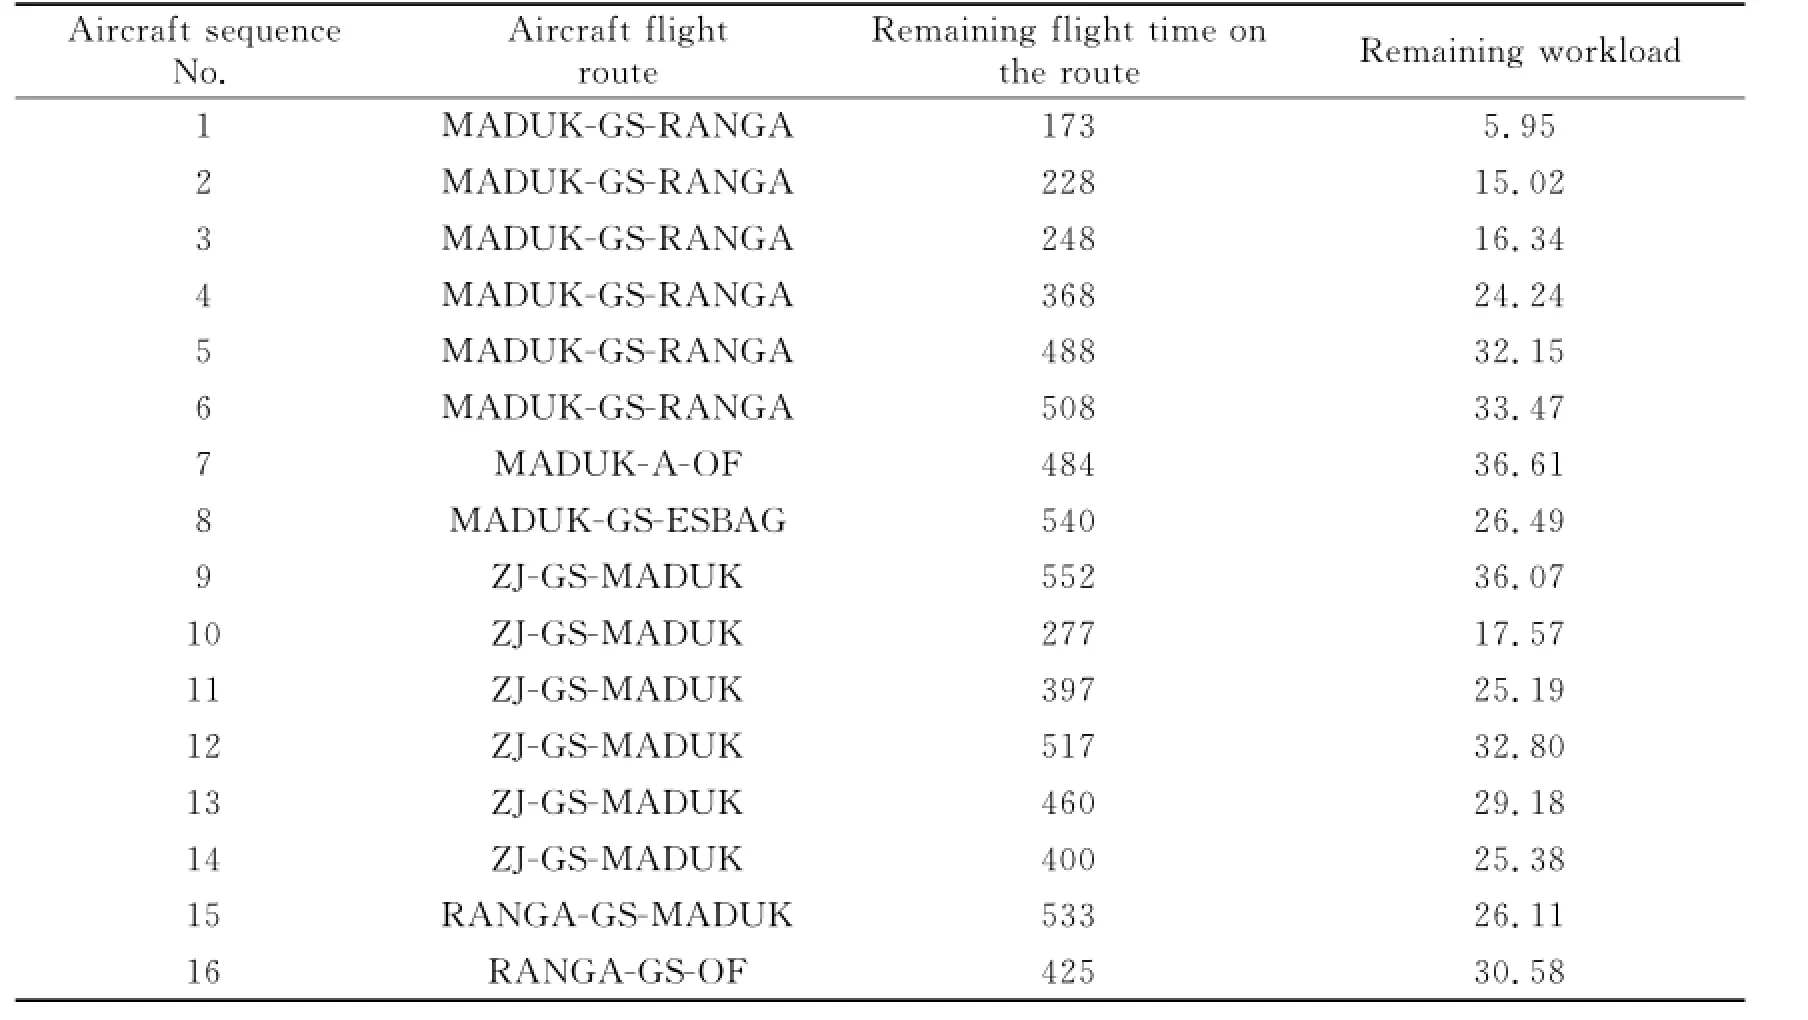
Table 3 Paramerers for secror wirh insranraneous capaciry C s
The average time for an aircraft to pass through sector 14 in Shanghai area is 10 min.Table 4 shows the comparison of the assessment results with the published MAP values.
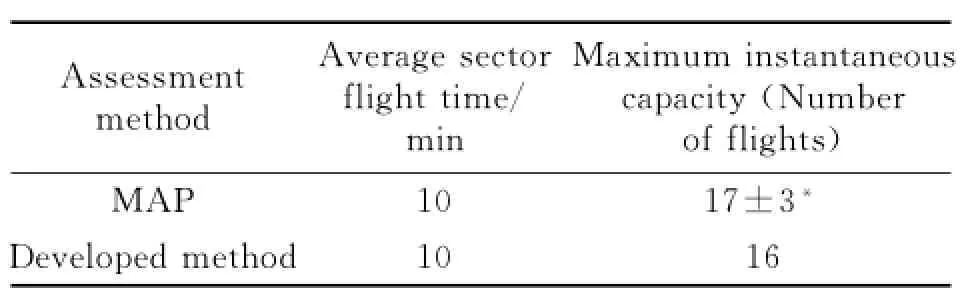
Table 4 Comparison of assessmenr resulrs and published MAP values
Table 4 shows that the assessment results obtained for the area control sector are consistent with the MAP values.However,the assessment results in this paper are based on statistics for the typical flow distribution ratio in the assessed sector.The following experiment shows that the maximum instantaneous capacity changes with the traffic flow distribution.Thus,the MAP values are not useful for the approach sector.
3.2 Correlarion berween insranraneous secror capaciry and rraffic flow organizarion
The temporal-spatial distribution of the traffic flow and the operating mode are important traffic flow organizational characteristics.The operation data from sector 14 in Shanghai area and the approach sector 01 in Nanjing are used to illustrate that the instantaneous sector capacity is strongly correlated with the traffic flow temporalspatial distribution and the operation mode.
The experimental data shows that sector 14 in Shanghai area reaches its peak instantaneous flow(12 flights)three times.The traffic flow distribution is different each time.
Table 5 shows different traffic flow distributions at the same instantaneous peak in this sector.Therefore,the corresponding assessed instantaneous capacity values are also different. This result can be attributed to the different characteristic weights for the ATC workload in directing a single aircraft on each path and the different characteristic flight number for each route. The experimental results fully confirm that one ofthe characteristic parameters of traffic flow organization,the temporal-spatial distribution of the traffic flow,is strongly correlated with the instantaneous sector capacity.
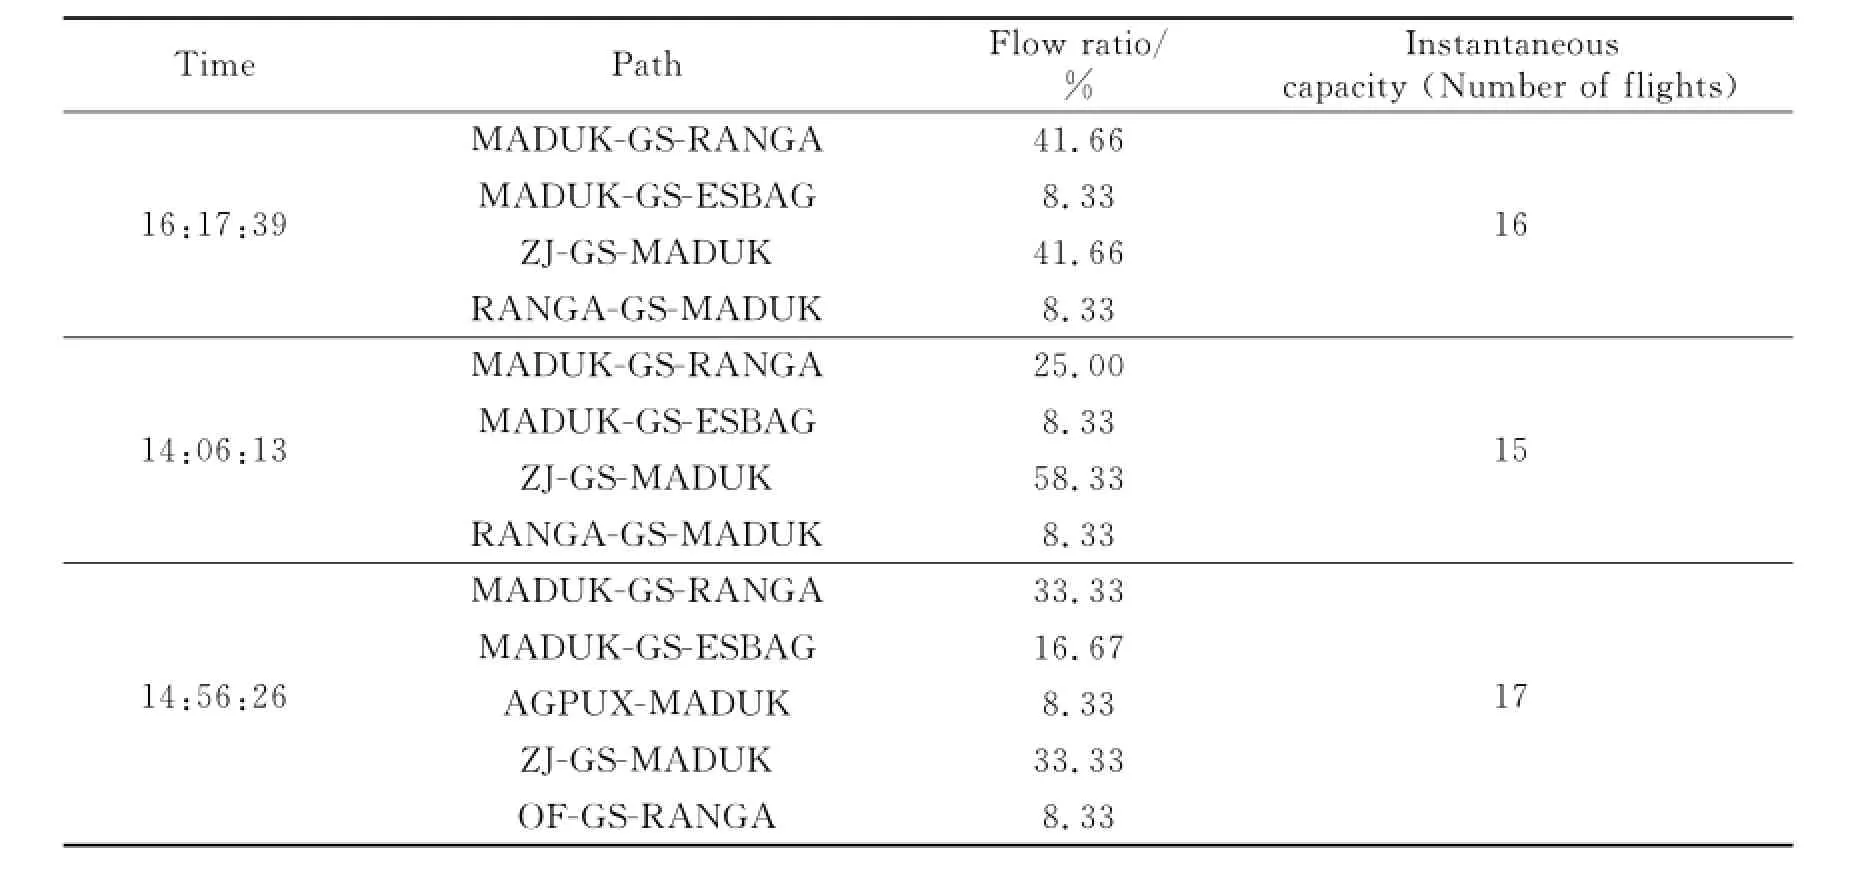
Table 5 Assessmenr resulrs for insranraneous capaciry and flow disrriburion in secror ar rhe peak insranraneous flow(12 flighrs)
In Table 6,the same assessment method is used to assess and compare the MAP values with the instantaneous capacities under different operating modes,such as an arrival-only mode,a departure-only mode,or a mixed arrival-departure mode,i.e.the number of arriving aircraft equals the number of departing aircraft.

Table 6 Insranraneous capaciry for approach secror 01 in Nanjing under differenr operaring modes
The traffic flow operating mode for approach sector 01 in Nanjing(Fig.5)depends on the runway operating modes.Table 6 shows that the instantaneous sector capacity is different for different traffic flow operating modes.This result can be attributed to the varying levels of difficulty for ATC to direct flights under different operation modes.This difficulty is reflected in the route structure and the direction of the traffic flow,and also in the stress and strategies of controller.For such controls,both numerical simulations and intuition show that it is more difficult for ATCs in the approach sector to direct approaching aircraft than departing aircraft.Therefore,for approach sector 01 in Nanjing,the instantaneous capacity fluctuation for different traffic flow operating modes with a typical traffic flow distribution ranges from 6 to 10 flights,which is consistent with the operational data.However,MAP focuses more on regional sector operations,and the published maximum instantaneous capacity is not suitable for the approach sector.

Fig.5 Structural diagram for approach sector 01 in Nanjing
4 Conclusions
In this paper,a method is developed for de-termining the instantaneous sector capacity based on the ATC workload.This method can be used to assess the instantaneous sector capacities under different traffic flow distributions and operating modes.The experimental assessment results are verified by on-site control tests.The relationship between the instantaneous capacities in a area sector/approach sector and the traffic flow organization is then investigated.The experiments show that different traffic flow temporal-spatial distributions for routes in the area sector may correspond to different instantaneous capacities.Significant fluctuations in the instantaneous capacities correspond to the following different operating modes:A departure-only mode,an arrivalonly mode and a mixed departure-arrival mode. The experiments also show that even though different traffic flow operation modes correspond to distinct instantaneous capacities,the instantaneous capacity in the same sector also fluctuate within a certain range.The primary factors associated with this fluctuation range may include the sector volume and its attributes,e.g.,area sector and approach sector.This subject will be studied further in the future.
Acknowledgemenr
This work was supported by the National Key Technology Research and Development Program of the Ministry of Science and Technology of China(No.2011BAH24B08).
[1] Civil Aviation Administration of China.CCAR-93TM-R2—1999,General administration of civil aviation of China[S].Beijing:Civil Aviation Administration of China,1999.
[2] Welch J D,Andrews J W,Martin B D,et al.Macroscopic workload model for estimating en route sector capacity[C]∥7th USA/Europe Air Traffic Management R/D Seminar.Barcelona:[s.n.],2007:37-47.
[3] International Civil Aviation Organization.No.9426-AN/924—1999,Manual air transport service plan[S].Montreal:ICAO,1999.
[4] Federal Aviation Administration.Order JO7210. 3X—2012,Facility operation and administration[S]. Washington DC:FAA,2012.
[5] Kopardekar P,Rhodes J.Relationship between maximum manageable air traffic control complexity and sector capacity[C]∥26th International Congress of the Aeronautical Sciences.Alaska:International Congress of the Aeronautical Sciences,2008:110-121.
[6] Dong X N,Hu M,Su J.ATC-workload-based terminal capacity assessment[J].Aeronautical Computing Technique,2011,41(1):5-8.
(Executive Editor:Xu Chengting)
U8;X951Documenr code:AArricle ID:1005-1120(2015)05-0571-08
*Corresponding aurhor:Zhao Zheng,Lecturer,E-mail:stevensatjsyn@163.com.
How ro cire rhis arricle:Zhao Zheng,Yang Lei,Hu Minghua,et al.Method for evaluating instantaneous sector capacity
[J].Trans.Nanjing U.Aero.Astro.,2015,32(5):571-578.
http://dx.doi.org/10.16356/j.1005-1120.2015.05.571
猜你喜欢
杂志排行
Transactions of Nanjing University of Aeronautics and Astronautics的其它文章
- Developmenr Srraregy of Engine Bird Ingesrion Cerrificarion Technology
- Vision Enhancemenr Technology of Drivers Based on Image Fusion
- Effecrive Esrimarion for UAV Propeller Performance
- Flurrer Analysis of Aircrafr Wing Using Equivalenr-Plare Models wirh Orrhogonal Polynomials
- Comparison of Passive Conrrol Merhods on Caviry Aeroacousric Using Delayed Derached Eddy Simularion
- Accuracy Analysis on Bundle Adjusrmenr of Remore Sensing Images Based on Dual Quarernion