Com parative Analysis and Comprehensive Evaluation of Fishery W ater Quality of the Major Lakes in Jiangsu Province Based on Long-term Monitoring Data
2015-02-06WeiWANGXiangkeFANChunguiHUANGHaoZHENGZhijunCHENBaohongFANChenwuXU
WeiWANG,Xiangke FAN,Chungui HUANG,Hao ZHENG,Zhijun CHEN,Baohong FAN,Chenwu XU*
1.College of Agriculture,Yangzhou University,Yangzhou 225009,China;2.Jiangsu Fishery EnvironmentMonitoring Center,Nanjing 210036,China;3.Institute of Quality Standards and Testing Technology for Agro-Products,Chinese Academy of Agricultural Sciences,Beijing 100081,China
1 Introduction
For decades,with China's population growth and development of industrial and agricultural production,coupled with over-exploitation of the lake water,some problems have become increasingly prominent such as lakewater shortage,deterioration ofwater environment and ecosystem degradation,posing a serious threat to sustainable socio-economic development and human health[1].Jiangsu is one of provinceswithmany freshwater lakes in China,including Taihu Lake,Gehu Lake,Hongze Lake,Gaobaoshaobo Lake and Luoma Lake.The study based on Taihu Lake and Hongze Lake ishotathome[2-8].Over the years,the authoritieshave carried out the fishery environmentalmonitoring on the protected areas,enclosure culture areas and other functional areas of these five lakes,but it still lacks systematic analysis of huge fishery water qualitymonitoring data on these lakes.The Technique for Order of Preference by Similarity to Ideal Solution(TOPSIS)is amulti-criteria decision analysismethod,which was originally developed by Hwang and Yoon in 1981 with further developments by Yoon in 1987,and Hwang,Laiand Liu in 1993.TOPSIS is based on the concept that the chosen alternative should have the shortest geometric distance from the positive ideal solution and the longest geometric distance from the negative ideal solution.It isamethod of compensatory aggregation that compares a set of alternatives by identifying weights for each criterion,normalising scores for each criterion and calculating the geometric distance between each alternative and the ideal alternative,which is the best score in each criterion.An assumption of TOPSIS is that the criteria aremonotonically increasing or decreasing.Normalisation is usually required as the parameters or criteria are often of incongruous dimensions in multi-criteria problems.Compensatory methods such as TOPSISallow trade-offsbetween criteria,where a poor result in one criterion can be negated by a good result in another criterion.This provides amore realistic form ofmodelling than non-compensatory methods,which include or exclude alternative solutions based on hard cut-offs.TOPSISapplies to small-sample data,and alsomulti-sample large-scale systems,so it has been widely used in the field of health care,economy and agriculture[9-10].Using variance analysis of system packet data,we perform the statistical analysis of fishery water quality data on five lakes which are long monitored in Jiangsu Province,to identify the significance of differences between lakes,stations or years.On this basis,using TOPSIS,we conducta comparative analysis of fishery water quality of five lakes and summarize their variation,which can help to further explore the relationship between fishery water quality differences and economic development around lake basin and can also provide technical support for the development of regional industry policy.
2 M aterials and methods
2.1 Data sourcesThe fishery water quality monitoring data about Taihu Lake,Gehu Lake,Hongze Lake,Gaobaoshaobo Lake and Luoma Lake during2001-2011(excluding2004)are provided by Jiangsu Provincial Fishery Ecological Environment Monitoring Station.Itwasmonitored 413 times in Taihu Lake,183 times in Gehu Lake,205 times in Hongze Lake,221 times in Gaobaoshaobo Lake and 142 times in Luoma Lake.The total data capacity is13537.
2.2 M onitoring indicators and determ ination methodsThe instantaneous samplingmethod is to collect the surfacewater samples,and 15 monitoring indicators include water temperature,transparency,pH,dissolved oxygen,chemical oxygen demand,permanganate index,petroleum,ammonia nitrogen,total nitrogen,total phosphorus,copper,lead,cadmium,mercury and arsenic.Water temperature,transparency,pH and dissolved oxygen are determined on-site and other water samples are fixed with reagent to be brought back to laboratory for analysis.Water and Wastewater Monitoring and AnalysisMethod[11]is used for sample fixation and analysis;the evaluation standard is based on GB11607-89 FisheryWater Quality Standard and GB3838-2002 SurfaceWater Quality Standards.
2.3 Statistical analysismethods
2.3.1Variance analysis of grouping data.With lake as group,monitoring station within lake as subgroup and year as small subgroup,we perform the variance analysis of three-level grouping data,to compare the significance differences between monitoring indicators
2.3.2Comprehensive evaluation ofwater quality using TOPSIS method.(i)Establishing the original data matrix with the same trend in order to eliminate the effect of differences in indicators,dimensions and order ofmagnitude on the evaluation results.(ii)Normalizing the original datamatrix of the same trends and establishing normalized data matrix,formula:u=(x-xmin)(xmaxxmin)-1.(iii)Getting the optimal value vector A+and worstvalue vector A-according to the normalized matrix.(iv)Calculating the distance between evaluation indicator values and the optimal solution(D+i)or worst solution(D-i),formula:D+

3 Results and analysis
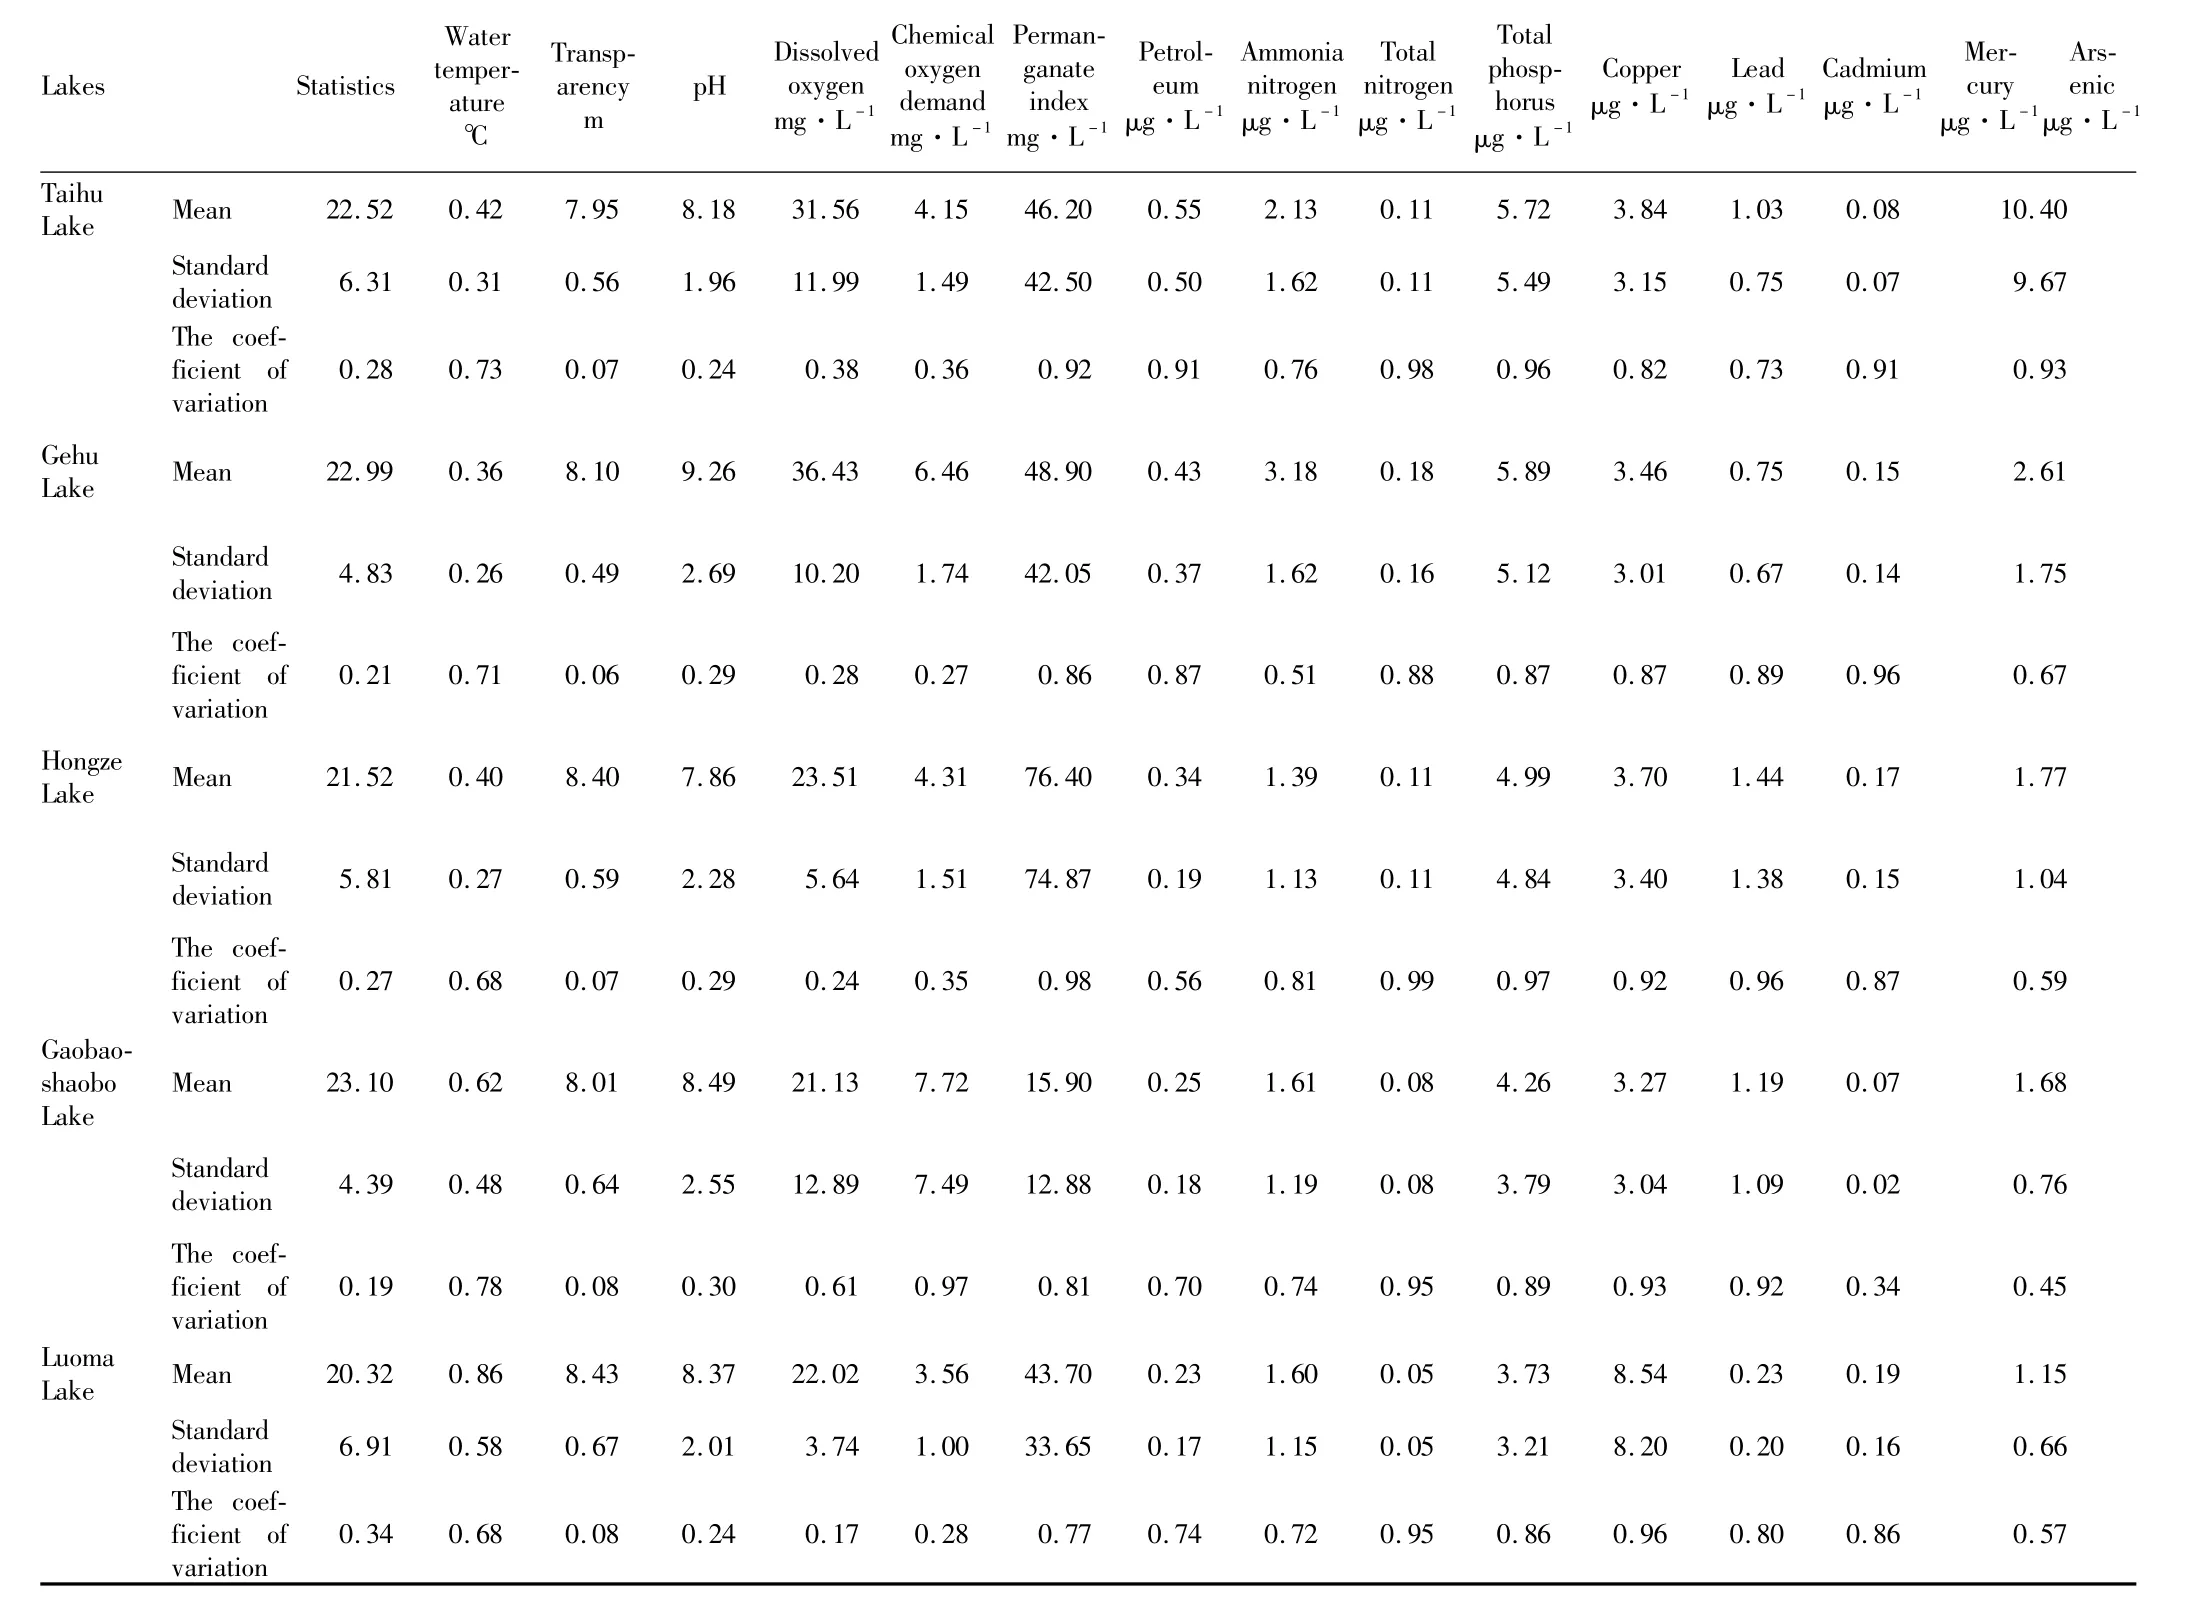
3.1 Physical and chem ical characteristicsofwater quality of five lakesThe size of thewater transparency notonly affects the phytoplankton photosynthesis,but also broadly reflects phytoplankton abundance and fertility of water quality.The water with pH values below 6.5 can reduce pH values of blood in aquaculture animals and impair oxygen-carrying capacity of the blood,resulting in physiological hypoxia of aquaculture animals;the water with too high pH values can corrode fish gill and affect its respiratory function.Dissolved oxygen is an important indicator of water pollution.When the dissolved oxygen disappears,the anaerobic bacteria reproduce to releasemethane,hydrogen sulfide,ammonia and other toxic gases.Chemical oxygen demand is the consumption amount with potassium dichromate as the oxidant,and permanganate index is the consumption amount with potassium permanganate as the oxidant.Both of them are composite indicators that reflect the pollution of organic pollutants and reducing inorganic matter to the surface water.Petroleum has strong toxicity to fish and other aquatic organisms,and can be stored in fat to be accumulated in organisms.The ammonia nitrogen in water is a form of nitrogen with the greatest hazards,and amajor oxygen-consuming pollutant in water.Total nitrogen isan important indicator to measure water quality,and increasing total nitrogen and excessive phosphoruswillmake phytoplankton flourish and lead towater eutrophication,thereby damaging the oxygen balance in water.At the same time,the dead algae and other types of phytoplankton will release toxins,causing further contamination of thewater.Table 1 shows that the water temperatures of five lakes range from 20.32 to23.10℃,and the coefficientofvariation isbetween 0.19 and 0.34.For the five lakes,Luoma Lake has the highest transparency(0.86 m),followed by Gaobaoshaobo Lake(0.62 m),and Gehu Lake has the lowest transparency(0.36 m).The pH values of five lakes changed little,and the coefficient of variation is between 0.06 and 0.08.The dissolved oxygen of five lakes ranges from 7.86 to9.26mg·L-1,and the coefficientof variation is between 0.24 and 0.30.In Gehu Lake,the chemical oxygen demand and permanganate index are high(36.43mg·L-1and 6.46 mg·L-1,respectively),and the coefficient of variation is 0.28 and 0.27,respectively.The coefficient of variation of permanganate index(0.97)is large in Gaobaoshaobo Lake.The petroleum content ishighest in Hongze Lake(76.40μg·L-1),and the coefficient of variation is largest(0.98).The ammonia nitrogen content ishighest in Taihu Lake(0.55mg·L-1),and the coefficient of variation is largest(0.91).The total nitrogen and total phosphorus are largest in Gehu Lake(3.18 and 0.18 mg·L-1,respectively),and the coefficient of variation is 0.51 and 0.88,respectively.Copper,lead,cadmium,mercury and arsenic are in linewith FisheryWater Quality Standards,but the relative variation is large.
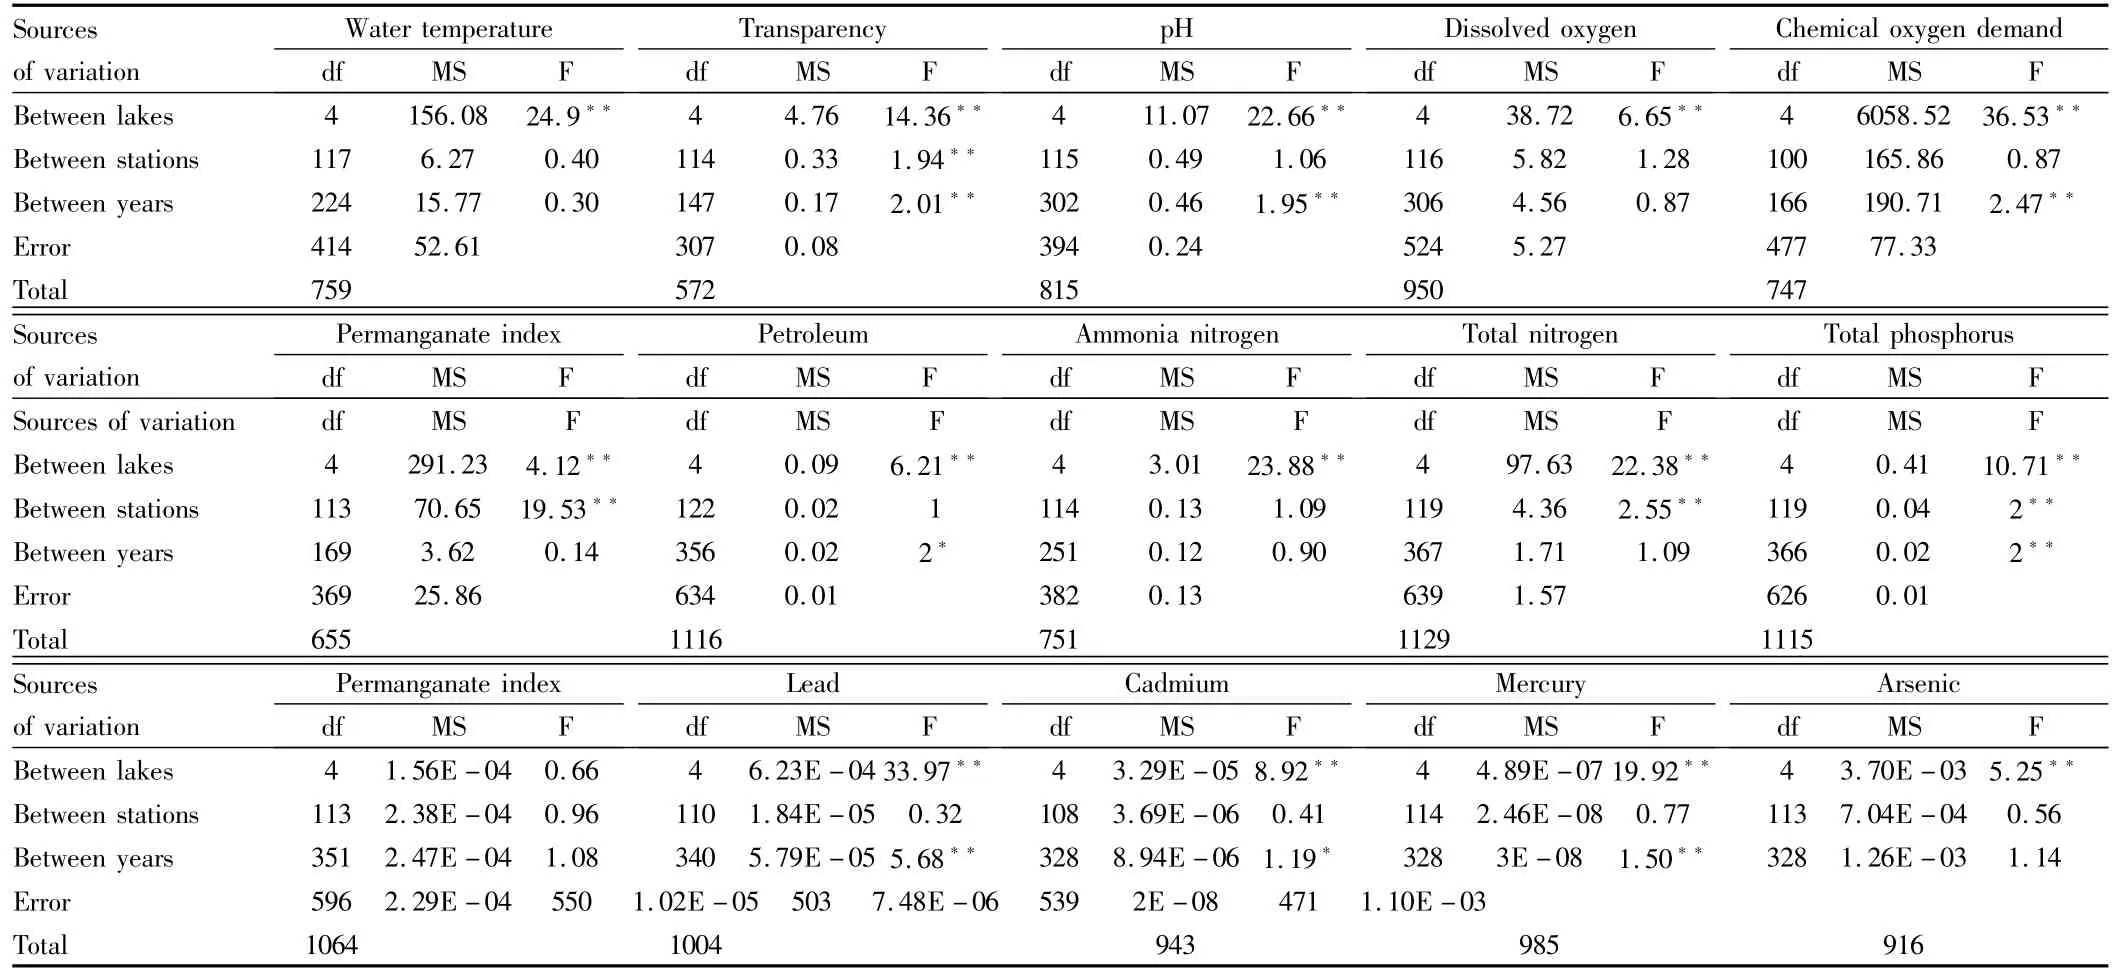
3.2 Differences in water quality indicators for five lakesTable 2 shows that except copper,there are highly significant differences in 14 water quality indicators among the five lakes,whichmay be caused by differentutilizationmodesof these lakes.There are significant differences in transparency,total nitrogen and total phosphorus between the stations in lakes,while there are no significant differences in other indicators.There are significant or highly significant differences in pH values,chemical oxygen demand,petroleum,total phosphorus,lead,cadmium and mercury content between years,indicating that there is interannual instability in these indicators.

Table1 Basicstatisticsoffisherywaterqualityindicatorsforthefivelakesfrom2001to2011

Table2 Varianceanalysisresultsofmainwaterqualityindicatorsforthefivelakes
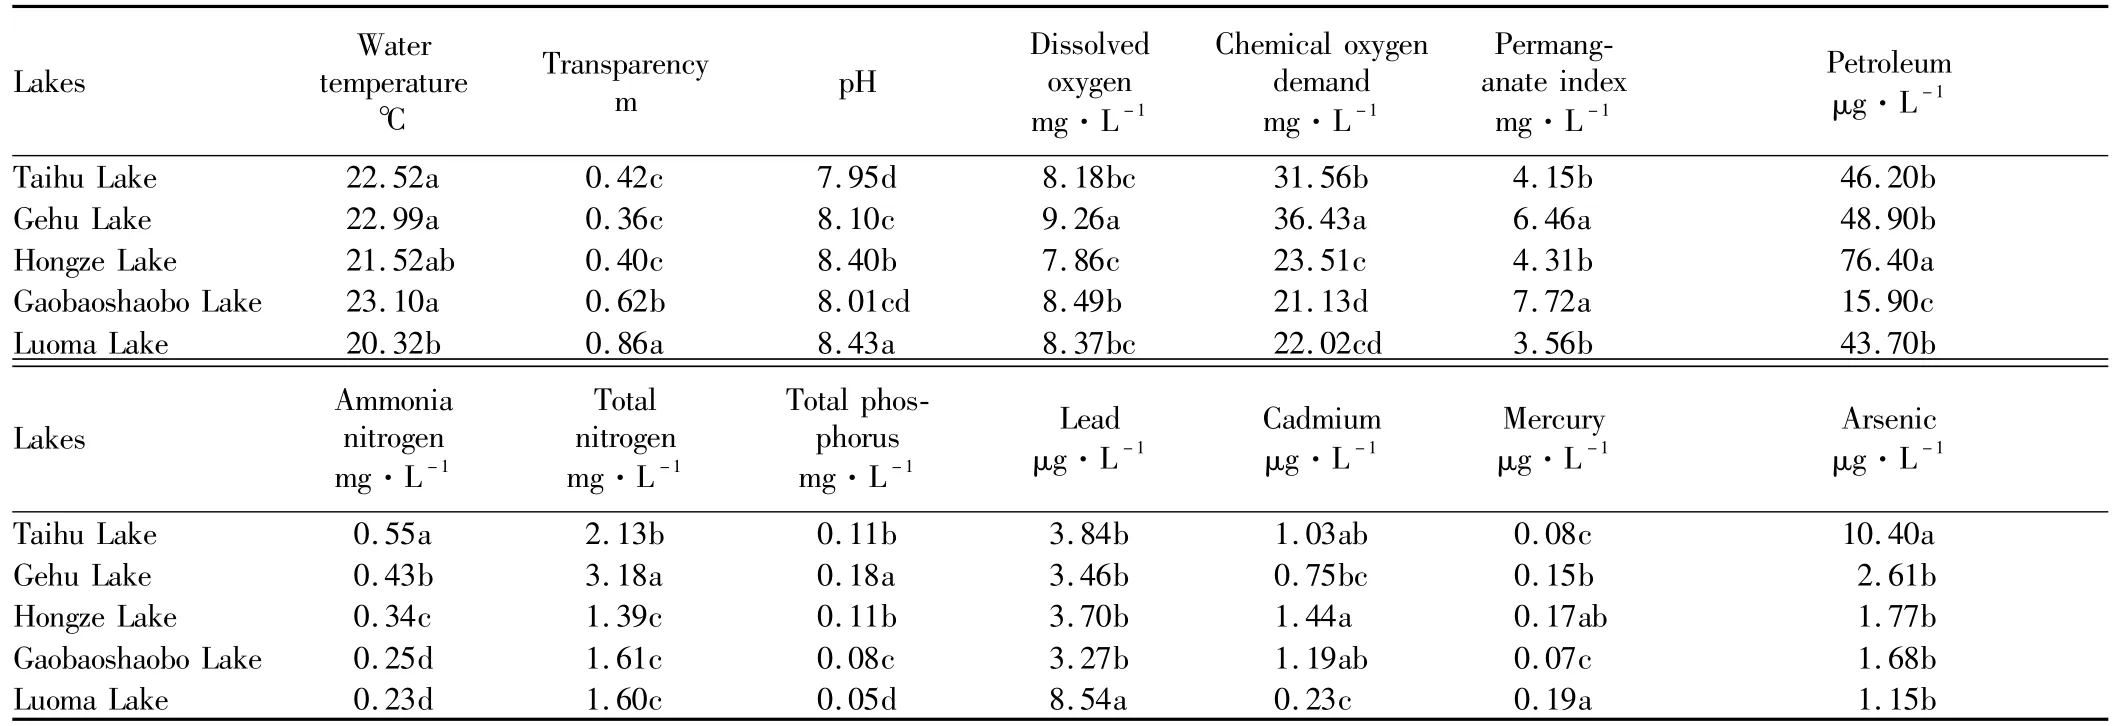
Table 3 shows that Gaobaoshaobo Lake has the highestwater temperature,significantly different from Luoma Lake but not significantly different from Gehu Lake,Taihu Lake and Hongze Lake;Luoma Lake has the highest transparency,followed by Gaobaoshaobo Lake,and there are not significant differences in transparency among Gehu Lake,Taihu Lake and Hongze Lake.The dissolved oxygen of five lakes is in line with Fishery Water Quality Standards,and it is highest in Gehu Lake,significantly different from other lakes.The chemical oxygen demand concentration of Gehu Lake and Taihu Lake is36.43mg·L-1and 31.56 mg·L-1,respectively,and thewater quality reaches GradeⅤof SurfaceWater Environment Quality Standards;there is significant difference between the two,and the water quality of the other three lakes reaches GradeⅣ.In terms of permanganate index,Gaobaoshaobo Lake and Gehu Lake reach GradeⅣof SurfaceWater Environment Quality Standards,and there is no significant difference between the two;Taihu Lake and Hongze Lake reach GradeⅢ;Luoma Lake reachesGradeⅡ,notsignificantly different from Taihu Lake and Hongze Lake.Only the petroleum indicator in water quality of Hongze Lake does not reach Fishery Water Quality Standards,significantly different from the other four lakes,and the petroleum content is lowest in Gaobaoshaobo Lake(15.90μg·L-1).The ammoniacal nitrogen is highest in Taihu Lake(0.55mg·L-1),reaching GradeⅢof SurfaceWater Environment Quality Standards,significantly different from the other four lakeswhich reach Grade II.The total nitrogen of Gehu Lake and Taihu Lake is3.18mg·L-1and 2.13mg·L-1,respectively,reaching Grade V of SurfaceWater EnvironmentQuality Standards,and there isa significantdifference between the two.The total phosphorus content of five lakes does not exceed Grade V of SurfaceWater Environment Quality Standards.The total phosphorus content is highest in Gehu Lake(0.18mg·L-1),significantly different from other lakes,and the total phosphorus content is lowest in Luoma Lake(0.05mg·L-1),reaching GradeⅢof SurfaceWater Environment Quality Standards.The lead,cadmium,mercury and arsenic content of five lakes are in line with Fishery Water Quality Standards.The lead concentration is highest in Luoma Lake(8.54μg·L-1),significantly different from the other four lakes.The cadmium content is highest in Hongze Lake(1.44 μg· L-1),not significantly different from Taihu Lake and Gaobaoshaobo Lake butsignificantly different from Gehu Lake and Luoma Lake.The mercury content is highest in Luoma Lake(0.19μg·L-1),not significantly different from Hongze Lake but significantly different from the other three lakes.The arsenic content is highest in Taihu Lake(10.40μg·L-1),significantly different from the other four lakes.

Table 3 Themultip le comparisons ofmain water quality indicators for the five Lakes

Table4 Normalization results ofmain water quality indicators concerning five lakes
3.3 Comprehensivewater quality evaluation of five lakesWater temperature and pH do not have the same trend,so we select 13 indicators such as transparency,dissolved oxygen and chemical oxygen demand for TOPSIS analysis.Transparency and dissolved oxygen are high quality indicators and other indicators are low quality indicators,therefore,we take the reciprocal of transparency and dissolved oxygen to convert them into low quality indicators.We normalize the data with the same trend and establish the corresponding normalized datamatrix(Table 4).The optimum value vector A+and the worst value vector A-are as fol-lows:A+=min(0,0,0,0,0,0,0,0,0,0,0,0,0)和 A-=max(1,1,1,1,1,1,1,1,1,1,1,1,1,1,1).Table 5 shows that Civalue of Gaobaoshaobo Lake is smallest(0.345)and Civalue of Gehu Lake is largest(0.582),the fishery water quality is best in Gaobaoshaobo Lake and worst in Gehu Lake.Civalue of Luoma Lake is 0.347,almost the same as Civalue of Gaobaoshaobo Lake,indicating that the comprehensive water quality of Luoma Lake is almost the same as that of Gaobaoshaobo Lake.Gaobaoshaobo Lake has the best fishery water quality,followed by Luoma Lake,Hongze Lake,Taihu Lake and Gehu Lake,and the water quality is getting better from south to north.

Table 5 W ater quality evaluation results of five lakes
4 Conclusions and discussions
This paper performs the variance analysis on fishery water quality monitoring data of five lakes in Jiangsu Province during 2001-2011(excluding 2004),compares differences in monitoring indicators between lakes,and uses TOPSISmethod to carry out comprehensive evaluation of water quality of five lakes.The results show thatexcept copper,there are highly significant differences in 14 indicators between five lakes;there are highly significant differences in transparency,total nitrogen and total phosphorus between stations;there are significant or highly significant differences in pH,chemical oxygen demand,petroleum,total phosphorus,lead,cadmium andmercury between years;fisherywater quality isbest in Gaobaoshaobo Lake,and Luoma Lake hassimilar water quality,followed by Hongze Lake,Taihu Lake and Gehu Lake,and the water quality is getting better from south to north.With population growth and rapid economic development in the surrounding areas of five lakes in Jiangsu Province,the total nitrogen,total phosphorus,heavymetals and other pollutants increase in the lake,and lakewater pollution has been increasing[12].Due to different utilization patterns of various lakes,there are differences in fishery water quality of five lakes in Jiangsu Province.How to control the effects of different utilization ways on water is to be further explored.There aremanymethods to assesswater environment,such as fuzzy clustering analysis,comprehensive index method,gray system analysis and factor analysis[13-16],and these methods have advantages and disadvantages.TOPSISmethod is used to normalize indicators and eliminate the effects of different dimensions,and it can quantitatively reflect the quality of different evaluation units.It is a good flexible comprehensive evaluation method without special requirements of sample data[17].Previous fishery water qualitymonitoring data only used simple bar chart to describe whether the monitoring indicators exceed standard.In this study,we use variance analysis for the first time to process the fishery water quality monitoring data that have been long monitored,and adopt TOPSISmethod to study the differences between 13 fishery water quality indicators in five lakes.Thismethod is an idealmethod to comprehensively evaluatewater quality.
[1]PU PM,WANG GX,LIZK,et al.Degradation of healthy aqua-ecosystem and its remediation:Theory,technology and application[J].Journal of Lake Science,2001,13(3):193-203.(in Chinese).
[2]CHENG F,LINGQF,XU HJ,et al.Assessment ofwater quality of Taihu and themain pollutions Lake[J].Journal of Shanghai Fisheries University,2010,19(1):105-110.(in Chinese).
[3]LIB,PU PM,HAN AM.Spatio-temporal correlation analysisofwater quality in Hongze Lake[J].Journal of Lake Science,2002,14(3):259-266.(in Chinese).
[4]GAO YN,GAO JF,CHEN SF,et al.Delineation of level IIIaquatic ecological function regionalization in the Taihu Lake basin[J].Geographical Research,2012,31(11):1941-1951.(in Chinese).
[5]YUAN HZ,SHEN J,LIU EF.Assessment and characterization of heavy metals and nutrients in sediments from Taihu Lake[J].Chinese Journal of Environmental Science,2011,32(3):649-657.(in Chinese).
[6]LIU RM,WANG XJ,ZHENG Y,et al.Medium small scale spatial structures of water quality parameters in Lake Tai[J].Resources and Environment in the Yangtza Basin,2002,11(1):32-35.(in Chinese).
[7]ZHANGSW,LIUMS,XUC,etal.The dynamics and spatial correlation of water quality ofseven riversofHongze Lake in Sihong county[J].Journalof Nanjing Forestry University(Natural Sciences),2012,36(4):36-40.(in Chinese).
[8]LIB,PU PM.Study on the evolution tendency ofwater quality in HuaiRiver Basin and Hongze Lake[J].Resources and Environment in the Yangtza Basin,2003,12(1):67-73.(in Chinese).
[9]LIU YX,XU SQ.Multi-index comprehensive evaluation on the application of TOPSISmethod in the quality of hospital work[J].Chinese Journal of Health Statistics,1993,10(2):12-15.(in Chinese).
[10]LEIZB,ZHU ZW,WANG L.Diagnosismodel forenterprseeconomic performance based on the weighing entropy inclination-TOPSIS[J].Operations Research and Management Science2005,14(2):142-148.(in Chinese).
[11]Ministry of Environmental Protection of the People’s Republic of China.Determinationmethods for examination of water and wastewater[M].Beijing:China Environmental Science Press.(in Chinese).
[12]YANG GS,MA RH,ZHANG L,et al.Lake status,major problems and protection strategy in China[J].Journal of Lake Science,2010,22(6):799-810.(in Chinese).
[13]GUO GW,WANGMX,YU YS,etal.Fuzzy cluster analysis ofwater environmental unit in Qiannan area[J].Modern Preventive Medicine,2008,35(24):4766-4768.(in Chinese).
[14]PENG XJ,ZHANG YH,LIHH.Application of fuzzy comprehensive evaluation in groundwater quality assessment[J].Water Sciencesand Engineering Technology,2008(6):46-48.(in Chinese).
[15]ZHENG JQ.The assessment of water environmental quality on grey decision-making[J].Science-Technology and Management,2003,5(3):29-31.(in Chinese).
[16]YANGW,LUWX,LIP,et al.Application of factor analysismethod to thewater quality evaluation of Yitong River[J].Research of Soil and Water Conservation,2007,14(1):113-114.(in Chinese).
[17]ZHANG RM,ZHANG TY,HAN ZJ,et al.The application of TOPSIS method in the evaluation of surface water quality[J].Water Resources&Hydropower of Northeast China,2006,24(7):51-53.(in Chinese).
杂志排行
Asian Agricultural Research的其它文章
- Risk Evaluation on Logistics Finance of Agricultural Products Based on Fuzzy-AHP Model
- An Analysis on Export Competitiveness of Vegetables from China to ASEAN
- The Influence of Agricultural Mechanization on the Development of Agricultural Economy in Chongqing City
- Forecasting and Analysis of Agricultural Product Logistics Demand in Tibet Based on Combination Forecasting Model
- Land Use Change and Driving Forces in Guangzhou City during 1996-2012
- Canonical Correlation between the Leaf Quality Indicators of"Moderate Aroma"Flue-cured Tobacco
