Metal contamination assessment in the urban stream sediments and tributaries of coastal area southwest Nigeria
2015-01-17AbiodunOdukoyaOlumuyiwaAkande
Abiodun M.Odukoya•Olumuyiwa Akande
Metal contamination assessment in the urban stream sediments and tributaries of coastal area southwest Nigeria
Abiodun M.Odukoya1•Olumuyiwa Akande1
A geochemical assessment of the ffty surface stream sediments from Ikorodu Southwest Nigeria was carried out to determine the level of contamination.The sediments were dried,disaggregated and sieved to<75 μm fraction for geochemical analysis,using the aqua-regia digestion technique and inductively coupled plasma mass spectrometry.Major elements showed the following trend Fe>Al>Ca>Na>Mg>K>P>Ti and were below theaverageshaleconcentration,exceptforNainonesample. Results from factor and correlation analyses showed two groupsoftraceelementsNi,Co,Mn,U,Th,Sr,V,La,Cr,Ba, Sc,Ga,Cs,Nb,Rb,Y,CeandMo,Pb,Zn,As,Cd,Sb,Sn,Zr, which were from geogenic and anthropogenic sources,respectively.TheenrichmentfactorshowedthatCd,Bi,Pt,Mo and Ag were,for all samples,within background concentrations,except those of the Ogun River and the Owode Onirin,which showed signifcant enrichment of Cd,Zn,Cu, Pb and Ag,depletion to minimal enrichment for Bi,Mo and moderate enrichment for Pt.The contamination degree ranged between 1.25 and 143.79.The highest value was foundatOwodeOnirinandthelowest,atIgbonla7.Thegeoaccumulation index showed that all the stream sediments rangedbetweenpracticallyuncontaminatedtomoderatelyto highly contaminated—with Pb,Sn,Zn,Cd,Cu,Cr,Zr and Ba.The potential ecological risk factor and environmental risk index(IER)showed that all of the samples were within the class of low to medium contamination risk,exceptsamples from the Owode Onirin,which fell within the class of very high risk to extremely high risk respectively.
Indices·Ecological risk·Geogenic· Anthropogenic·Environment
1 Introduction
Stream sediments are basic components of our environment. Apart from providing foodstuffs for living organisms,they also serve as a sink and reservoir for trace elements.It has been recognized that aquatic sediments absorb persistent and toxic chemicals to levels many times higher than the water column concentration.Depending on the river morphology and the hydrological conditions,suspended particles with associated contaminants can settle along the watercourse and become part of the bottom sediments,often many kilometers downstream from the chemical sources.
A geochemical survey based on the analysis of stream sediments is a well-established technique that,for over fve decades,has been used worldwide where stream drainage networks are well established.This usage is based on the surveys’cost-effective ability to identify anomalous watersheds as targets for further exploration(Fletcher and Loh 1997).Theconceptofregionalgeochemicalmappingmeans to generate high quality environmental geochemical baseline data from the sampling of surface water,stream sediments and residual soil.This provides information on the prospective areas for mineral exploration,the relationship between health and element defciencies/toxicology in the environment and the relationship between elements in the environment and agriculture.
Geochemical maps have been constructed using stream sediment geochemical data from all over the world in orderto identify possible sources of anomalous element concentrations(Thalmann et al.1988,Reid 1993,Atsuyuki et al.2005).
The African continent continues to witness huge developmental strides in its infrastructural and the industrial sector.As the human population continues to move into cities in search of better job opportunities and quality of life,there has been an emergence and growth of new cities and mega cities,.These cities emerged and grew without proper planning,leading to haphazard development with attendant side effects,such as indiscriminate construction of buildings,industries,disposal of municipals and industrial wastes,as well as a total lack of reliable data on the nature and quality of various environmental media.These unwholesome situations led to the deplorable quality of water bodies,sediments,soils and vegetation,as well as human lives.Lagos,Southwest Nigeria is one of these mega cities.The city of Lagos is the most populated in Nigeria,and is projected to be the ffth most populated city in the world by 2015(UNDP/LASG 1985).The city also harbors over 75%of the country’s industrial outfts.These industries include textile industries,chemical and paint industries,breweries and bottling companies,metal industries,shipyards,plastic and petrochemical factories, paper mills and sawmills.In addition to these industries, recreational and tourist centers have been built around the lagoon front at several locations.These industries discharge their untreated waste into the several drainages and canals that litter the metropolis.The dumped waste eventually fnds its way into the streams.Among all the pollution,heavy metal is an important part and should never be neglected.Heavy metals are among the most common environmental pollutants and their occurrence in waters and biota are from natural or anthropogenic sources.The existence of trace metals in aquatic environments has led to serious concerns about their infuence on plant and animal life(Sheikh et al.2007;Zvinowanda et al.2009).Severe imbalances on metal proportions,caused by exposure to elevated concentrations,can even induce the death of organisms(Agbozu et al.2007).Elements like lead(Pb), cadmium(Cd),arsenic(As),etc.exhibit extreme toxicity even at trace levels(Nicolau et al.2006).Streams are a dominant pathway for the transport of metals(Miller et al. 2003)and trace metals may become signifcant pollutants of many small riverine systems(Dassenakis et al.1998).
The purpose of this work is,therefore,to generate a geochemical data set using stream sediments from the Ikorodu,Ogun river,Owode Onirin,Igbonla,Orimedu and environs in Lagos,Southwestern Nigeria to(i)characterize the behaviour of major(Al,Ca,Fe,Ti,K,Mg and Na)trace and rare elements(Mo,Cu,Pb,Zn,Ag,Ni,Co,Mn,As,U, Au,Th,Sr,Cd,Sb,Bi,V,La,Cr,Br,Ti,B,W,Sc,Tl,Hg, Se,Te,Ga,Cs,Ge,Hf,Nb,Rb,Sn,Ta,Zr,Y,Ce,In,Re, Be,Li,Pd and Pt.)in the surface sediments;(ii)establish baseline concentrations of the metals,by assessing the contribution from natural and anthropogenic sources in the coastal environment;and(iii)evaluate the spatial distribution of major and trace elements in the Ikorodu area and its impact on the environment.
2 Study area
Ikorodu is the study area is along the Lagos lagoon, Southwest Nigeria.It is located within the latitudes 6°39′N and 6°75′N and longitudes 3°8′E and 4°24′E.From the north,the area is accessible from Ikorodu;it has easy access to the Lagoon through its immediate neighboring towns of Ibese,Ososun and Offn from the west,Ijede from the east and Oreta,Igbopa and Ason from the south.The area is located within the equatorial rain forest belt and has a large undeveloped landmass.It is within 10.15 km from the Lagos metropolis,which has a population of 535,619, according to the 2006 Provisional Census fgure.Ikorodu is situated within the equatorial rain forest belt.It lies a few kilometers north of Lagos Lagoon and is less than 19 km from the Atlantic Coast.(Figure 1).Mangroves and abundant sedge grasses are found within the marshy coastal lowlands.
Because of its close proximity to Lagos,which is a mega city,Ikorodu is a strategic satellite town for Lagos.It lies entirely within the coastal plain,which is characterized by sand bars,lagoons and creeks.
Two main vegetation types were identifable in the study area:swamp forest of the coastal belt and dry lowland rain forest.The swamp forests are a combination of mangrove forests and coastal vegetation developed under the brackish conditions of the coastal areas and the swamp of the freshwater lagoons and estuaries.
Ikorodu is located in an upland area and has a topography that enhances the effective drainage through which several rivers fow into the Lagos lagoon.Geologically,the area is underlain by the Post-Cretaceous sediments of the Abeokuta Formation,which uncomfortably overlies the rocks of the Basement Complex,to the Quaternary Deltaic Plain Sands.The Quarternary geology of the study area composes the Benin formation(Miocene to Recent).Recent littorial alluvium and lagoon/coastal plain sand deposits(Longe et al.1987).The alluvium deposits consist mainly of sands,littorial and lagoon sediments formed between two barrier beaches(Adeyemi 1972)and coastal plain sands.The formation is thin in Ikorodu and is not favored to be an important aquifer(Offodile 2002).In addition,the arenaceous nature of the Benin formation makes it susceptible to contamination from anthropogenic sources.

Fig.1 a Location map of study area.b Map of study area showing locations of the samples
3 Methodology
The ffty surface stream sediment samples were collected from Ikorodu(the main stream)and its tributaries,such as Igbonla,Owode Onirin,Orimodu,Ketu Omotosho,etc. (Figure 1b).Sediment sampling was conducted during the period of May 2010,when the water was in a base fow regime.The samples were collected at a depth of 0–10 cm with the aid of a hand trowel,which was washed with a detergent,rinsed and dried before each use,so as to minimize contamination.Samples were taken from the uppermost layer of the sediments in order to minimize the contamination.The surface sediment layer was chosen,as this layer controls the exchange of metals between sediments and water(El Nemr et al.2006).The sampling locations were recorded using GPS localization.A set of sieves was used to separate the coarse grain from the fnegrained sediments,which were packed and labeled for onward transmission to the laboratory.
Samples were dried in the open air for few days,crushed by hand in a porcelain mortar and sieved through a 2 mm screen.Air-dried<2 mm samples were stored in plastic bags for subsequent analysis.The samples were later placed in a container and properly labeled,then fnally sent to ACME Laboratories,East Vancouver,Canada for analysis.The method of digestion adopted was after a neartotal digestion,by hydrofuoric-perchloric acid.The major, trace and rare earth elements in the stream sediments were analyzed using inductively coupled plasma-mass spectrophotometry(ICP-MS).
Theaccuracy oftheanalyticalmethods wasmonitoredby the repeated analysis of standard reference materials(i.e. GSD-9 and NIM-G),done together with a batch of sediment samples.Thesedatagavesatisfactoryresults,withanalytical values within±1–10%for different elements using the certifed ones(GSD-9),except K and P,and within±4% for K and P of the certifed ones(NIM-G).
4 Evaluation of data
Some quantitative indices were used to assess the heavy metal contamination.This also allowed for easy comparisons between the determined parameters.These indices included the Enrichment factor(EF),Contamination Factor (CF)and Contamination Degree(CD),Geoaccumulation Index(Igeo),Pollution Load Index(PLI),Enviromental risk index,ecological risk assessmentand potential ecological risk index(RI),as discussed in Gong et al. (2008),Sekabira et al.(2003),Saha and Hossain(2010), Zoynab et al.(2008)and Rapant et al.(2008),amidst others.
5 Results and discussion
The statistical table for major elements,as well as the Average Shale Concentration(ASC)(Turekian and Wedephol(1961),ispresentedinTable 1.Al,Ca,Fe,K,Mg,Na,S and Ti were the major elements analyzed in the stream sediments of the Ikorodu and its environs within Lagos, southwest Nigeria.The results showed that Fe,Al and Ca were the dominant major elements,having averages of 0.75, 0.26 and 0.20%,respectively(Table 1).The relative abundances of these major elements in the stream sediments were as follows:Fe>Al>Ca>Na>Mg>K>P>Ti (Table 1).Themajorelementsanalyzedrepresent1%ofthe chemical composition of the stream sediments in the study area,while the remaining 99%are likely Si and organic carbon,which are also dominant in the study area.
6 Variation of major elements in the study area
Iron(Fe)had the highest percentage in the stream sediments,ranging between 0.27 and 3.43%and an average value of 0.75%(Table 1),indicating that a signifcant amount of the element might have originated from the weathering of silicate-bearing rocks rich in feldspar and mica.In the study area,the pattern of distribution of Fe varied from location to location.The lowest value was found at the Ipakodu,while the highest value was found at the Igbonla stream sediments.The parent rock from which the stream sediments originated may have also been highly ferruginised,or have contained iron-bearing minerals.
Aluminum(Al)was the next dominant element in the stream sediments,ranging from 0.04 to 2.32%with an average value of 0.26(Table 1).It also had the highest concentration in the stream sediments of the Igbonla.This is typical of sedimentary rocks where aluminum is always higher than alkalis and calcium.It could also be a result of the enrichment of the underlying rocks in aluminosilicate minerals such as feldspars and mica.
Calcium(Ca)values ranged from 0.01 to 1.27%with an average value of 0.2%.The Ca content of the stream sediments in samples taken at the Orimedu area was relatively high when compared to the remaining samples.Potassium (K)and sodium(Na)values ranged from 0.01 to 0.21%and 0.002 to 0.896%,with an average value of 0.2 and 0.1 respectively.The highest value of K was found at the Oko-Esinkin,with a value of 0.16%,and was very low in other areas.Magnesium(Mg)value ranged from 0.01 to 0.29%, with an average value of 0.04.The highest Mg values in the samples were found at the Igbonla and Okorisun Berger sediments.Other major element like P and Ti were in low quantity,with average values of 0.01(Table 1).

Table 1 Summary of major elements in the stream sediments
All the major elements fell below the average shale concentration(ASC)(Turekian and Wedepohl 1961),except Na,which was above ASC value only in the Owode Ibeshe 1.These low concentrations indicated the defciencies of these elements in the stream sediments of the Ikorodu and its environs(Table 1).Defciencies of these major elements in the environment could be detrimental to the health of both man and animal,since they are necessary for metabolic activities.
7 Trace and rare earth elements
The trace elements and rare earth elements analyzed include Mo,Cu,Pb,Zn,Ag,Ni,Co,Mn,As,U,Au,Th,Sr, Cd,Sb,Bi,V,La,Cr,Br,Ti,B,W,Sc,Tl,Hg,Se,Te,Ga, Cs,Ge,Hf,Nb,Rb,Sn,Ta,Zr,Y,Ce,In,Re,Be,Li,Pd and Pt.The summary with ASC values were presented in Table 2.Trace elements such as Bi,B,W,Tl,Se,Te,Ge, Hf,Ta,In,Re,Be,Pd,Pt were below detection limit for all the samples.More than 50%of the stream sediments were below detection limit of 0.01,0.2,5,0.01,0.1,0.02,0.02, 0.1,0.1 and 0.1 for As,Au,Hg,Cd,Se,Bi,Hf,W,Be respectively.All the parameters were in ppm except Au and Hg that were in ppb.Pb,Zn,Cd,Sb,Sn,Th,La,Sc,Ce were above average shale concentration which was used as background value in some samples(Table 2).
The relative abundances of the signifcant trace elements in the stream sediments were as follows:Mn>Zn>Ba>Ce>Sr>V>Cu>Pb>Co>Ni>Th>As>Ag(Table 2).
8 Variation of trace elements in the study area
The most prominent trace element detected in the stream sediments was Manganese(Mn).Manganese ranged from 17 to 957ppmm with an average value of 126.1 ppm. Kurtosis and skewness showed values of 17.92 and 3.77, respectively(Table 2).It had the highest concentration value in the Igbonla stream sediments.Zn was the second most abundant trace element detected within a range of 2.3–3395.exde,an average value of 95.21 ppm and kurtosis and skewness values of 49.03 and 6.97,respectively.The highest concentration of Zn was found at the Ogun River and Owode Onirin.Ba ranged from 1.9 to 235.1 ppm,with the mean value of 25.29 and the highest value was found in the Ketu Omotosho Bridge.Ce,Sr,V,Cu,Pb,Co,Ni,Th, As and Ag had the following ranges 1.8–148.5,1.6–6.8, 0–63, 3.1–89.46, 0.07–238.29, 0.4–25.8, 1.1–18.3, 0.3–13.9,<0.1–3.5 and 0.03–132 ppm, respectively (Table 2).The Igbonla stream sediments showed the highest concentration of Mo,Cu,Pb,Zn,Ag,Ni,Co,Mn, Fe,As,Ca,Au,Cd,Sb,V,Cr,Ba,Sn,Zr and Pt,when compared with other samples.The concentration of Pb,Zn, Cd,Sb,Sn were above the background values in the Owode Onirin,Pb,Th,La,Sc,Co and Mn in the Igbonla, Zn,Cd and Cu in the Ikosi Ado,Pb and Cu in the Owode Elede.Ogun river sediments also showed high concentrations of Pb,Cd,Zn,Sb and Sn,while Ise sediments showed high concentrations of Pb and Sn.
9 Factor,Q mode cluster and correlation analyses of stream sediments
The factor analysis of all the trace elements from the stream sediments was carried out and the two factors which accounted for 86.34%of the total variance was generated in Table 3.Factor one,which accounted for 56.5%of total variance,was characterized by high loadings of Ni,Co, Mn,U,Th,Sr,V,La,Cr,Ba,Sc,Ga,Cs,Nb,Rb,Y and Ce.Factor two accounted for 30%of total variance and consisted of high loadings of Mo,Pb,and Zn,As,Cd,Sb, Sn,and Zr.In addition,there were two major clusters: cluster one consisted of Sc,G,La,Ce,Y,Cs,Rb,ba,Th,U, V,Cr,Ni,Nb Co and Cu,which corresponded to factor one in the factor analysis results,and Mo,Pb,Zn,As,Cd,Sb,Sn,and Zr,which was the same as those in group 2 for factor analysis.Trace elements in group one and two of the factor and cluster analyses were likely from geogenic and anthropogenic sources,respectively.

Table 2 Summary of trace elements in the stream sediments

Table 3 Result of factor analysis

Fig.2 Dendogram for the analyzed data for both elements and sample locations
TheQ-modeclusteranalysisforthesamplelocationsalso showed two clusters(Fig.2).Cluster one consisted of the Owode Onirin,Igbonla,Ikosi Ado,Owode Elede,Orile Odo Ogun and Majidun,which were characterized by sediments with high concentrations of metals,due to anthropogenic sources.Cluster two was made up of other locations,characterized with a low concentration of elements.
The result of the correlation analysis showed very signifcant correlations between Zn and Pb(r=0.98),Zn and Sb(r=0.99),Zn and Cd(r=0.99),Pb and Cd(r=0.98), Pb and Sb(r=0.99),Pb and Sn(r=0.84),As and Cd (r=0.94),Cd and Co(r=0.79),Mo and Pb(r=0.82), Mo and Zn(r=0.82)and Sb and Sn(r=0.84).U and Th(r=0.90),Ni and Co(r=0.77),Ni and Ba(r=0.91), U and Ba(r=0.94),U and Rb(r=0.96),Mg and Ni (r=0.91),Mg and Co(r=0.70),Mg and U(r=0.91),U and Pb(r=0.50),Th and Pb(r=0.11)and Sb and Sn (r=0.84)at the p<0.01 level(Table 4).
The strong correlation analysis between elements may refect similar levels of contamination and/or release from the same sources of pollution(Jansson et al.1993;Li et al. 2000).This confrmed the existing relationships between the metals as presented by both the cluster analysis and the factor analysis.There were strong positive correlations between Pb,Zn,Sb,As,Mo and Cd,which were the elements of group one,which likely came from anthropogenic sources(Table 4).There were also strong positive correlations between U,Th,Ba,Ni and Rb,which were the elements of group two,which likely came from geogenic or natural sources.The anthropogenic sources of metals within the study area included industrial and domestic waste,as well as vehicular effuents.


10 Assessment of contamination in stream sediments
Heavy metal pollution can be assessed with respect to world surface rock averages(Chakravarty and Patgiri 2009)or the widely used average shale(Shyamalendu et al. 2001;Harikumar et al.2009;Ong and Kamaruzzaman 2009,Sekabira et al.2003),with reference to the degree of contamination.The indices used are discussed below with their formulae.
11 Assessment of contamination according to United States Environmental Protection Agency(USEPA)
The chemical contamination in the stream sediments were evaluated in comparison to the sediment quality guideline proposed by the USEPA(Table 5).The present study showed that the sediments taken from the Owode Onirin were heavily polluted with Pb,Cu,Cd,Zn and moderately polluted with Cr.The Owode elede sediments were moderately polluted with Pb,Cr,Cu and Zn.The Igbonla and Ikosi Ado sediments were moderately polluted with Cu and Zn,respectively,while 14%of the samples were moderately polluted with Cr.The remaining samples were within non-polluted for all the metals according to USEPA standard.
12 Assessment of contamination according to metal enrichment or enrichment factor(EF)
As proposed by Simex and Helz(1981),EF was employed to assess the degree of contamination and to understand the distribution of the elements of anthropogenic origin from the sites by individual elements in sediments.Fe was chosen as the normalizing element while determining EF-values,since in wetlands,it is mainly supplied from the sediments and is one of the widely used reference elements (Loska et al.2003;Kothai et al.2009;Chakravarty and Patgiri 2009;Seshan et al.2010).Other widely used reference metals or elements included Al and Mn(Nyangababo et al.2005;Kamaruzzaman et al.2008;Ong and Kamaruzzaman 2009).The formula for the Enrichment Factor and its classifcations are stated below:
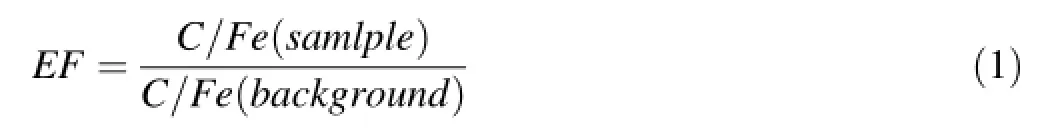
where,C is the concentration of element‘‘n’’.In this case, the background value is the average shale concentration (Turekian and Wedepohl 1961).
Six categories are recognized(Sutherland et al.2000).

Table 5 Comparison of trace elements with USEPA guidelines for sediments
• ≤1 background concentration,
• 1–2 depletion to minimal enrichment,
• 2–5 moderate enrichment,
• 5–20 signifcant enrichment,
• 20–40 very high enrichment and
•>40 extremely high enrichment.
Generally,the enrichment factors for Th,Hg,La,Ce and Mn were within the background concentration for all the stream sediment samples(<1)and did not indicate any mineralization or environmental contamination.All the stream sediments could be classifed as having background enrichment for Cd,Bi,Pt,Mo and Ag,except that of the Ogun river and Owode Onirin,which showed signifcant enrichment for Cd,Zn,Cu,Pb and Ag,depletion to minimal enrichment for Bi,Mo and moderate enrichment for Pt(Table 6).
The stream sediment samples from the Ogun River Owode Onirin,Igbonla,Orimedu 1 and 2 and Ketu Omotosho showed signifcant to extremely signifcant enrichment for Cd,Pb,Cu,Zn,Pt,Bi,Mo and Ag.These metals are toxic and can be detrimental to the environment.The samples with elevated metal ratios were anthropogenic in origin and were obtained from locations surrounded by identifed industrialestates,commercialcenters and densely populated centers.
13 Assessment according to contamination factor and contamination degree
In the present study,the contamination factor(CF)or enrichment ratio(ER)and the degree of contamination(CD) were used to determine the contamination status of sediments.The formula for the contamination factor and the degree of contamination are stated below:

The following terminology is suggested for describing the contamination factor(Cf)(Hakanson 1980):
• Cf<1:Low contamination factor,
• -1≤Cf<3:Moderate contamination factor,
• -≤Cf<6:Considerable contamination factor,
• -Cf≥6:Very high contamination factor.
The following terminology is also adopted when describing the degree of contamination(Cd values)according to(Hakanson 1980):
• Cd<7:low degree of contamination,
• 7≤Cd<14:moderate degree of contamination,
• 14≤Cd<21:high degree of contamination,
• Cd≥21:very high degree of contamination.
The highest contamination factor was found in the Owode Onirin,where the degree of contamination was 143.79.The stream sediment samples showed no contamination for Mo,Hg,Ni,Sr,V,Cr,Ba and Y,while Cu, Co,Mn,Th,La,Ce,Bi and Co fell within the low contamination factor.The contamination factors for Pb,Zn, Ag,As and Cd in the stream sediments were within low to very high contamination,with thefollowing ranges 0.03–11.91, 0.02–35.74, 0.04–18.89, 1.43–50 and 0.03–24.97 respectively(Table 5).Sediments with a very high contamination factor were found in the Ogun River, Owode Onirin,Igbonla,Orimedu 1 and 2 and Ketu Omotosho,which followed the same trend as the Enrichment factor.
The contamination degree(CD)ranged between 1.25 and 143.79,with an average of 18.33.The highest value was found in sample 1(Owode Onirin)and the lowest,in sample 41(Igbonla 7).76%of the samples fell within the low contamination degree,16%within moderate contamination,6% within considerable degree of contamination and 2% within a very high degreeof contamination(Table 7;Figs.3,4).
14 Assessment according to geo-accumulation index(Igeo)
As proposed by Mueller(1979),Igeo has been widely used to evaluate the degree of heavy metal contamination in terrestrial and aquatic environments.It is expressed as:


Table 6 Classifcation of metals based on enrichment factor

Table 7 Descriptive Statistics of element contamination factor and contamination degree
where Cn and Bn are as defned above,while 1.5 is a factor for possible variation in the background concentration,due to lithologic differences.The geo-accumulation index is classifed into seven descriptive classes as follows:<0 =practically uncontaminated;0–1 uncontaminated to slightly contaminated, 2–3=moderately to highly contaminated,4–5=highly to very strongly contaminated,>5=very strongly contaminated.
The latter is an open-end class that is indicative of all values greater than 5.A geo-accumulation Index of 6 is said to be indicative of the 100-fold enrichment of a metal, with respect to the baseline value(Mueller 1979).
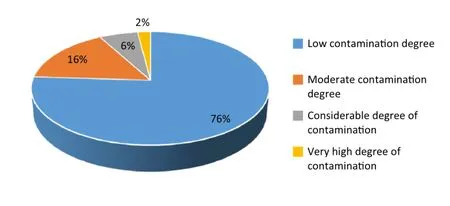
Fig.3 Bar charts showing contamination degree

Fig.4 3D map showing the contamination degree of the study area
Calculated geo-accumulation(Igeo)values based on the average shale concentration were presented in Table 8.A geo-accumulationindexofSc,Ga,Cs,Nb,Zr,Li,Ti,Mo,Ag, Co,Mn,Th,La,V,La,Cr,Ba,Sr and Ce fell within the class of 0,which indicated that all the stream sediments samples were practically uncontaminated.The stream sediments ranged between practically uncontaminated to moderately to highlycontaminatedwithPb,Zn,CdandSn,whileCu,Cr,Zr and Ba were within practically uncontaminated to slightly contaminated.Theheavilycontaminatedsampleswerefound intheOwodeOnirin,Igbonla,IkosiAdo,OwodeElede,Ogun river and Ise stream sediments(Table 8).

Table 8 Classifcation of signifcant metals based on geo-accumulation index
15 Assessment acicording to ecological risk assessment(Er)and RI
The USEPA in 1998 defned ecological risk assessment as a process that evaluates the likelihood of adverse ecological effects occurring now or in the future as a result of exposure to one or more sources of stress.
The purpose of ecological risk assessment is to assess ecological effects of human activities through a scientifcally credible evaluation(chemical assessment and individual bioassay)in order to protect and manage the environment.
An ecological risk factor(Eir)is to quantitatively express the potential ecological risk of a given contaminant, also suggested by Hakanson(1980)as:

where Tr is the toxic-response factor for a given substance, and Cf is the contamination factor.The Tr values of heavy metals by Ha˚kanson(1980)are also given in Table 3.The following terminologies are used to describe the risk factor:
• Er<40,low potential ecological risk;
• 40≤Er<80,moderate potential ecological risk;
• 80≤Er<160,considerable potential ecological risk;
• 160≤Er<320,high potential ecological risk;and
• Er≤320,very high ecological risk.
Although the risk factor was originally used as a diagnostic tool for the purpose of controlling water pollution,it was also successfully used for assessing the quality of sediments and soils in the environment affected by heavy metals.The toxic-response values for each element are in the following order;

Table 9 Pre-industrial reference level(kg/g)and toxic-response factor by Ha˚kanson(1980)

The assessment of the ecological risks of heavy metals in the stream sediments was completed by using the ecological risk assessmentand RI proposed by Hakanson 1980(Table 9).The Grades of the Environment by Potential Ecological Risk Index is presented in Table 10.
The RI was originally introduced by Hakanson to assess the degree of heavy metal pollution in soil,according to the toxicity of the metals and the response of the environment. RI could evaluate ecological risk caused by toxic metals comprehensively.The calculating method is:

RI is the potential ecological risk caused by overall contamination.The toxic response factor for some heavy metals are shown in Table 3.
The potential ecological risk factor(RI)was calculated as the s um of all the six risk factors(Table 11).It ranged between 7.74 and 932.5,with an average of 48.2.The RI values for all the locations fell in the class of low risk to the environment except Owode onirin,which fell within the class of very high risk.RI can characterize the sensitivity of a local ecosystem to toxic metals and represent the ecological risk resulting from the overall contamination.
16 Assessment according to Environmental Risk Index
The calculation for the environmental risk index value (IER)for stream sediment samples consists of two steps. The frst step is the calculation of the environmental risk quotient for each analyzed chemical element or compound
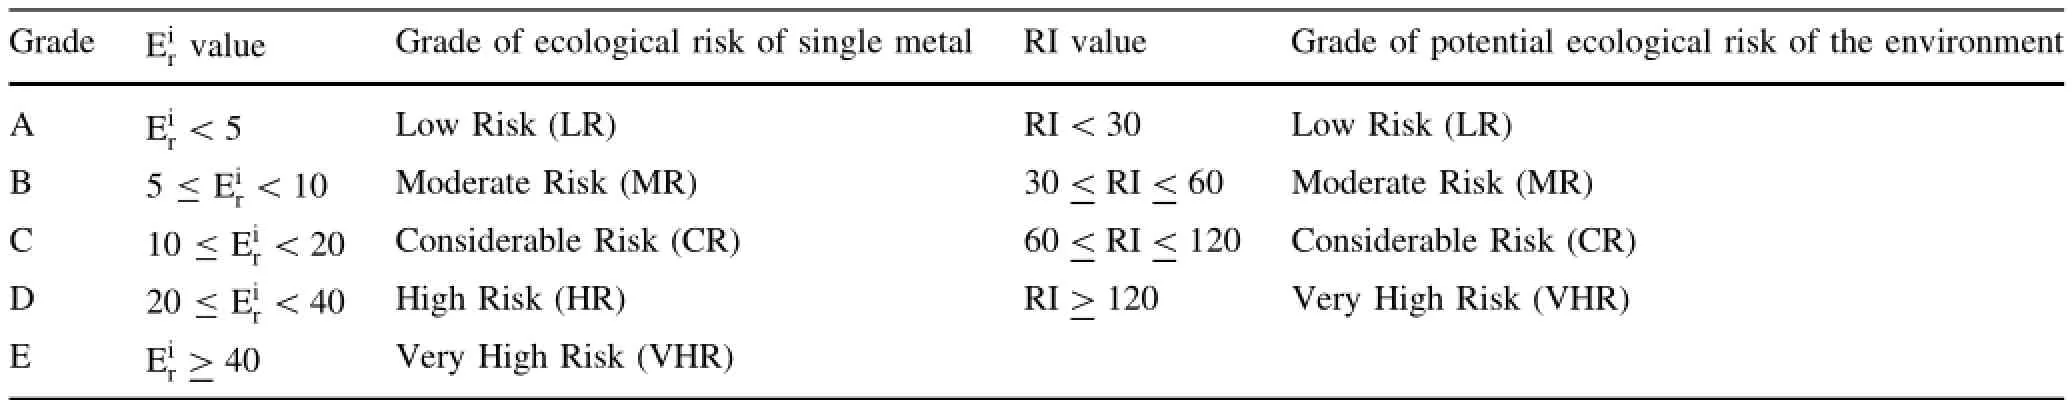
Table 10 Showing grades of the environment by potential ecological risk index

Table 11 Environmental risk assessment
that exceeds the limit risk values.In the second step,their sum is calculated according to the following scheme:

where QERiis the environmental risk quotient of element i, which exceeds the limit concentration.ACi is the analytical concentration of the element i;RCi is the limit concentration ofthe elementiwhich is average shale concentration(ASC)for this research,and IERis the environmental risk index of the sample tested.The trace elements that are below the ASC values were ignored and thus presumed to pose no environmental risk.
All the samples ranged between 1.28 and 102.54,which falls between medium to extremely high risk(Tables 11, 12).Only sample 1(Owode Onirin)fell within extremely high risk and affected toxic elements including Pb,Zn,Bi, Mo,Ag and Cd.The geochemical maps also showed areas with a high concentration of trace elements.
17 Environmental impacts of Ikorodu stream sediments
Major elements were below background values for all the samples.Defciencies of these major elements may be detrimental to the ecosystem,since the major elements are needed for the metabolic activities of plant,animal and man.Defciencies of these major elements could causeretarded growth in plants,animal and man,as well as anemia due to a defciency of iron.

Table 12 Quantitative assessment of ecological risk assessment,potential ecological risk factor and environmental risk assessment
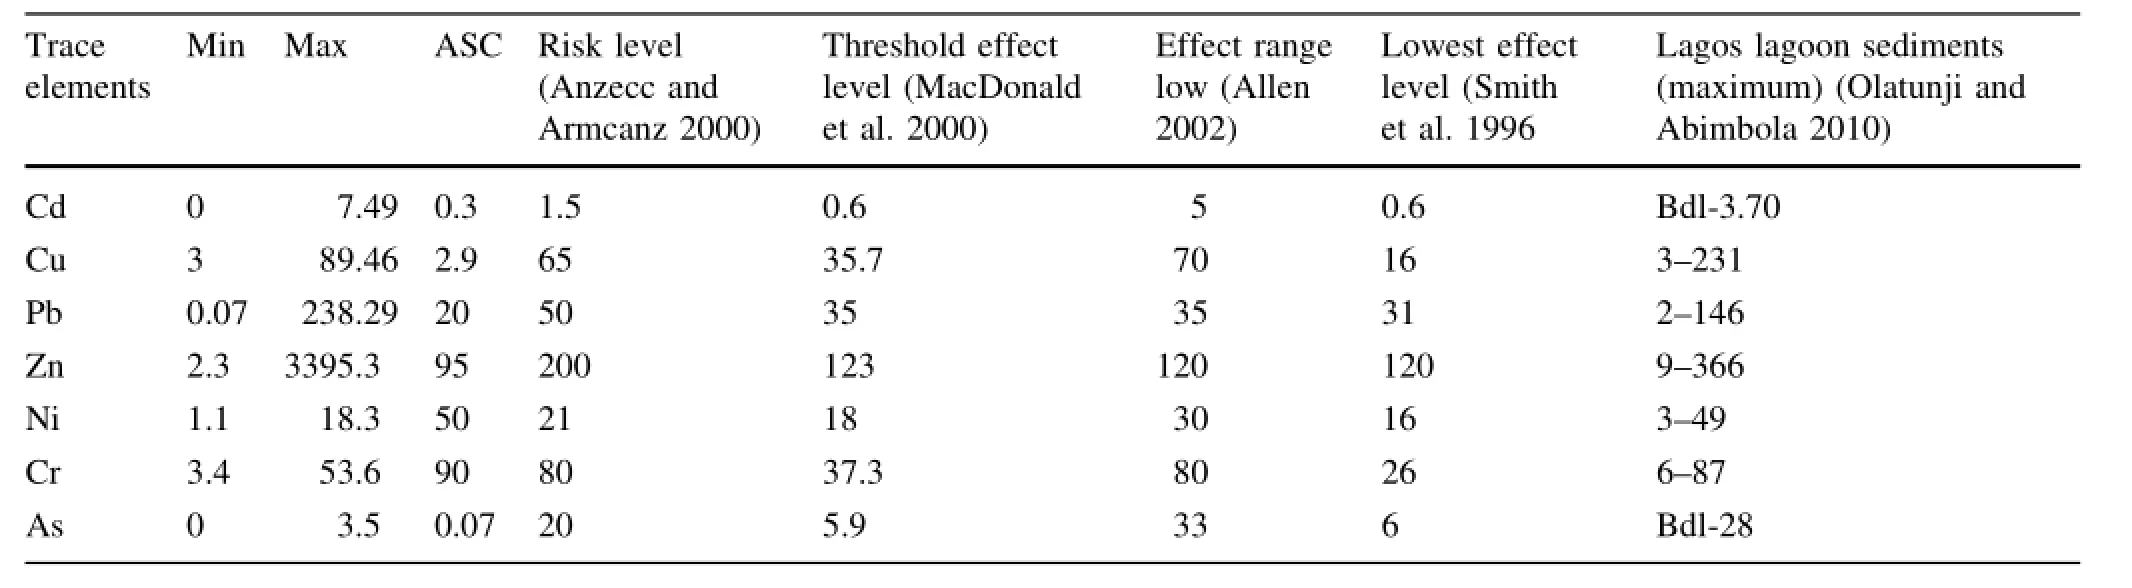
Table 13 Summary of toxic elements compare with other values in the stream sediments
The concentration of Trace elements in the stream sediments of the Ikorodu and its environs were also compared with other values and standards,such as the Lagos lagoon sediments(Olatunji and Abimbola 2010),Effect range low(Allen 2002),Risk level(Anzecc and Armcanz 2000),Threshold effect level(MacDonald et al.2000)and lowest effect level(Smith,et al.1996)(Table 13).The concentrations of Cd,Pb,Ni and Zn for the sample taken at the Owode Onirin were above all the other standards mention above;Cu was above all the other standards,but below the maximum value for the Lagos lagoon sediment. As in the Owode Onirin sediments was lower than all other standards.
Generally,the stream sediments sample from the Owode Onirin showed low to very high contamination of Cd,Bi, Be,Pt,Mo,Cu,Pb,Zn,Ag,Co,Mn,Th,La and Ce. Samples taken from the Ketu,Omotosho bridge,Igbonla, Ogun river,Ikosi Ado and Owode elede also showed different degrees of contamination with the above toxic elements.Only 14%of the samples showed different degrees of contamination with different toxic elements than those mentioned above.The sources of these toxic elements were possibly linked to waste from different industries in the study area,which was being discharged indiscriminately along the drainages and stream channels.These industries included textile industries,chemical and paint industries, breweries and bottling companies,metal industries,shipyards,plastic and petrochemical factories,paper mills and sawmills.
All the above toxic elements are carcinogenic and can affect different organs in both man and animal and can lead to death without the proper care.
18 Conclusion
Geochemical analysis of stream sediments of Ikorodu, Ogun River,Owode Onirin,Igbonla,Orimedu and environs in Lagos,Southwestern Nigeria was carried out to determine the quality that would affect economic,social and environmental decision making,such as the search for mineral resources,land use,agriculture and environment.
All of the major elements were of below average shale concentration(Turekianand Wedepohl,1961),except Na, which in only one sample indicated defciencies of these major elements,while their relative abundance were as follows:Fe>Na>Al>Ca>Mg>K>P.Defciencies of these major elements may also be detrimental to the ecosystem,since major elements are essential elements needed for the metabolic activities of plants,animal and man.
The relative abundances of the signifcant trace elements in the stream sediments were as follows:Mn>Zn>Ba>Ce>Sr>V>Cu>Pb>Co>Ni>Th>As>Ag.
Factor,Q mode cluster and correlation analyses showed two groups.Group one,which accounted for 56.5%of total variance,was characterized by high loadings of Ni, Co,Mn,U,Th,Sr,V,La,Cr,Ba,Sc,Ga,Cs,Nb,Rb,Y and Ce and group two,which accounted for 30%of total variance,consisted of high loadings of Mo,Pb,Zn,As,Cd, Sb,Sn,and Zr.
All the contamination indices showed that stream sediment samples from the Ogun River Owode Onirin,Igbonla, Orimedu 1 and 2 and Ketu Omotosho showed low contamination to very high continuation for metals like Cd,Pb, Cr,Cu,Zn,As,Pt and Ag,while a few samples showed a moderate contamination of Bi and Mo.
The Contamination Degree and Potential Risk values for all the locations fell in the class of low contamination risk to the environment except Owode onirin,which fell within the class of very high risk.
All the samples ranged between 1.28 and 102.54,which fell between medium to extremely high risk(Tables 11, 12).Only sample 1(Owode Onirin)fell within extremely high risk and affected toxic elements including Pb,Zn,Bi, Mo,Ag and Cd.The geochemical maps also showed areas with a high concentration of trace elements.
The contamination factor and contamination degree were the contamination indices most appropriate for the study area out of all the indices accessed,as they accessed the contamination of the individual trace elements and the environment.
These metals are toxic and can be detrimental to the environment.The samples with elevated metal ratios were anthropogenic in origin and were obtained from locations surrounded by identifed industrial estates,commercial centers and densely populated centers.
Adeyemi PA(1972)Sedimentology of Lagos Lagoon.Unpublished special B.Sc thesis,Obafemi Awolowo University Ile-Ife,Oshun State,Nigeria
Allen G(2002)Sediment quality criteria in use around the world. Limnology 3:65–76
Agbozu IE,Ekweozor IKE,Opuene K(2007)Survey of heavy metals in the catfsh synodontis clarias.Int J Environ Sci Technol 4(1):93–98
Anzecc and Armancanz(2000)Australian and New Zealand guidelines for fresh&marine water quality.Australian and New Zealand Environment and Conservation Council and Agriculture and Resource Management Council of Australia and New Zealand.Volume 1,part 3—aquatic ecosystems,p 106.http:// www.environment.gov.au/water/quality/nwqms/volume1.html
Atsuyuki O,Noboru I,Shigeru T,Yoshiko T(2005)Infuence of surface geology and mineral deposits on the spatial distributions of element concentrations in the stream sediments of Hokkaido Japan.J Geochem Explor 86:86–103
Chakravarty M,Patgiri AD(2009)Metal pollution assessment in sediments of the Dikrong River,NE India.J Hum Ecol 27(1):63–67
Dassenakis M,Scoullos M,Foufa E,Krasakopoulou E,Pavlidou A, Kloukiniotou M(1998)Effects of multiple source pollution on a small Mediterranean River.Appl Geochem 13(2):197–211
El Nemr A,Khaled A,Sikaily AE(2006)Distribution and statistical analysis of leachable and total heavy metals in the sediments of the Suez Gulf.Environ Monit Assess 118:89–112
Fletcher WK,Loh CH(1997)Transport of cassiterite in a Malaysian stream:implications for geochemical exploration.J Geochem Explor 57:9–20
Gong Q,Qingfei CW,Liqiang Y,Jun D(2008)Calculating pollution indices by heavy metals in ecological geochemistry assessment and a case study in parks of Beijing.J China Univ Geosci 19(3):230–241
Hakanson L(1980)Ecological risk index for aquatic pollution control, a sedimentological approach. Water Res 14(8):975–1001
Harikumar PS,Nasir UP,Mujeebu Raheem MP(2009)Distribution of heavy metals in the core sediments of a tropical wetland system.Int J Envir Sci Tech 6(2):225–232
Jansson RK,Lecrone SH,Gaugler R(1993)Field effcacy and persistence of entomopathogenic nematodes(Rhabditida:Steinernematidae,Heterorhabditidae)for control of sweetpotato weevil(Coleoptera:Apionidae)in southern Florida.J Econ Entomol 86:1055–1063
Kamaruzzaman MC,Ong MS,Noor A,Shahbudin S,Jalal KCA (2008)Geochemistry of sediment in the major estuarine mangrove forest of Terengganu Region,Malaysia.Am J Appl Sci 5(12):1707–1712
Karageorgis AP,Hatzianestis I(2003)Surface sediment chemistry in the Olympic Games 2004 sailing center(Saronikos gulf). Mediterranean Mar Sci 4(1):5–22
Kothai P,Prathibha P,Saradhi IV,Pandit GG,Puranik VD(2009) Characterization of atmospheric particulate matter using pixe technique.Int J Environ Sci Eng 1(1):27–30
Li XD,Wai OWH,Li YS,Coles BJ,Ramsey MH,Thornton I(2000) Heavy metal distribution in sedi-ment profles of the Pearl River estuary,South China.Appl Geochem 15:567–581
Longe EO,Malomo S,Oloruniwo MA(1987)Hydrogeology of Lagos metropolis.J Afr Earth Sci 6(2):163–174
Loska K,Wiechula D,Barska B,Cebula E,Chojnecka A(2003) Assessment of arsenic enrichment of cultivated soils in Southern Poland.Pol J Environ Stud 12(2):187–192
MacDonald DD,Ingersoll CG,Berger TA(2000)Development and evaluation of consensus-based sediment quality guidelines for freshwater ecosystems.Arch Environ Contam Toxicol 39:20–31
Miller CV,Foster GD,Majedi BF(2003)Basefow and stormfow metal fuxes from two small agricultural catchments in the coastal plain of Chesapeake Bay Basin,United States.Appl Geochem 18(4):483–501
Muller G(1979)Index of Geo-accumulation in sediments of the Rhine River.J Geol 2(3):108–118
Nicolau R,Galera-Cunha A,Lucas Y(2006)Transfer of nutrients and labile metals from the continent to the sea by a small Mediterranean river.Chemosphere 63(3):469–476
Nyangababo JT,Henry E,Omutange E(2005)Lead,cadmium, copper,manganese and zinc in wetland waters of Victoria Lake Basin, East Africa. Bull Environ Contam Toxicol 74(5):1003–1010
Offodile ME(2002)Groundwater study and development in Nigeria. Mecon Services Ltd.,Jos,Nigeria
Olatunji AS,Abimbola AF(2010)Geochemical evaluation of the LagosLagoonsedimentsandwater.WorldApplSciJ 9(2):178–193
Ong MC,Kamazzaman BY(2009)An assessment of metal(Pb and Cu)contamination in bottom sediments from south China sea coastal water Malaysia.Am J Appl Sci 6(7):1418–1423
Rapant S,Salminen R,Tarvainen T,Krcmova K,Cvec Kova V (2008)Application of a risk assessment method to Europe—wide geochemical baseline data.Geochem:Explor,Environ, Anal 8:291–299
Reid JC(1993)A geochemical atlas of North Carolina,USA. J Geochem Explor 47:11–27
Ren N,Xing D,Rittmann BT(2007)Micrbial community structure of ethanol type fermentation in between hydrogen production. Environ Microbial 9(5):1112–1125
Saha PK,Hossain MD(2010)Geochemical and ecoto-xical approach for evaluation of heavy metal pollution in the Buriganga River Sediment. In: Proceedings of Bangladesh geotechnical conference
Sekabira K,Oryem Origa H,Basamba TA,Mutumba G,Singh AK, Hasnain SI,Banerjee DK(2003)Grain size and geochemical portioning of heavy metals in sediments of the Damodar River—a tributary of the lower Ganga India.Environ Geol 39:90–98
Seshan BRR,Natesan U,Deepthi K (2010)Geochemical and statistical approach for evaluation of heavy metal pollution in core sediments in southeast coast of India.Int J Environ Sci Technol 7(2):291–306
Sheikh MA,Noah NM,Tsuha K,Oomori T(2007)Occurrence of tributyltin compounds and characteristics of heavy metals.Int J Environ Sci Technol 4(1):49–60
Shyamalendu BS,Abhijit M,Bhattacharyya SB,Amalesh C(2001) Status of sediment with special reference to heavy metal pollution of a blackish water tidal ecosystem in northern Sundarbans of west Bengal.Trop Ecol 42(1):127–132
Simex SA,Helz GR(1981)Regional geochemistry of trace elements in Chesapeake Bay.Environ Geol 3:315–323
Smith CR,Stammerjohn SE,Baker KS(1996)Surface air temperature variations in the western Antarctic Penisula region.In: Ross RM,Hofmann EE,Quetin LB(eds)Foundations for ecological research west of the Antarctic Peninsula(Antarctic Research Series v.70).American Geophysical Union,Washington DC,pp 105–121
Sutherland RA,Tolosa CA,Tack FMG,Verloo MG(2000)Characterisation of selected elemental concentration and enrichment ratiosin background and anthropogenically impatted roadside areas.Arch Environ Contam Toxicol 38:428–438
Thalmann F,Schermann O,Schroll E,Hausberger G (1988) Geochemical atlas of the Republic of Austria.Geol Surv Austria
Turekian KK,Wedepohl KH(1961)Distribution of the elements in some major units of the earth’s crust.Geol Soc Am Bull 72(2):175–192
UNDP/LASG(1985)Master plans for metropolitan Lagos.I and II
Zoynab B,Chowdhury SA,Hossain D,Nakagami K(2008)Calculating pollution indices by heavy metals in ecological geochemistry assessment and a case study in parks of Beijing.J China Univ Geosci 19(3):230–241
Zvinowanda CM,Okonkwo JO,Shabalala PN,Agyei NM(2009)A novel adsorbent for heavy metal remediation in aqueous environments.Int J Environ Sci Technol 6(3):425–434
Received:16 November 2014/Revised:7 December 2014/Accepted:12 December 2014/Published online:19 May 2015
©Science Press,Institute of Geochemistry,CAS and Springer-Verlag Berlin Heidelberg 2015
✉ Abiodun M.Odukoya
amodukoya@unilag.edu.ng
Olumuyiwa Akande
sesanbiodun@yahoo.com
1Department of Geosciences,University of Lagos,Lagos, Nigeria
杂志排行

Acta Geochimica的其它文章
- Sulfur determination by laser ablation high resolution magnetic sector ICP-MS applied to glasses,aphyric lavas, and micro-laminated sediments
- A large carbon pool in lake sediments over the arid/semiarid region,NW China
- Distributional characteristics and sources of elements in soil from typical area of Pearl River Delta economic zone,Guangdong Province,China
- Heavy metal(loid)pollution in mine wastes of a Carlin-type gold mine in southwestern Guizhou,China and its environmental impacts
- The controls on the composition of biodegraded oils in the Liuhua11-1 Oilfeld,Pearl River Mouth Basin,South China Sea
- Spatial pattern and distribution regularity of soil environmental quality in East China