Determining the fuorescent components in drilling fuid by using NMR method
2015-01-17WangZhizhanQinLimingLuHuangshengLiXinCaiQing
Wang Zhizhan•Qin Liming•Lu Huangsheng•Li Xin•Cai Qing
Determining the fuorescent components in drilling fuid by using NMR method
Wang Zhizhan1•Qin Liming1•Lu Huangsheng1•Li Xin1•Cai Qing2
Fluorescent additives can reduce drilling operation risks,especially during high angle deviated well drilling and when managing stuck pipe problems.However,they can affect oil discovery and there is a need to reduce the level of fuorescents or change the drilling fuids to prevent loss of drilling velocity and effciency.In this paper,based on the analysis of drilling fuids by NMR with high sensitivity,solid and liquid additives have been analyzed under conditions with different fuorescent levels and temperatures.The results show that all of the solid additives have no NMR signal,and therefore cannot affect oil discovery during drilling.For the liquid additives with different oil products,the characterizations can be quantifed and evaluated through a T2cumulated spectrum,oil peak(T2g),and oil content of the drilling fuids.NMR can improve the application of forescent additives and help us to enhance oil exploration benefts and improve drilling operations and effciency.
Fluorescent additives·Drilling velocity and effciency·NMR analysis·Well logging·Drilling fuids
1 Introduction
Low-feld NMR logging plays an important role in formation evaluation,including pore structure,porosity,permeability,and fuid types in reservoirs.Recently,NMR logging has been applied in unconventional reservoirs, including shale gas and tight sandstone(Coates et al.1999; Prammer et al.1994;Murphy 1995;Lizhi 1998).The NMR experiment technique has the advantages of being a rapid and nondestructive analysis.Also,NMR can return many reservoir parameters(Coates et al.1999).Recently,lowfeld NMR logging and experiment analysis have been used extensively in formation evaluation.However,in petroleum engineering,the NMR technique is used less.Considering the safe drilling operations,during drilling the deep well,ultra deep well,extended reach well,or horizontal well;or managing the drilling problems such as stuck pipe or tool and string failure,the drilling fuids should be added into many additives including solid types (sulphonated bitumen,brown coal,etc.)and liquid types (diesel oil,crude oil,etc.)with high fuorescence intensity. If oil layers cannot be identifed and evaluated immediately by mud logging,the fuorescent levels of the drilling fuid can reach the 4th level(5 mg/l).When the fuorescent level of the drilling exceeds the 4th level standard,the drilling fuids should be changed or circulated to improve drilling velocity and effciency.For example,in Well BT6 of the Bamai oilfeld in the Xinjiang area,it took more than 17 days to drill for the fourth time.Discrimination between the fuorescent additives and the crude oil in formation is necessary for effcient oil exploration,exploitation,and drilling operations.
Aiming at these problems,long-term research has been carried out by the mud-logging experts leading to the development of many methods including gas chromatographand quantitative fuorescence techniques(Xixian et al. 2000;Fuhua et al.2001a,b;Xiexian et al.2003;Xingli et al.2007).Although these methods can resolve some problems,they can only qualitatively describe the fuorescence characterizations based on the variable curves or the differences among chromatographs,and they cannot identify the different sources of mixed oils.In the‘‘National Eleventh Five Year’’plan in China,the exploration and development strategy focused on unconventional resources such as shale gas,tight sand,etc.In extracting these resources,horizontal wells are generally drilled with oil-based fuids,which demand new technology to distinguish the fuorescent sources from fuid additives or formation oilshow.Through theuse ofperformance parameters,analysis parameters,and detection limits of the spectrometer,NMR analysis with high fuid sensitivity has been used to differentiate the fuorescent characteristics of the solid and liquid additives including:(1)different fuorescent levels in the crude oil;(2)variable temperatures;and(3)added relaxation reagent or not.Through trial and error,a new technique has been established to quantitatively identify fuorescent additives and crude oil in the formation.
2 Experiment
2.1 Experiment spectrometer
Two spectrometers used for the normal and variable temperature experiment were produced by the NiuMai electronic technology company in Shanghai,China.The parameters of the spectrometers are shown in Table 1.
2.2 The samples
Solid additives were taken from wells in the Xinjiang area, including sulphonated bitumen,sulphonated lignite,temperature-resistant and salt-resistant fltration-reducing agents,CXB-1,CMP-3,non-fuorescent lubricant,SMP-1,SMP-2,ammonium salt,CMC-HV,CMC-LV,and kalium polyacrylate.

Table 1 The parameters of two spectrometers used in experiment
The crude oil samples were derived from some exploitation wells in the Jiyang depression in China.The densities of the fve samples were 0.77,0.83,0.8974, 0.9455,and 0.9712 g/cm3respectively.The water-based drilling fuids were taken from 1491.71 m depth of Well S14-7 in the Jiangsu oilfeld with a density of 1.13 g/cm3. This well did not reach the target zone,with no fuorescent additives or formation oil.
3 Analysis results and applications of the solid additives
Fourteen types of solid additives were dissolved in water, drilling fuids,and relaxation agents and then analyzed by NMR.In addition,some additives were dissolved in drilling fuid and then analyzed with variable temperatures. The results indicate that the additives have no NMR signal.
Two possible reasons for the results are:(1)the forescent additives are mostly composed of the high molecular functional group such as benzene rings,carboxyl groups, and hydroxyl groups,etc.These additives containing aromatic rings have forescent characteristics,but the hydrogen atoms in the compounds occur as high molecules (Fuhua and Huisheng 2000).Therefore,due to the shielding effect,the chemical shift of the hydrogen atoms is so high that they have no signal with the low-frequency NMR method used.(2)The velocity or the density is inversely proportional to relaxation(Ranhong et al.2007).The solid additives are dissolved in the drilling fuids with high velocity and exceed the detection limit of the NMR spectrometer,leaving the NMR signal very weak.
3.1 Results and analysis under the normal temperature condition
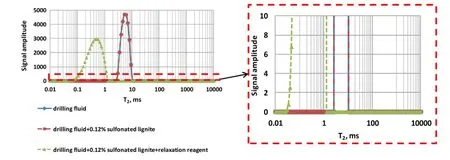
Drilling fuids with different proportions of solid additives were analyzed by the MR-DF type of NMR spectrometer. The results show that there is no new peak in the T2spectrum.After adding the 2000 ppm relaxation reagent, the T2spectrum shows only one peak(Fig.1),which indicates that these additives have no NMR signal.
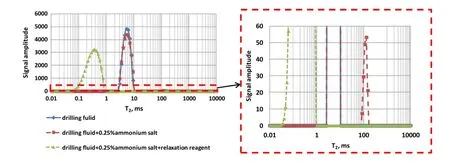
After adding some additives,including the temperature resistant and salt tolerant fltrate reducer,SMP-1,SMP-2, ammonium salt,carboxy methyl cellulose CMC-HV, CMC-LV,high molecular,and kalium polyacrylate,the T2spectrum on the right side shows a small peak.When adding relaxation reagent,the peak disappears(Fig.2).The peak is generated by hydration and the relaxation reagent can shield the water signal.The amplitude of the hydrated peak is proportional to the content of the forescentadditives.These additives can reduce the water loss of the drilling fuid,because they contain abundant hydrophilic radicals(carboxyl and oxy groups)and integrate closely with the clay grains in any position.The water molecule is polarized and changed into a hydrated layer(Fengyin et al. 1991;Chuanguang et al.1996).

Fig.1 The NMR response characteristics of the sulphonated lignite

Fig.2 The NMR response characteristics of the ammonium salt
3.2 Results and analysis of the high temperature experiment
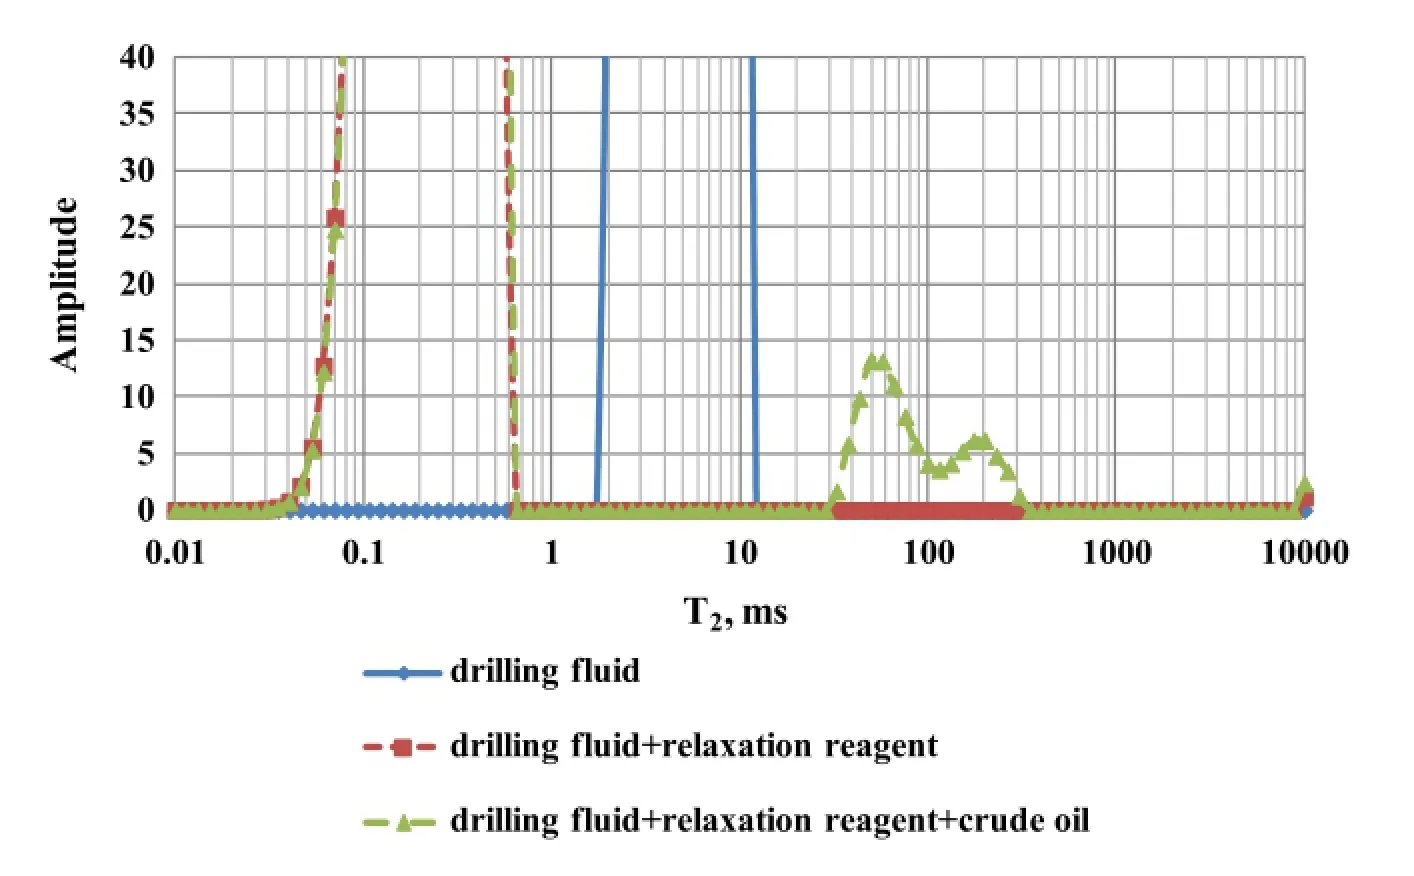
The sulfonated bitumen was analyzed under the temperature of 90 and 150°C by the MicroMR spectrometer. Because the sample holder of the variable temperature detector was not composed of tetrafuoride,it was necessary to use glass tubes instead,which produced some signal and affected the results.When sulfonated bitumen was added to the drilling fuid,the T2spectrum showed a small peak on the left side of the drilling fuid peak,indicating clay-bound water under the high temperature condition. When the drilling fuid is added by the sulfonated bitumen and relaxation reagent,the T2 spectrum shows that the sulfonated bitumen has no signal(Fig.3).
3.3 Application examples
During the Well S14-7 operations,drilling fuids were added two ton weight of sulphonated bitumen at a depth of 1490 m.Fluid analyzed by NMR showed one T2spectrum peak with an area of 26,453.97.With the addition of the relaxation reagent,the T2spectrum also displayed one peak.Furthermore,the drilling fuids were continuously supplemented by MnCl2at 2-m intervals while drilling.At a depth of 2036 m,one new peak appeared with an area of 107.61.The content of crude oil calculated was 0.41% (Fig.4).When the well was completed,this interval was interpreted as an oil layer.
4 Experiment results and application of the liquid forescent additives

Fig.3 The T2spectrum distribution of sulphonated bitumen under the condition of the 90°C temperature

Fig.4 The T2distribution of the drilling fuid in Well S14-7
Liquid forescent additives consist of oil products,such as white oil,diesel oil,and crude oil.Generally,when the density of the drilling fuid is less than 0.9 g/cm3,the oilpeak and drilling fuid peak can be separated (Xiaoqiong et al.2011).However,when the density is more than 0.9 g/cm3,the oil peak and drilling fuid peak may overlap.In this case,the drilling fuids should be analyzed by the 2D-NMR method a relaxation reagent employed to discriminate the oil and drilling fuids signals.
4.1 The computed method of the oil content
The content of the oil in the drilling fuid usually can be computed by the peak area ratio and calibration methods.
4.1.1 Peak area ratio method
When the oil and water signals are separated by the 1D NMR or 2D NMR technique,the oil content can be expressed by the ratio of the oil signal area and the total signal area.While the oil and drilling fuid signals should be separated by adding relaxation reagent,the oil content can be expressed by the ratio of the oil signal area supplemented by MnCl2to the total area without addition of MnCl2.Oil quality can be determined because the oil has a different response signal based on hydrogen content.Oil content should then be corrected based on oil quality.The advantage of this method is that there is no need to establish a linear equation based on multiple samples;onesample can calibrate the spectrometer.However,the oil content calculated is a relative ratio and this method is not suitable for on-line analysis.
4.1.2 Calibration method
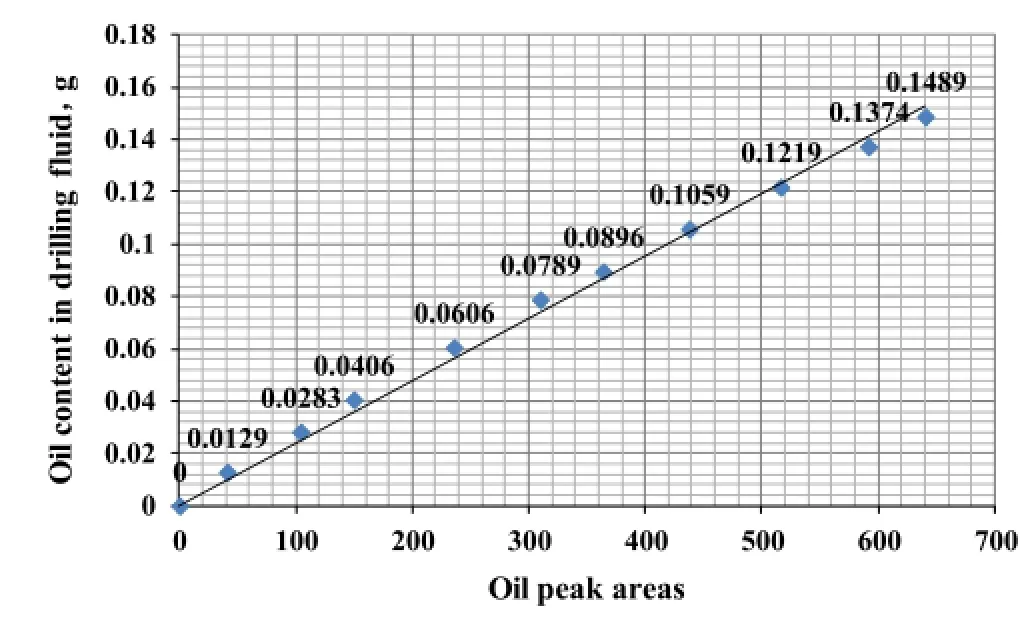
Having calibrated by the different oil content of the samples,the correlation of the amplitude or area of the oil and oil content can be calculated.Based on the results,the oil content of the samples can be computed by the oil signal area or amplitude and also should be calibrated for oil quality(Fig.5).This method computes the absolute oil content and is suitable for on-line analysis,but it requires a series of standard samples with different oil quality.
The source of the forescent matter can be quantitatively identifed based on the oil peak(T2g),the oil content,andthe T2cumulative spectrum after the standard overlying spectrum.Because the amount of the samples is different in each analysis,to be able to compare results this method should be calibrated.The procedure is as follows:before the analysis of the samples,the sample is massed by electronic balance as Wdi(di is depth).The quantity of the sample is 10 g,and the amplitude of T2can be calibrated by 10/Wdi.In this way a T2cumulative spectrum can be obtained for each sample.

Fig.5 The correlation chart between the oil peak areas and the drilling fuid
5 Application examples
During the drilling process for Well W349-26,at a depth of 2695 m,the drilling fuids were added by the 8 ton weight of white oil.From the NMR results of the drilling fuids at 2697 m depth,one new peak showed on the right side of the drilling fuid and the oil content was 4.21%.After continuous analysis,at 2850 m the oil content of the drilling fuids changed and the density of the oil became heavier.The T2gspectrum was reduced from 64 to 46 and the oil content reduced to 2.97%.These observations indicated a new oil layer.At 3307 m,the oil quality changed again.The T2gspectrum decreased from 46 to 42 and the oil content was 1.85%.From the T2differential and cumulative spectrums,the oil quality varied in the depth so that the forescent source could be identifed and evaluated quantitatively.
In virtue of the standard process of the T2and cumulative spectrums,three groups stand out for the drilling fuids:the frst one was at depths of 2697 and 2700 m;the second one was at a depth of 2850 m;the third one was at depths of 3307,3312,3347,and 3365 m(Fig.6).

Fig.6 The T2distribution of drilling fuids in Well W39-29(a T2differential spectrum;b T2cumulative spectrum)
6 Conclusions
In drilling fuids,additives improve drilling effciency and can be divided into two types:solid and liquid additives. Solid additives include sulfonated bitumen,SMP-1,SMP-2,ammonium salt,carboxy methyl cellulose CMC-HV, carboxy methyl cellulose CMC-LV,etc.Liquid additives include diesel oil,white oil,or formation crude oil. Through two types of NMR additive analysis,the NMR signal of the drilling fuid can be determined.Both types of additives can be easily distinguished by NMR analysis. NMR technology can also effectively distinguish the NMR signal response between solid forescent additives and the crude oil in the formation and defnitively resolve the problem that the additives have on the discovery of oil layers.
According to the standard T2cumulative spectrum and T2gof the oil peak,liquid additives can be identifed accurately and quantitatively evaluated by the oil content even if mixed with similar source oil.This method overcomes the weakness both of the gas chromatography and the quantitative fuorescence technique.
Using the NMR drilling technique absolutely settles the problem of the identifcation and evaluation of forescent matter in the drilling fuid.In short,this technique enhances oil exploration and improves drilling operations and effciency.
Chuanguang Z,Mingbo S,Wanguo H et al(1996)Study on function mechanism of fltration:comparison.Drill Fluid Completion Fluid 13(3):11–17(in Chinese)
Coates GR,Lizhi X,Prammer MG(1999)NMR logging principles and applications.Halliburton Energy Services Publication, Houston
Fengyin Z,Zhongqi Z,Hong C(1991)Viscometric behavior of SMP aqueous solution. J Zhengzhou Univ (Nat Sci Edit) 23((1):109–111(in Chinese)
Fuhua W,Zhengsong Q,Jienian N(2001a)A new method for evaluating fuorescence emission of drilling mud and mud additives.J Univ Pet China 25(4):39–43,46(in Chinese)
Fuhua W,Zhengsong Q,Jienian N et al(2001b)Method of quantitative fuorescence evaluation on drilling fuid additives. Oil Drill Prod Technol 23(3):1–4(in Chinese)
Jingzun W,Huisheng Z(2000)The synthetical analysis technique of the complex samples.Chemistry industry Press,Beijing(in Chinese)
Lizhi X(1998)NMR imaging logging principles and applications. Science Press,Beijing(in Chinese)
Murphy DP(1995)NMR logging and core analysis—simplifed. World Oil 216(4):65–70
Prammer M G.NMR pore size distributions and permeability at the well site[C].SPE 28368,SPE Annual technical conference and exhibition proceedings,v.Ω(Formation evaluation and reservoir geology),1994,55–64
Ranhong X,Lizhi X,Tianding L(2007)NMR relaxation properties of crude oils.J Southwest Pet Univ 29(5):21–24(in Chinese)
Xiaoqiong X,Wang Zhizhan P,Denggang P et al(2011)Detecting oil content in drilling fuid with NMR.Chin J Magn Reson 28(2):237–243(in Chinese)
Xiexian Z,Shuhong Q,Qiulai Y(2003)The Infuence of drilling fuid mixed with oil or organic additive on logging and logging method.Offshore Oil 23(2):73–77(in Chinese)
Xingli H,Zehua L,Hongjie Z(2007)Application of difference chromatographic analysis technique in gas logging.Mud Logging Eng 18(2):20–22(in Chinese)
Xixian F,Zhu Hongwei F,Daiguo F et al(2000)Recognizing and interpreting methods of oil and gas under drilling fuid‘‘pollution’’.Pet Geol Oilfeld Dev Daqing 23(2):28–29(in Chinese)
Received:15 April 2014/Revised:14 October 2014/Accepted:11 November 2014/Published online:27 March 2015
©Science Press,Institute of Geochemistry,CAS and Springer-Verlag Berlin Heidelberg 2015
✉ Qin Liming
qinliming2006@126.com
1SINOPEC Research Institute of Petroleum Engineering, Beijing 100101,China
2Niumai Electronic Technology Limited Company, Suzhou 215163,China
杂志排行
Acta Geochimica的其它文章
- Sulfur determination by laser ablation high resolution magnetic sector ICP-MS applied to glasses,aphyric lavas, and micro-laminated sediments
- A large carbon pool in lake sediments over the arid/semiarid region,NW China
- Distributional characteristics and sources of elements in soil from typical area of Pearl River Delta economic zone,Guangdong Province,China
- Heavy metal(loid)pollution in mine wastes of a Carlin-type gold mine in southwestern Guizhou,China and its environmental impacts
- The controls on the composition of biodegraded oils in the Liuhua11-1 Oilfeld,Pearl River Mouth Basin,South China Sea
- Spatial pattern and distribution regularity of soil environmental quality in East China
