Benzene and Toluene Levels Measured with DOAS During Vehicular Restrictions in Beijing
2015-01-13SuwenLiPinhuXieMinhongWeiJingtoWng
Su-wen LiPin-hu XieMin-hong WeiJing-to Wng
a.Huaibei Normal University,Huaibei 235000,China
b.Key Laboratory of Environmental Optical&Technology,Chinese Academy of Sciences,Hefei 230031, China
Benzene and Toluene Levels Measured with DOAS During Vehicular Restrictions in Beijing
Su-wen Lia,b∗,Pin-hua Xieb,Min-hong Weia,Jiang-tao Wanga
a.Huaibei Normal University,Huaibei 235000,China
b.Key Laboratory of Environmental Optical&Technology,Chinese Academy of Sciences,Hefei 230031, China
Measurements of atmospheric benzene and toluene were carried out continuously using differential optical absorption spectroscopy from August 7 to August 28 in Beijing during the period of vehicular restrictions.The correlations between trafc fows and totals of benzene and toluene were studied during the period of vehicular trafc restrictions from August 17 to August 20 and non-trafc restrictions on August 16 and August 21.The correlation coeffcient was 0.8 between benzene and toluene.And the calculated daily mean value ratios of benzene to toluene were 0.43−0.50.During the period of vehicular restrictions,trafc fows were reduced about 11.8%and the levels of benzene and toluene were reduced by 11.4% and 12.8%,respectively.The vehicle emissions were recognized as the ma jor sources for atmospheric benzene and toluene in Beijing.
Diferential optical absorption spectroscopy,Benzene and toluene,Vehicular restrictions,Trafc emissions,Trafc fows
I.INTRODUCTION
Aromatic hydrocarbons play an important role in the chemistry of polluted urban air by taking part in reactions to promote photochemical smog,e.g.formation of O3.A large variety of aromatic compounds,for example,benzene and toluene,are the potential cancerogens[1−4].The motor vehicle emissions are major atmospheric pollution sources of benzene and toluene in Beijing[5,6].
In order to improve environmental quality of Beijing, a series of measures to control pollution have been taken by Beijing municipal authorities,specifcally relating to treatment of coal dusts,industrial pollution,motor vehicle emissions,and so on.The efciency of these measures is obvious over the past decade in Beijing,China. Now,motor vehicular emissions in Beijing are also one of the main pollution sources[5].Aggressive measurements are instituted by Beijing municipal authorities to restrict vehicular trafc in China’s capital,Beijing. The motor vehicles with even and odd-numbered license plates were restricted to start of at 6−24 o’clock on alternate days from August 17−20.Nearly 1.3 million vehicles would be taken of the roads during the period of vehicular trafc restrictions.
The benzene and toluene concentrations of trafc emissions were investigated by diferential optical absorption spectroscopy system over Jian-xiang Bridge in the north fourth loop(36◦59′08′′N,116◦22′30′′E)during the period of vehicular restrictions.In order to study the efciency of trafc restrictions,the micropulse radar instruments were also used to monitor the trafc fows at measurement site.These will provide original data and experience to test air quality of Beijing.
II.MONITORING SITE AND DIFFERENTIAL OPTICAL ABSORPTION SPECTROSCOPY SYSTEM
Monitoring site was near the Olympic main stadium.Diferential optical absorption spectroscopy system[7−9]was put on library’s building in Beijing Information Science and Technology University.The refector mirrors were put on another building.Optical path was 528 m across Jian-xiang Bridge(36◦59′08′′N, 116◦22′30′′E).Monitoring period was from August 7 to August 28.The retrieved spectral range of spectroscopy varied from 243 nm to 253 nm with a spectral resolution of 0.41 nm,which are characteristic absorption peaks of benzene and toluene.The time resolution of the measurements varied from 2 min to 5 min,depending on visibility.The meteorological parameters and trafc fows had also been measured continuously during measurement period at monitoring site.

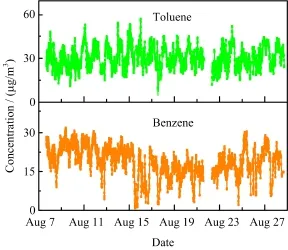
FIG.1 Time series of benzene and toluene concentrations.
III.RESULTS
A.Time series of benzene,toluene,and meteorological data
Figure 1 is the time series of benzene and toluene measured by the diferential optical absorption spectroscopy system from August 7 to August 28.The daily mean value of benzene and toluene concentrations is shown in Fig.2.Figure 3 is an overview of the meteorological parameters during the period of measurement at monitoring site.The similar weather conditions appeared in the period of August 8 to August 15,which was dominated by sunny weather and high visibility. The static steady weather appeared from August 16 to August 21,foggy weather and low visibility in the morning,improved visibility in the afternoon.Wind direction was southeast wind,which was against the pollutant dispersion.
For non-restricted motor trafc,benzene and toluene concentrations maintained at a high level(see Fig.2)at monitoring site from August 8 to August 16.The vehicular trafc restrictions were carried out from August 17 to August 20.Therefore,the concentrations of benzene and toluene were continuously decreased during the period of trafc restrictions.A low value of benzene and toluene concentrations appeared on August 20.The maximum values of benzene and toluene concentrations appeared when vehicular trafc restrictions were cancelled on August 21.A minimum concentration appeared because of high wind speed on August 23.After this,concentrations of benzene and toluene tended to accumulate during whole feld campaign.
The concentrations of benzene and toluene showed diurnal variation with low concentration at noon and peaks during rush hours in the morning and in the evening[10−12].The everyday maximum concentrations of benzene and toluene appeared around 20∶00 during the monitoring period.It was mainly because trafc fows reached the maximum at this moment.

FIG.2 Daily mean value of benzene and toluene concentrations from August 7 to August 28.

FIG.3 Time series of the meteorological parameters.RH is relative humidity,WD is wind direction,WS is wind speed.
B.Analysis during the period of vehicular restrictions
The motor vehicles were restricted to start of in the single or double day for a four-day from 6 o’clock to 24 o’clock on August 17 to August 20.The meteorological conditions were similar in these days.The weak high pressure,low wind speed,temperature and high humidity were against the pollutant dispersion.Therefore,the days of August 17 to August 20 were called the period of vehicular restrictions.The concentrations of benzene and toluene during this period were compared with those of the days before and after vehicular restrictions.The efciency of vehicular restrictions was assessed according to the measurement results.Moreover, the concentrations were emphatically analyzed duringthe restricted vehicular trafc period from August 17 to August 20 and non-restricted vehicular trafc days on August 16 and August 21.
Hourly mean value of benzene concentrations is shown in Fig.4 during whole measurement period of restricted and non-restricted vehicles.The higher concentration of benzene appeared at around 2 o’clock to 3 o’clock in the morning with the lowest temperature, lack of sunlight,and small air disturbance,which was against dispersion of volatile organic compounds.The elevated concentrations of benzene series appeared during rush hours(8∶00−9∶00)in the morning.The traffc fows were smaller at midday resulting in the reduced benzene concentrations.With the coming of rush hour,the maximum value of benzene was observed again during peak hours in the evening(20∶00−22∶00). The trends of benzene concentrations were similar during restricted and non-restricted period.The benzene concentrations decreased by 11.4%due to the vehicular restrictions.
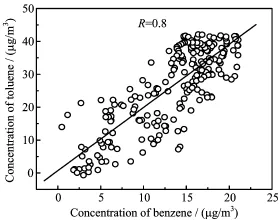
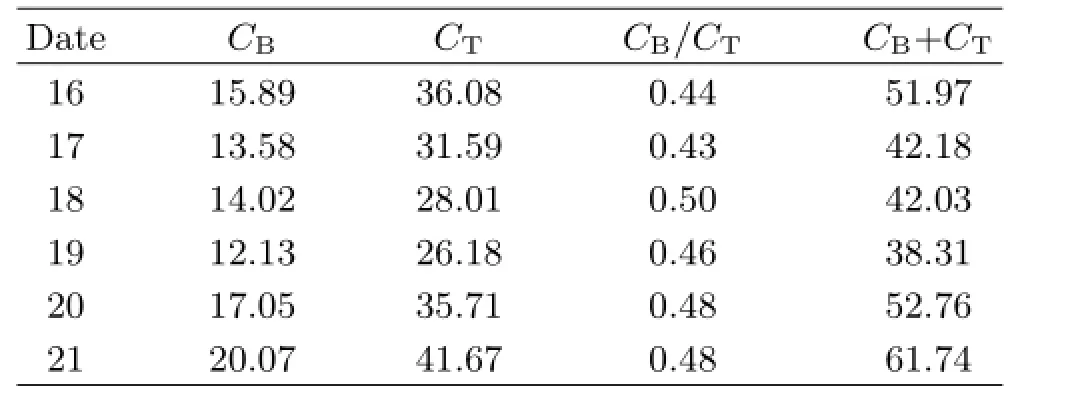
Figure 5 is the correlation of benzene and toluene during measurement period.A better correlation could be found between benzene and toluene during the feld campaign.The correlation coefcient was 0.8,which showed that benzene and toluene could come from the same pollution sources.Calculated daily mean value ratios of benzene to toluene were 0.43−0.50.The major benzene and toluene emission source was directly correlated with motor vehicle trafc if the ratios between benzene and toluene were around 0.5[10,11].Table I shows ratios and total concentrations of benzene to toluene during the whole period of measurement.Results showed that automobile emissions are the primary sources of benzene and toluene.
Figure 6 is the correlation of total concentrations of benzene and toluene and trafc fows.We can see the similar trend appeared between the benzene series and trafc fows.Results indicated that trafc restrictions reduced the levels of benzene,toluene of 11.4%and 12.8%during the period of trafc restrictions,respectively.While trafc fows were reduced about 11.8%. Trafc restrictions were important in order to keep good atmospheric quality in Beijing.

FIG.4 Hourly mean value of benzene concentrations.

FIG.5 The correlation of benzene and toluene concentrations.The correlation coefcientRwas 0.8.

FIG.6 Correlation of total concentrations of benzene and toluene and trafc fows.

TABLE I Daily mean value ratios of benzene concentrationCBto toluene concentrationCTand their total concentrations on August 16 to August 21.Concentration inµg/m3.
IV.CONCLUSION
DOAS system was used to monitor benzenes and toluene concentrations during the trafc restrictions. Trafc restrictions reduced the levels of benzene, toluene by 11.4%and 12.8%,respectively.While trafc fows were reduced about 11.8%.The correlation coeffcient was 0.8 between benzene and toluene during the feld campaign.And the ratio was around 0.43−0.50 be-tween benzene and toluene.Vehicle emissions were recognized as the major sources for atmospheric benzene and toluene based on the analysis of the characteristic ratio of benzene to toluene.The vehicle emissions were recognized as the major sources for atmospheric benzene and toluene in Beijing.
V.ACKNOWLEDGMENTS
This work was supported by the National Natural Science Foundation of China(No.41275027 and No.41275017),and the Research Foundation of Education Bureau of Anhui Province,China (No.KJ2012ZD006).The authors would like to thank the diferential optical absorption spectroscopy group for the help.
[1]G.Guerra,A.Iemma,D.Lerda,G.Salvi,and M.Tamponi,Atmos.Environ.29,3559(1995).
[2]R.Volkamer,T.Etzkorn,A.Geyer,and U.Platt,Atmos.Environ.32,3731(1998).
[3]P.H.Xie,W.Q.Liu,Q.Fu,R.B.Wang,J.G.Liu, and Q.N Wei,Adv.Atmos.Sci.21,211(2004).
[4]R.Atkinson,Atmos.Environ.34,2063(2000).
[5]J.Sun,Y.S.Wang,and F.K.Wu,Environ.Sci.32, 3531(2011).
[6]X.Du,L.X.Fu,and Y.M.Qiu,Chin.Environ.Sci.29,26(2009).
[7]S.W.Li,W.Q.Liu,P.H.Xie,M.Qin,and Y.J.Yang, Terr.Atmos.Ocean.Sci.23,39(2012).
[8]L.Loefgren,Intern.J.Environ.Anal.Chem.47,69 (1992).
[9]S.W.Li,P.H.Xie,E.H.Jiang,Y.Zhang,and H.F. Dai,Chin.J.Chem.Phys.25,739(2012).
[10]K.Kourtidis,I.Ziomas,C.Zerefos,A.Gousopoulos, D.Balis,and P.Tzoumaka,Atmos.Environ.34,1471 (2000).
[11]T.W.Kirchstetter,B.C.Singer,A.R.Harley,G.R. Kendall,and W.Chan,Environ.Sci.Technol.30,661 (1996).
[12]R.Kurtenbach,R.Ackermann,K.H.Becker,A.Geyer, J.A.G.Gomes,J.C.L¨orzer,U.Platt,and P.Wiesen, J.Atmos.Chem.42,395(2002).
10.1063/1674-0068/28/cjcp1409158
∗Author to whom correspondence should be addressed.E-mail:swli@chnu.edu.cn,Tel.:+86-561-3805209
(Dated:Received on September 19,2014;Accepted on December 22,2014)
杂志排行
CHINESE JOURNAL OF CHEMICAL PHYSICS的其它文章
- High Performance of Enhanced Mode Field Efect Transistor and Ultraviolet Sensor Based on ZnO Nanosheet
- Quantitative Moisture Measurement with a Cavity Ring-down Spectrometer using Telecom Diode Lasers
- Accurate Measurement of Raman Depolarization Ratio in Gaseous CO2
- Methanol Adsorption on TiO2Film Studied by Sum Frequency Generation Vibrational Spectroscopy
- Ultraviolet Source Assisted Enhancement of Attosecond Pulse
- Decay Dynamics ofN,N-Dimethylthioacetamide in S3(ππ∗)State
