Decay Dynamics ofN,N-Dimethylthioacetamide in S3(ππ∗)State
2015-01-13XioChenJidnXueXumingZhengbc
Xio ChenJi-dn XueXu-ming Zhengbc
a.Department of Chemistry,Zhejiang Sci-Tech University,Hangzhou 310018,China
b.Key Laboratory of Advanced Textiles Materials and Manufacture Technology of the Ministry of Education,Zhejiang Sci-Tech University,Hangzhou 310018,China
c.Engineering Research Center for Eco-dyeing and Finishing of Textiles of the Ministry of Education, Zhejiang Sci-Tech University,Hangzhou 310018,China
Decay Dynamics ofN,N-Dimethylthioacetamide in S3(ππ∗)State
Xiao Chena,Jia-dan Xuea,Xu-ming Zhenga,b,c∗
a.Department of Chemistry,Zhejiang Sci-Tech University,Hangzhou 310018,China
b.Key Laboratory of Advanced Textiles Materials and Manufacture Technology of the Ministry of Education,Zhejiang Sci-Tech University,Hangzhou 310018,China
c.Engineering Research Center for Eco-dyeing and Finishing of Textiles of the Ministry of Education, Zhejiang Sci-Tech University,Hangzhou 310018,China
The decay dynamics ofN,N-dimethylthioacetamide after excitation to the S3(ππ∗)state was studied by using the resonance Raman spectroscopy and complete active space selfconsistent feld method calculations.The UV-absorption and vibrational spectra were assigned.The A-band resonance Raman spectra were obtained in acetonitrile,methanol and water with the laser excitation wavelengths in resonance with the frst intense absorption band to probe the Franck-Condon region structural dynamics.The CASSCF calculations were carried out to determine the excitation energies and optimized structures of the lowerlying singlet states and conical intersection point.The A-band structural dynamics and the corresponding decay mechanism were obtained by the analysis of the resonance Raman intensity pattern and the CASSCF calculated structural parameters.The major decay channel of S3,FC(ππ∗)→S3(ππ∗)/S1(nπ∗)→S1(nπ∗)is proposed.
N,N-Dimethylthioacetamide,Structural dynamics,Decay dynamics,Resonance Raman spectrum,CASSCF calculation,Conical intersection
I.INTRODUCTION
Thioacetamide is a derivative of acetamide,in which the carbonyl oxygen atom is replaced by sulfur.The photophysics and photochemistry of thiocarbonyls were reviewed by Maciejewski and Steer[1].Previous studies have shown that the thione forms of small thioamides are much more stable than the thiol tautomers in the ground electronic state[2−4].The calculated energy diference between the thione and thiol forms of thioacetamide is 39.1 kJ/mol,which precludes thermal population of the thiol form of thioacetamide in the ground electronic state due to large transition energy barrier [5].UV-induced intramolecular proton-transfer reactions leading to conversion of a thione form to the corresponding thiol form were observed for a number of matrix-isolated thioamides[6−10].In some heterocyclic compounds,UV excitation induces proton transfer to exocyclic sulfur atom from a nitrogen atom placed in a ring in anαposition with respect to the C=S group. It should be pointed out that this type of unimolecular proton-transfer reactions is fundamentally diferent from the classic UV-induced proton-transfer reactions known as excited state intramolecular proton-transfer (ESIPT)processes[11].The ESIPT-type proton transfer requires an intramolecular hydrogen bond,along which proton is moved in the excited state.This is neither fulflled for the heterocyclic compounds studied nor for thioacetamide.
Resonance Raman spectroscopy has proven to be a powerful tool in the understanding of various processes such as vibronic-coupling[12−14],excited state protontransfer(ESPT)or hydrogen atom detachment and attachment reactions[15−18],and photodissociation[19, 20].
In the present work,a resonance Raman spectroscopy and CASSCF calculation of the excited state decay dynamics ofN,N-dimethylthioacetamide(DMTAA)were carried out to examine how the methyl substitution changes the short-time structural dynamics and the subsequent decay mechanism of thioacetamide and its derivatives.
II.EXPERIMENTAL AND COMPUTATIONAL METHODS
Thioacetamide was purchased from J&K Scientifc Ltd.Concentrations of approximately 2.0−5.0 mmol/L acetamide were prepared using HPLC grade solvents of acetonitrile(99.9%,Tedia,USA),methanol(99.9%, Spectrum,USA)and de-ionized water.The Fourier transform(FT)-Raman and FT-IR spectra were obtained using FT-Raman(Thermo Nicolet 960,Thermo Fisher Nicolet,USA)and FT-IR(Thermo Nicolet
The resonance Raman experimental method and apparatus have been described previously[19],only a short description is given here.The harmonics of a nanosecond Nd∶YAG laser and their hydrogen Raman shifted laser lines were employed to generate the 309.1, 282.4,266.0,252.7,245.9,and 239.5 nm excitation wavelengths which were utilized in the resonance Raman experiments.The excitation laser beam used a~100µJ pulse energy loosely focused to a 0.5−1.0 mm diameter spot size onto a fowing liquid stream of sample.A backscattering geometry was employed for collection of the Raman scattered light by refective optics that imaged the light through a polarizer and entrance slit of a 0.5 m spectrograph and the grating of the spectrograph dispersed the light onto a liquid nitrogen cooled CCD mounted on the exit of the spectrograph.The Raman shifts of the resonance Raman spectra were calibrated with the known vibrational frequencies of solvent Raman bands(cyclohexane,acetonitrile and methanol).To fully subtract the solvent Raman bands from the resonance Raman spectra of the sample solutions,the pure solvent Raman spectrum at certain excitation wavelength is scaled by a proper factor so that the intensities of the scaled solvent Raman bands match those of the corresponding bands in the sample resonance Raman spectrum at the same excitation wavelength.Sections of the resonance Raman spectra were ft to a baseline plus a sum of Lorentzian bands to determine the integrated areas of the Raman bands of interest.The resonance Raman spectra have been intensity-corrected[20]for the wavelength dependence of the sample’s absorbance in backscattering geometry [21]and for the spectrograph throughput and detector quantum efciency[22].The spectral resolution is about 6 cm−1for the 217.8 nm resonance Raman spectrum,and 3 cm−1for the 299.1 nm one.
The geometry structure optimization and vibrational frequency computation were done using the B3LYP/6-311++G(d,p)level of theory.The S0→Snvertical transition energies were estimated at B3LYPTD/6-311++G(d,p)levels of theory employing a self-consistent reaction feld(SCRF),polarized continuum overlapping spheres model(PCM).The complete active space self-consistent feld(CASSCF)theory was used to study the excited state decay mechanism of PITC.The conical intersection and intersystem crossing points between two electronic excited states were computed at CASSCF(6,5)/6-31G(d)level of theory.Seven active orbitals were used for the CASSCF calculations.An active space with 6 electrons in 5 orbitals is referred to as CASSCF(6,5)hereafter.All of the quantum mechanical calculations were done using the Gaussian 03 program[23].

FIG.1 The schematic diagram of the geometry structure of DMTAA.

FIG.2 UV spectra of DMTAA in acetonitrile,methanol, and water with the excitation wavelengths used for the resonance Raman experiment indicated above the curves.
III.RESULTS AND DISCUSSION
A.UV spectra
Figure 1 shows the schematic diagram of the geometry structure and Fig.2 shows the UV spectra of DMTAA in acetonitrile,methanol and water with the excitation wavelengths used for the resonance Raman experiment indicated above the curves.In acetronitrile,the experimental UV spectrum displays two bands in>200 nm spectral region withλmaxbeing at 270 nm(f=0.2779)and 217 nm (f=0.1407)respectively,and they are termed as A-band and B-band.The molecular coefcient,ε, measured for the A-band absorption in acetonitrile, methanol,and water are 1.27×10⁴(L/mol)·cm−1(λmax=270 nm),1.25×104(L/mol)·cm−1(λmax= 268 nm),and 1.23×10⁴(L/mol)·cm−1(λmax=263 nm), respectively.The blue-shifts of the A-band absorption are noticeably observed as solvent goes from nonpolar to polar.


TABLE I TD-B3LYP/6-311++G(d,p)computed electronic transition energiesE,and oscillator strengthsfof DMTAA. The experimental data are taken in acetonitrile.

FIG.3 TD-B3LYP/6-311++G(d,p)computed molecular orbitals associated with the electronic transitions of DMTAA.

FIG.4(a)Experimental FT-IR spectrum in neat liquid of water in comparison with(b)the calculated non-resonance Raman spectrum.The calculated frequencies are scaled linearly to those observed in the FT-IR spectrum.
B.Vibrational assignment
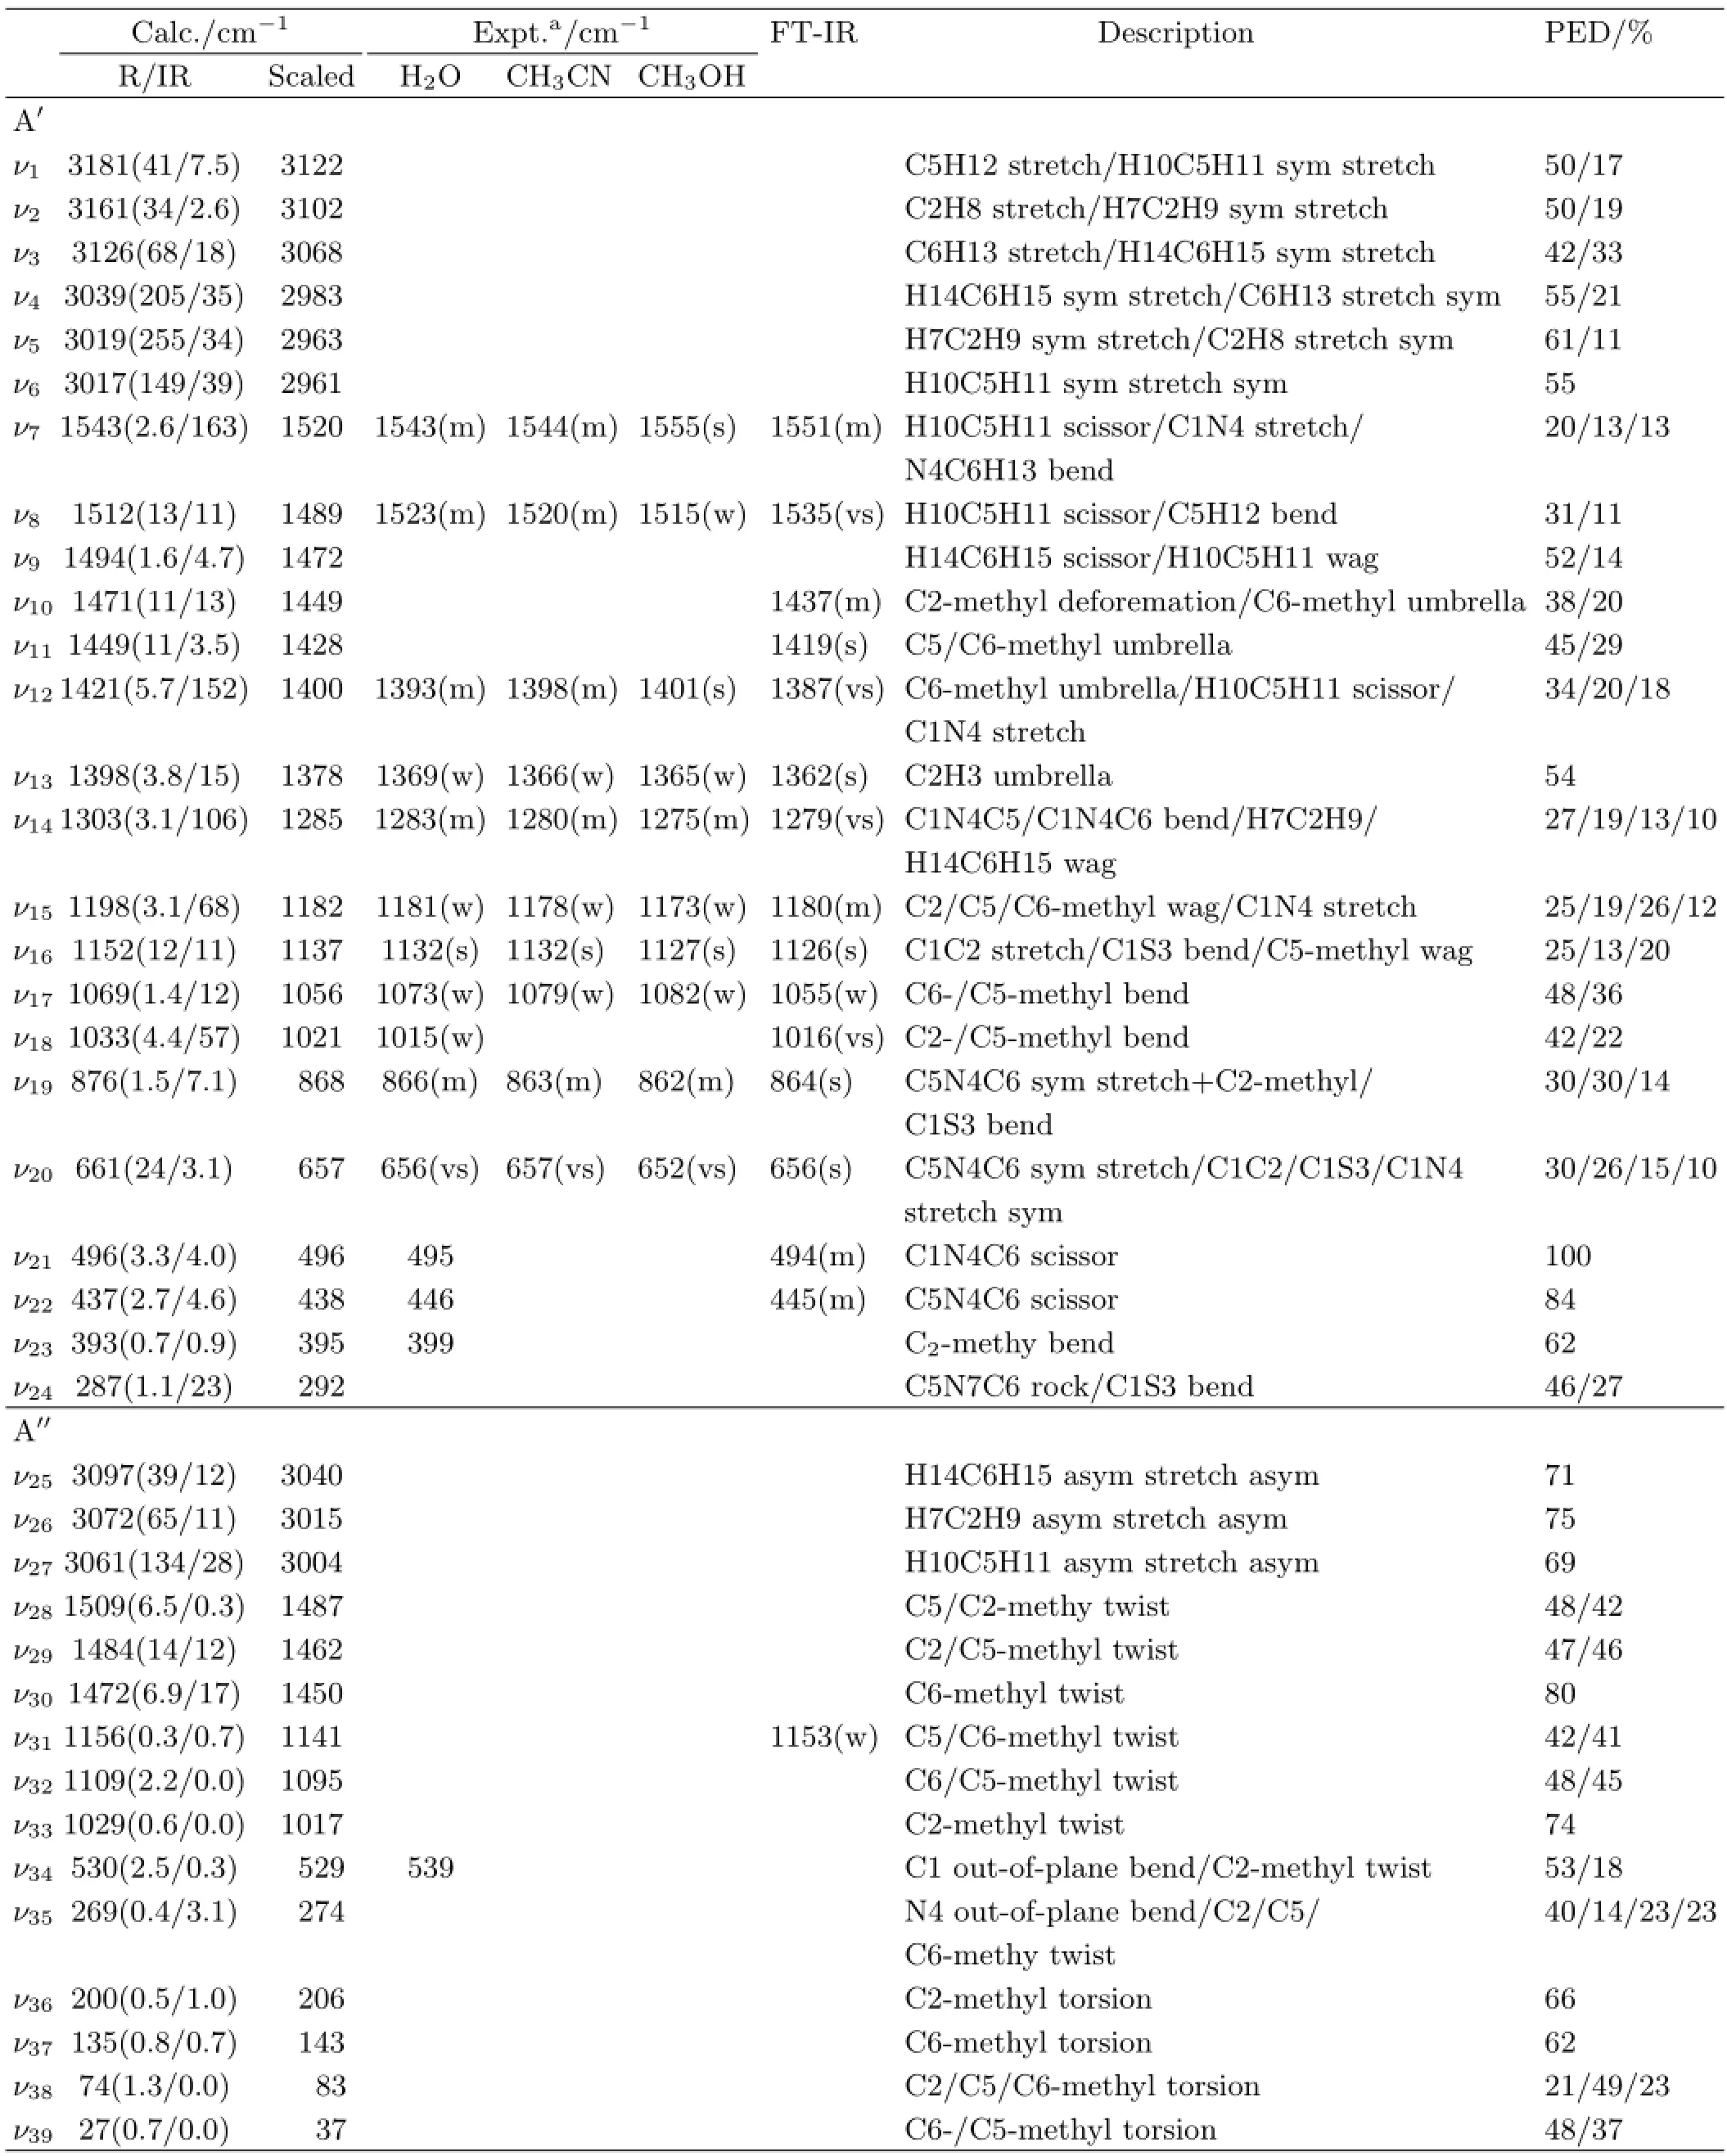
There has been no reports for the vibrational assignment of DMTAA.To make the vibrational assignments, the FT-IR spectrum and the A-band resonance Raman spectra in diferent solvents are measured and the density functional theory calculation is carried out.Due to the burning of the sample,the measurements of the FTRaman spectra in neat solid,in diferent solvents and at lower temperature are unsuccessful.Figure 4 shows the FT-IR spectrum in neat liquid in comparison with the calculated Raman spectra.Table II presents the B3LYP/6-311++G(d,p)calculated non-resonance Raman and the experimentally(FT-IR and A-band resonance Raman)observed vibrational frequencies and normal mode descriptions of DMTAA.The tentative correlation between the experimental frequencies and the calculated ones are done as follows.
In 0−299 cm−1spectral region,no experimental
bands are observed so that no correlation between the experimental and the calculated ones can be made.In 300−1300 cm−1spectral region,the twelve observed bands at 399,446,495,539,661,876,1015,1073,1132, 1181,and 1283 cm−1in the 309.1 nm resonance Raman spectra and/or at-,445,494,-,656,864,1016, 1055,1126,1153,1180,-,and 1279 cm−1in the FTIR spectrum correlate well with the(spectroscopically scaled)calculated bands at 395,438,496,529,657,868, 1021/1017,1056,1137,1141,1182,1285 cm−1and they are respectively assigned toν23,ν22,ν21,ν34,ν20,ν19,ν18,ν17,ν16,ν31,ν15,andν14.

TABLE II B3LYP/6-311++G(d,p)calculated and FT-IR observed vibrational frequencies and normal mode descriptions of DMTAA.Experiment data are from resonance Raman at 266.0 nm.
In 1300−1500 cm−1spectral region,the experimental spectrum displays two bands at 1369 and 1393 cm−1in the 309.1 nm resonance Raman spectrum and four bands at 1362,1387,1419,1437 cm−1in the FT-IR spectrum,and they correlate well with the(spectroscopically scaled)calculated bands at 1378,1400,1428,and 1449 cm−1,and are assigned asν13,ν12,ν11,ν10.The (spectroscopically scaled)calculated band at 1472 cm−1(or the band at 1494 cm−1without scaling)is not observed.In 1500−1600 cm−1region,two observed bands at 1523,1543 cm−1in the 309.1 nm resonance Raman spectrum and at 1535,1551 cm−1in FT-IR spectrum correlate with the calculated bands at 1512,1543 cm−1, and they are assigned asν8,ν7.
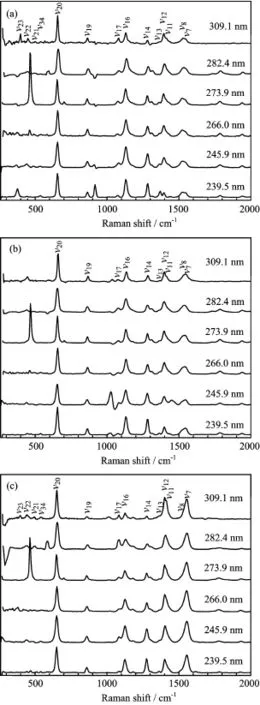
Figure 5 shows the A-band resonance Raman spectra of DMTAA in three solvents.According to Fig.2 and Table I,the 309.1 nm resonance Raman spectrum is mostly the pre-resonance Raman spectrum of the A-band absorption so that it provides important information on the fundamental vibrational modes that are active in the A-band resonance Raman spectra in 0−1600 cm−1spectral region.This spectrum may also provide the information on the vibronic-coupling or state-mixing among S3,S2,and S1.Similarly,the 239.5 nm resonance Raman spectrum may also give the information on the vibronic-coupling or state-mixing among S3and the higher-lying states.
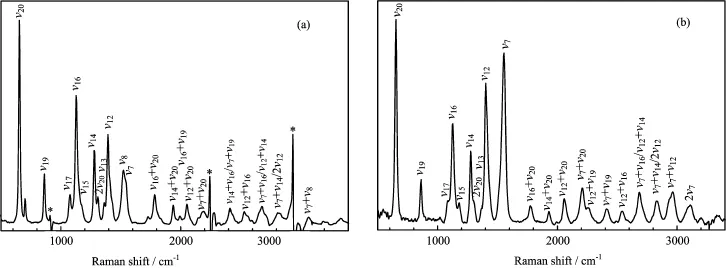
Figure 6 shows the expanded view of the 273.9 and 266.0 nm resonance Raman spectra in acetonitrile and water respectively.Most of the A-band resonance Raman intensities of DMTAA in acetonitrile and water can be assigned to the fundamentals,overtones and combination bands of about ten Franck-Condon modes∶ν7,
ν8,ν12,ν13,ν14,ν15,ν16,ν17,ν19,ν20.


FIG.5 Overall view of the A-band resonance Raman spectra of DMTAA in(a)acetonitrile,(b)methanol,(c)water.
The intensity of theν16mode relative to that of theν20mode decreases as the laser line goes from 239.5 nm to 273.9 nm.The intense intensity of theν16mode in the 239.5 nm resonance Raman spectrum in acetonitrile can be explained by the major nH→Ryd3transition of the B-band absorption that makes the electronic density around H10,H11,and S atoms change greatly so that signifcant motions of the C1S3 bend+C5-methyl wag are expected to occur in the Franck-Condon region of the S5state.However the moderate intensity of theν16mode in the 273.9 nm resonance Raman spectrum is hardly explained by the electronic transitions of the A-band absorption.This suggests that the appearance of the moderate intensity of theν16mode in the 273.9 nm resonance Raman spectrum is likely due to a signifcant vibronic-coupling between the S3and S5states.The signifcant intensity of the combination bandν20+ν16in diferent laser excitations further suggests that the S3-S5vibronic-coupling exists in the wide range of energy.The preresonance enhancement of the weak B-band absorption is not considered as a major source of the signifcant intensity of theν16mode in the A-band resonance Raman spectra since it usually enhances the fundamental modes but not the overtones and combination bands.For similar reason,the variation in the intensity of theν14mode relative to that of theν20mode also suggests that there exists the S3-S5vibronic-coupling.

FIG.6 Expanded view of(a)the 273.9 nm in acetonitrile and(b)the 266.0 nm one in water for the resonance Raman spectra of DMTAA.The peaks labeled with star.

TABLE III Experimentally measured absolute Raman cross sectionσR(10-8˚A2/molecule),and the relative normal mode displacement∆i/∆(ν20)and relative vibrational reorganizational energyλi/λ(ν20)for the Franck-Condon active modes in water and acetonitrile.
Figure 6 shows that the intensity pattern of the A-band resonance Raman spectra of DMTAA in acetonitrile difers signifcantly from that in water.The most important diference lies in the intensity variation ofν7andν12relative to that ofν20.According to Fig.6 and Table III,the vibrational reorganizational energies partitioned in theν7andν12modes in water are about 3.9 and 1.8 times those in acetonitrile respectively.The increased intensity ofν7andν12in water suggests that more available energy is partitioned into the degree of freedom of the H10C5H11 scissor/C1N4 stretch/N4C6H13 bend/C6-methyl umbrella vibrations,while the decreased intensity ofν16in water suggests that less available energy is distributed among the degree of freedom of the C1C2 stretch/C1S3 bend/C5-methyl wag vibrations when compared to that in acetonitrile.The intensity of overtone 2ν7is about 3 times stronger than that of 2ν20and that ofν7+ν12is much intenser than that ofν20+ν12,etc.indicating that the structural dynamics along the H10C5H11 scissor+C1N4 stretch+N4C6H13 bend reaction coordinates in S3state undergo larger normal mode displacements in water than in acetonitrile.
The weak C1 out-of-plane bend+C2-methyl twist modeν34in the A′′irreducible representation is observed in the 309.1 nm resonance Raman spectrum of DMTAA in water.This indicates that the Herzberg-Teller vibronic-coupling mechanism[24,25]and/or the Franck-Condon region CI mechanism[12−14]work for the spectrum.Figure 7 displays the CASSCF computed geometric structures of S1,minand S2,minas well as S3/S1conical intersection point.The excitation energy for S2,minis 140 kcal/mol,which is too high for 309.1 nm wavelength to reach,and this result,together with the Cssymmetry nature of the S2,minstructure,suggests that the activation ofν34is not due to the structural dynamics towards S2,minstructure. The 309.1 nm excitation is energetically between those of S1,minand CI(S3/S1),and this suggests that it is possible that 309.1 nm probes the structural dynamics initiated from CI(S3/S1)to S1,min,just as the revelation[13],previously found for the structural dynamics of 4-cyanobenzaldehyde in the light absorbing S2(ππ∗)state,that the resonance Raman intensity pattern in the preresonance region signs mainly the structural dynamics along the portion of potential energy surface initiating from CI[S1(nπ∗)/S2(ππ∗)] point to somewhere of the S1(nπ∗)state.The appearance of the C1 out-of-plane bend+C2-methyl twistν34mode of DMTAA correlates well with the prominent diferences in the orientation of C2-methyl group and the dihedral(DS1,min(C2−C1−N4−C6)=−150.5◦,DS2/S1(C2−C1−N4−C6)=179.6◦)between the structures of S1,minand CI(S3/S1),and this indicates that the S1,minspecies forms via a ultrafast CI(S3/S1)channel upon the molecule is populated to the S3(ππ∗) state.The major decay channel is proposed to be from S3,FC(ππ∗)→S3(ππ∗)/S31(nπ∗)→S1(nπ∗).

FIG.7 Schematic diagram of the geometry structures of the lower-lying singlet and triplet excited states,the conical intersection and intersystem crossing points computed at the CASSCF(6,5)/6-31G(d)level of theory.The excitation energy are also give in kcal/mol.
Further work is thus required to deeply understand the short-time structural dynamics of DMTAA in different solvents.The present work indicates the normal mode displacements in S3state are solvent-dependent, but the detail mechanism is presently unclear,and we try to quantitatively determine the normal mode displacements by using the time-dependent wave-packet theory and the subsequent conversion to the internal coordinate displacement at diferent time in femtosecond timescale[20,26,27].This would allow us to get the exact bond length and bond angle changes within a few tens fs.Hydrogen bonding interaction may be a good point of penetration to gain insight into the mechanism buried behind the A-band resonance Raman spectra.We also try the CASSCF and time-dependent density functional theory calculations to explore the excited state hydrogen bonding interactions at diferent active sites.This,together with the results of the timedependent wave-packet theory modeling,will provide us a clearer picture about the nature of the short-time structural dynamics of DMTAA in diferent solvents.
IV.CONCLUSION

V.ACKNOWLEDGMENTS
This work was supported by the National Natural Science Foundation of China(No.21033002 and No.21202032)and the National Basic Research Program of China(No.2013CB834604).
[1]A.Maciejewski and R.P.Steer,Chem.Rev.93,67 (1993).
[2]H.Rostkowska,L.Lapinski,A.Khvorostov,and M.J. Nowak,J.Chem.Phys.A107,6373(2003).
[3]L.Lapinski,H.Rostkowska,A.Khvorostov,and M.J. Nowak,Phys.Chem.Chem.Phys.5,1524(2003).
[4]R.Knudsen and Y.Hase,J.Mol.Struc.321,197 (1994).
[5]S.Dapprich and G.Frenking,Chem.Phys.Lett.205, 337(1993).
[6]M.J.Nowak,L.Lapinski,H.Rostkowska,A.Les,and L.Adamowicz,J.Phys.Chem.94,7406(1990).
[7]M.J.Nowak,L.Lapinski,H.Rostkowska,A.Les,and L.Adamowicz,J.Phys.Chem.95,2404(1991).
[8]D.Prusinowska,L.Lapinski,M.J.Nowak,and L. Adamowicz,Spectrochim.Acta51A,1809(1995).
[9]H.Rostkowska,L.Lapinski,and M.J.Nowak,J.Phys. Chem.A107,804(2003).
[10]H.Rostkowska,L.Lapinski,I.Reva,B.J.Almeida,M. J.Nowak,and R.Fausto,J.Phys.Chem.A115,12142 (2011).
[11]G.J.Zhao and K.L.Han,Acc.Chem.Res.45,404 (2012).
[12]X.F.Wu,X.M.Zheng,H.G.Wang,Y.Y.Zhao,X.G. Guan,and D.L.Phillips,J.Chem.Phys.133,134507 (2010).
[13]Y.Yang,S.Pan,J.D.Xue,X.M.Zheng,W.H.Fang, and D.L.Phillips,J.Raman Spectrosc.45,105(2014).
[14]J.L.Guo,C.Liu,B.B.Xie,Y.Y.Zhao,K.M.Pei,H. G.Wang,and X.M.Zheng,J.Raman Spectrosc.43, 1477(2012).
[15]J.W.Jian,H.B.Zhang,C.Q.Chen,Y.Y.Zhao,and X.M.Zheng,J.Raman Spectrosc.44,582(2013).
[16]X.L.Jiang,K.M.Pei,H.G.Wang,X.M.Zheng,W. H.Fang,and D.L.Phillips,J.Phys.Chem.A111, 13182(2007).
[17]Y.Q.Wang,H.G.Wang,S.Q.Zhang,K.M.Pei,X.M. Zheng,and D.L.Phillips,J.Chem.Phys.125,214506 (2006).
[18]R.Du,C.Liu,Y.Y.Zhao,K.M.Pei,H.G.Wang,X. M.Zheng,M.D.Li,J.D.Xue,and D.L.Phillips,J. Phys.Chem.B115,8266(2011).
[19]X.M.Zheng,Y.L.Li,and D.L.Phillips,J.Phys. Chem.A108,8032(2004).
[20]A.B.Myers and T.R.Rizzo,Laser Techniques in Chemistry,New York:Wiley,325(1995).
[21]A.B.Myers,B.Li,and X.Ci,J.Chem.Phys.89,1876 (1988).
[22]R.Ouillon and S.Adam,J.Raman Spectrosc.12,281 (1982).
[23]M.J.Frisch,G.W.Trucks,H.B.Schlegel,G.E.Scuseria,M.A.Robb,J.R.Cheeseman,J.A.Jr.Montgomery,T.Vreven,K.N.Kudin,J.C.Burant,J.M. Millam,S.S.Iyengar,J.Tomasi,V.Barone,B.Mennucci,M.Cossi,G.Scalmani,N.Rega,G.A.Petersson,H.Nakatsuji,M.Hada,M.Ehara,K.Toyota, R.Fukuda,J.Hasegawa,M.Ishida,T.Nakajima,Y. Honda,O.Kitao,H.Nakai,M.Klene,X.Li,J.E.Knox, H.P.Hratchian,J.B.Cross,C.Adamo,J.Jaramillo,R. Gomperts,R.E.Stratmann,O.Yazyev,A.J.Austin, R.Cammi,C.Pomelli,J.W.Ochterski,P.Y.Ayala, K.Morokuma,G.A.Voth,P.Salvador,J.J.Dannenberg,V.G.Zakrzewski,S.Dapprich,A.D.Daniels,M. C.Strain,¨O.Farkas,D.K.Malick,A.D.Rabuck,K. Raghavachari,J.B.Foresman,J.V.Ortiz,Q.Cui,A. G.Baboul,S.Cliford,J.Cioslowski,B.B.Stefanov,G. Lui,A.Liashenko,P.Piskorz,I.Komaromi,R.L.Martin,D.J.Fox,T.Keith,M.A.Al-Laham,C.Y.Peng, A.Nanayakkara,M.Challacombe,P.M.W.Gill,B. Johnson,W.Chen,M.W.Wong,C.Gonzalez,and J. A.Pople.Gaussian 03,Revision B.02,Pittsburgh,PA:Gaussian Inc,(2003).
[24]H.G.Wang,J.Xu,J.M.Wan,Y.Y.Zhao,and X.M. Zheng,J.Phys.Chem.B114,3623(2010).
[25]D.J.Swanton,G.B.Bacskay,and N.S.Hush,Chem. Phys.83,69(1984).
[26]D.M.Chen,T.He,D.F.Cong,Y.H.Zhang,and F. C.Liu,J.Phys.Chem.A105,3981(2001).
[27]X.Zheng and D.L.Phillips,J.Chem.Phys.108,5772 (1998).
10.1063/1674-0068/28/cjcp1409152avatar 370,Thermo Fisher Nicolet,USA)spectrometers with 2 cm−1resolution.The UV absorption spectrum was measured using UV/visible spectrometer (UV-2501PC,Shimadzu,Japan).
∗Author to whom correspondence should be addressed.E-mail:zxm@zstu.edu.cn,Tel.:+86-571-86843699
(Dated:Received on September 11,2014;Accepted on October 30,2014)
杂志排行
CHINESE JOURNAL OF CHEMICAL PHYSICS的其它文章
- High Performance of Enhanced Mode Field Efect Transistor and Ultraviolet Sensor Based on ZnO Nanosheet
- Quantitative Moisture Measurement with a Cavity Ring-down Spectrometer using Telecom Diode Lasers
- Accurate Measurement of Raman Depolarization Ratio in Gaseous CO2
- Methanol Adsorption on TiO2Film Studied by Sum Frequency Generation Vibrational Spectroscopy
- Ultraviolet Source Assisted Enhancement of Attosecond Pulse
- Electron Momentum Spectroscopy of Outer Valence Orbitals of 2-Fluoroethanol
