MRI Evaluation of Lateral Geniculate Body in Normal Aging Brain Using Quantitative Susceptibility Mapping.△
2015-01-09
Department of Radiology, Chinese People's Liberation Army General Hospital, Beijing 100853, China
MRI Evaluation of Lateral Geniculate Body in Normal Aging Brain Using Quantitative Susceptibility Mapping.△
Meng-qi Liu, Zhi-ye Chen, Xiang-bing Bian, Meng-yu Liu, Shen-yuan Yu, and Lin Ma*
Department of Radiology, Chinese People's Liberation Army General Hospital, Beijing 100853, China
lateral geniculate body; quantitative susceptibility mapping; magnetic resonance imaging; aging
ObjectiveTo investigate the changes of lateral geniculate body (LGB) in the normal aging brain using quantitative susceptibility mapping (QSM) technique.
MethodsMagnetic resonance (MR) phase and magnitude images were acquired from enhanced gradient echo T2 star weighted angiography sequence with 16 echoes on 3.0T MR system using the head coil with 32 channels. Morphology Enabled Dipole Inversion (MEDI) method was applied for QSM, and the susceptibility value of LGB was measured by region of interest (ROI) drawn manually on three orthogonal planes.
ResultsLGB of the middle-aged group had a higher susceptibility value (0.16±0.05 ppm) than that of the youth group (0.12±0.05 ppm) and elderly group (0.13±0.03 ppm) (all p<0.05). Partial correlation analysis demonstrated that there was significantly positive correlation between susceptibility value and age in the youth group (r=0.71, p<0.05).
ConclusionLGB could clearly be identified on QSM in the brain in vivo.
Chin Med Sci J 2015; 30(1):34-36
I T has been documented, lateral geniculate body (LGB) as an important visual relay nucleus, plays the key roles in the visual processing as demonstrated by many studies that investigating the anatomical and functional properties of LGB between species and evaluating its involvement in human optic visual pathway disorders. The published articles showed that proton density weighted imaging (PDWI) could noninvasively map the volume of LGB in vivo.1,2We have introduced a semiautomatic LGB isolation method based on three dimensional gradient-echo sequence T1 weight image (3D GRE T1WI) to measure the LGB volume of the healthy subjects. Our results are in excellent agreement with the previously reported values of postmortem studies. In addition, we found LGB volume was decreased with age.3Quantitative brain iron concentration measurement is an efficient method for evaluation of the pathophysiologicalchanges of different brain tissues. Quantitative susceptibility mapping (QSM)4was a new technique to measure the brain iron deposition and decode magnetic resonance (MR) imaging data as a tissue magnetic biomarker. It has been used to study iron distribution, metabolic oxygen consumption, calcification, demyelination, and other pathophysiological susceptibility changes. It has been demonstrated that iron deposition was confirmed in LGB in postmortem brains with frontotemporal lobar degeneration by T2*-weighted gradient-echo 7.0 T MR imaging.5In this study, we obtained MR phase images and magnitude images from normal subjects, and susceptibility value of LGB was measured and compared among different age groups, to visualize change of LGB in the normal aging brain using QSM technique.
SUBJECTS AND METHODS
Subjects
A total of 67 healthy volunteers (37 males and 30 females) were recruited from hospital staffs and their relatives between January 2014 and April 2014. The subjects were classified into three groups according to age: the youth group (<45 years old, n=30, 28.47±8.63 years), middleaged group (45-59 years old, n=17, 51.24±4.34 years), and elderly group (>60 years old, n=20, 69.80±7.80 years). Subjects with visual pathway dysfunction, inflammatory disease of the central nervous system, and a history of use of psychoactive drugs or hormone were excluded.
This research was approved by the Ethics Committee of the Chinese People’s Liberation Army General Hospital. Written informed consent was obtained from all participants.
MR imaging
All the MR data were acquire on a 3.0T MR system (MR Discovery 750, GE Healthcare, WI, USA) with a 32-channel phased head coil. First, conventional MR imaging, including axial fast spin echo T2 weighted imaging and diffusion weighted imaging, were obtained for general assessment and for excluding cerebral infarction, inflammatory, and other diseases which might injure the visual function pathway. Then MR phase and magnitude images were acquired from enhanced gradient echo T2 star weighted angiography (ESWAN) sequence with 16 echoes (repetition time/echo time=32 ms/19 ms, slice thickness=2 mm, slice gap=0, field of view=240 mm, matrix size=448×384).
Data analysis
All the MR data were processed under MATLAB 7.6 (The Mathworks, Natick, MA, USA). The QSM was computed by using Morphology Enabled Dipole Inversion method.6The elliptical region of interest (ROI) of LGB was drawn on three orthogonal planes within an area of about 20-30 mm2by a trained neuroradiologist who was blind to the subjects′ age, and susceptibility value was measured (Fig. 1). ROIs were defined again 2 months later by the same neuroradiologist on the same images, and the mean susceptibility value was regarded as the final susceptibility value.
Statistical analysis
Statistical analysis was performed by using SPSS 15.0. Continuous variables were reported as means ± standard deviations. The susceptibility value among three groups was compared with analysis of variance, and Dunnett test was applied for multiple comparisons for the unequal variances. Partial correlation analysis was used to analyze the correlation between susceptibility value and age with gender as a covariate. A value of P less than 0.05 was considered as statistically significant.
RESULTS
The susceptibility value of LGB in the middle-aged group (0.16±0.05 ppm) was significantly higher than that of the youth group (0.12±0.05 ppm, P=0.01) and the elderly group (0.13±0.03 ppm, P<0.01). And there was no significant difference between the youth group and elderly group (P=0.90).
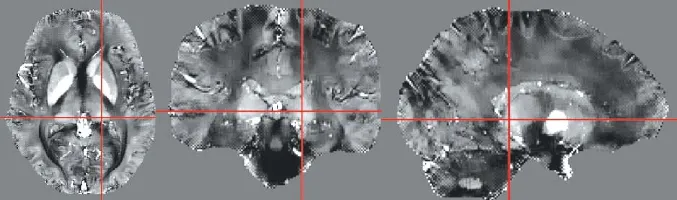
Figure 1.Elliptical region of interest was drawn on the cross point with an area of about 20-30 mm2.
Partial correlation analysis demonstrated that there was a significantly positive correlation between susceptibility value and age in the youth group (r=0.71, P<0.05); a positive trend in the middle-aged group (r=0.23, P>0.05) and a negative trend in the elderly group (r=-0.01, P>0.05). The positive correlation was revealed between susceptibility value of LGB and age in all subjects (r=0.268, P<0.05).
DISCUSSION
LGB, a pivotal visual relay of the thalamus, mainly dominates the perception of form and color and the perception of movement and depth.7In clinical practice, we could determine LGB impairment based on the characteristic sector or wedge-shaped pattern of homonymous visual defect, and distinguish it from optic tract lesions based on pupillary response.8,9Although LGB could be identified on PDWI and the volume of LGB could be measured on 3D T1WI,3it was difficult to acquire distinct signal from LGB using MR imaging in clinical practice because LGB is a small subcortical structure that is only 5-10 mm in diameter as well as lack of sufficient contrast between the lateral geniculate nucleus and the adjacent white matter tracts.
In the previous study, volume loss of LGB with aging was demonstrated on MR structural images,3however, this volume changes was too subtle to identify the changes on the MR structural images using visual observation methods. It has been confirmed that iron deposit in the human LGB occurs in the process of normal aging. Due to the susceptibility to iron of QSM, it is possible to use this method to clearly visualize and precisely quantify the volume of LGB. In this study, LGB was clearly indentified on QSM images with the best signal contrast for all subjects (Fig. 1).
The results of the preliminary study revealed iron deposition of the middle-aged subjects at the highest level, which suggest that iron deposition in LGB present a dynamical change with aging, and it can help to evaluate the pathophysiological changes of LGB. The exact mechanism should be elucidated in the further. The partial correlation showed the positive correlation between susceptibility value and age in the youth subjects. These indicated that iron deposition in LGB was increased with aging in the youth groups, and it would maintain a stable level in the middle-aged group and elderly group.
Considering the relative small sample size and cross-sectional study, longitudinal research with larger sample size and further functional analysis are required for fully clarifying susceptibility changes of LGB with aging. Moreover, it has proven challenging to precisely visualize and distinguish its subdivisions of four dorsal parvocellular layers and two ventral magnocellular layer.7Therefore, the future studies should be carried out to define these subdivisions of primate LGB with visual pathway disorders using QSM.
ACKNOWLEDGMENT
Authors are gratefully thankful to Dan-dan Zheng from General Electric Healthcare, China for the support and assistance in data processing.
REFERENCES
1. Horton JC, Landau K, Maeder P, et al. Magnetic resonance imaging of the human lateral geniculate body. Arch Neurol 1990; 47:1201-6.
2. Fujita N, Tanaka H, Takanashi M, et al. Lateral geniculate nucleus: Anatomic and functional identification by use of MR imaging. AJNR Am J Neuroradiol 2001; 22:1719-26.
3. Li M, He HG, Shi W, et al. Quantification of the human lateral geniculate nucleus in vivo using MR imaging based on morphometry: Volume loss with age. AJNR Am J Neuroradiol 2012; 33:915-21.
4. Wang Y, Liu T. Quantitative susceptibility mapping (QSM):Decoding MRI data for a tissue magnetic biomarker. Magn Reson Med 2015; 73:82-101.
5. De Reuck JL, Deramecourt V, Auger F, et al. Iron deposits in post-mortem brains of patients with neurodegenerative and cerebrovascular diseases: A semi-quantitative 7.0 T magnetic resonance imaging study. Eur J Neurol 2014; 21:1026-31.
6. Liu J, Liu T, de Rochefort L, et al. Morphology enabled dipole inversion for quantitative susceptibility mapping using structural consistency between the magnitude image and the susceptibility map. Neuroimage 2012; 59:2560-8.
7. Livingstone M, Hubel D. Segregation of form, color, movement, and depth: Anatomy, physiology, and perception. Science 1988; 240:740-9.
8. Shacklett DE, O′Connor PS, Dorwart RH, et al. Congruous and incongruous sectoral visual field defects with lesions of the lateral geniculate nucleus. Am J Ophthalmol 1984; 98:283-90.
9. Greenfield DS, Siatkowski RM, Schatz NJ, et al. Bilateral lateral geniculitis associated with severe diarrhea. Am J Ophthalmol 1996; 122:280-1.
for publication August 26, 2014.
△Supported by the National Natural Science Foundation of China (81171319) and Nursery Fund of PLA General Hospital (13KMM41).
E-mail: cjr.malin@vip.163.com
杂志排行

Chinese Medical Sciences Journal的其它文章
- Use of Cataract Surgery in Urban Beijing: a Post Screening Follow-up of the Elderly with Visual Impairment due to Age-related Cataract
- Lipopolysaccharide Challenge Induces Long Pentraxin 3 Expression in Mice Independently from Acute Lung Injury△
- Reliability of a Novel Cobb Protractor for Measuring the Cobb Angle of Radiograph in Scoliosis
- Role of Removing Stasis and Reducing Heat Formula in Clearance of Proximal Ureteral Calculi after Ureteroscopic Ho:YAG Laser Lithotripsy: A Prospective Randomized Study
- Redo Coronary Artery Bypass Grafting: On-Pump and Off-Pump Coronary Artery Bypass Grafting Revascularization Techniques
- Total Glycosides of Ranunculus Japonius Prevent Hypertrophy in Cardiomyocytes via Alleviating Chronic Ca2+Overload