Changes in behavior and in brain glucose metabolism in rats after nine weeks on a high fat diet: a randomized controlled trial
2014-12-09HuaHUYeqingXUChunfengLIUHeqingZHAOHongZHANGLiweiWANG
Hua HU, Yeqing XU, Chunfeng LIU, Heqing ZHAO, Hong ZHANG, Liwei WANG*
•Original article•
Changes in behavior and in brain glucose metabolism in rats after nine weeks on a high fat diet: a randomized controlled trial
Hua HU1,2, Yeqing XU2, Chunfeng LIU1, Heqing ZHAO1, Hong ZHANG3, Liwei WANG2*
high-fat diet, depression, animal model, glucose metabolism, micro-PET
1. Introduction
A high-fat diet (HFD) is a well-known risk factor for cardiovascular disease and is one of many factors responsible for chronic liver disorders, dementia and cognitive decline.[1-2]Whether HFD is directly associated with depression and depressive behavior remains unknown. In a large-scale analysis of over 1000 elderly subjects, Morgan and colleagues found that subjects with low serum total cholesterol were likely to be depressive.[3]Another study supported this notion and reported that cholesterol levels were 13%lower in depressed subjects compared with control subjects.[4]In addition, Richter and colleagues reported a positive correlation between triglyceride levels and the severity of depression, and suggested that resolution of depression may be associated with decreasing triglyceride levels.[5]Other studies have shown that depression among obese subjects is more severe than among non-obese subjects.[6]Visceral fat particularly increases the risk of onset of depressive symptoms,[7]and weight gain during depressive periods is an important indicator of depression severity.[6]
There are multiple possible pathogenic mechanisms that could link a HFD and depression or depressive behavior. A decrease in triglyceride levels is related to both an increase in arterial oxygen tension and an improvement in depressive symptoms.[8]Seplowitz and colleagues suggest that high serum viscosity reduces red blood cell oxygenation leading to segmental cerebral hypoxia that may be associated with depressive symptoms.[9]When brain synaptosomal membrane cholesterol decreases, there is a pronounced decrease in the number of serotonin receptors, a change that is associated with suicidal and depressive symptoms.[4]Alternatively, Molteni and colleagues found that HFD can influence brain structure and function via the upregulation of the neurotrophins that play a pivotal role in the pathophysiology of depression.
Current research is aimed at elucidating the changes in brain activity associated with depressive behavior. Micro-positron emission tomography (micro-PET) is a functional neuroimaging technique designed for the study of human disease in animal models. The‘gold standard’ marker of glucose metabolism, [F-18]fluorodeoxyglucose ([F-18] FDG), is used as a tracer in animal models of psychiatric disorders due to its relatively long half-life. Our previous study successfully demonstrated changes in brain glucose metabolism by [F-18] FDG micro-PET in a rat model of chronic mild stress.[10]To our knowledge, the changes in brain activity in rats exposed to an HFD have not been studied in detail. In this study, we investigated whether a rat exposed to a HFD exhibits depressive behavior, and whether HFD-induced changes in brain activity and glucose metabolism are associated with depressive behavior.
2. Methods
2.1 Animals and preparation of animal model
All procedures complied with Fudan University experimental standards and the NIH Guide for the Care and Use of Laboratory Animals. The flowchart for the study is shown in Figure 1. Twenty healthy male Sprague–Dawley rats weighing 180-200 g (about 2-3 months of age) were randomly divided into two groups of 10 rats each. Rats in the control group were fed a regular diet (choline bitartrate 0.25%, vitamin mixture 1.0%, mineral mixture 3.5%, corn oil 5.0%, cellulose 5.0%, casein 20.0%, and corn α-starch to make 100%)for 9 weeks. Rats in the experimental group were fed a HFD (custard powder 10%, lard 20%, cholesterol 2.5%,sodium cholate 0.2%, thiamazole 0.1%, sucrose 2% and regular diet 65.2%) for 9 weeks.[11]
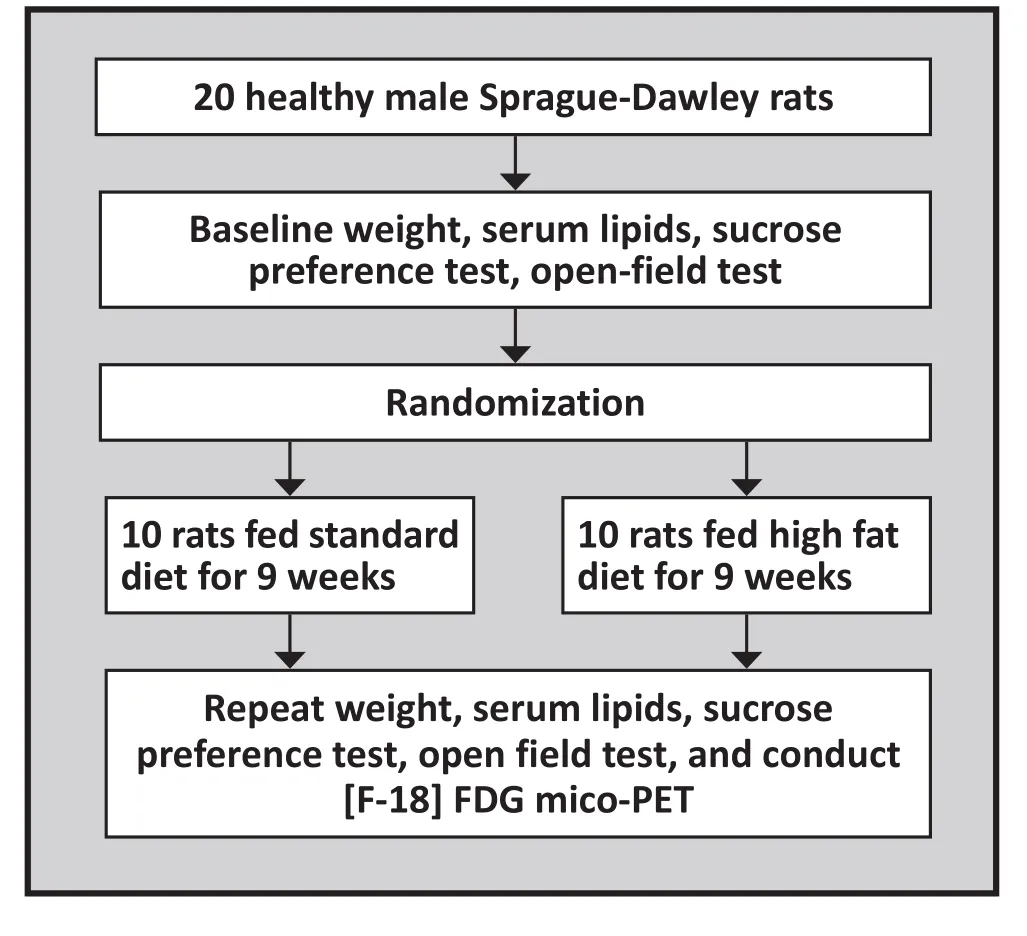
Figure 1. Flow chart of the study
2.2 Serum lipid measurement
Assay kits for assessing serum triglycerides, total cholesterol, and high- and low-density lipoprotein cholesterol were obtained from Biosino Bio-technology and Science Inc (Beijing, China). Rats in both groups had blood drawn (5 mL) via the caudal vein at baseline and at the end of the 9-week trial. Serum lipid measurements were determined by an enzymatic method according to the instructions in the assay kit.
2.3 Sucrose preference test
The sucrose preference test (SPT) has been employed to operationally define anhedonia, a hallmark of depression.[12]The animal is first exposed to 20 hours of food and water deprivation and then presented with two drinking bottles (one with water and one with 1% sucrose) for one hour. Consumption of both fluids is measured by assessing the change in weight of the bottles over the hour. Outcome measures are the weight-adjusted intake of water and of 1% sucrose (i.e.,mL/kg) and the percent sucrose preference (i.e., 100 x sucrose solution intake [mL]/total fluid intake [mL]).These tests were carried out at baseline and at the end of week 9.
2.4 Open-field test
In the open-field test (OFT), each rat was tested individually in an apparatus with a black square base(100×100 cm2) with black walls (40 cm high). The floor of the apparatus is divided into 25 equal squares and classified as the peripheral sector (the 16 squares around the wall) and the central sector (the 9 squares not touching a wall). The rat is placed in the center of the apparatus and allowed to move freely for 5 min while its behavior is recorded using a video camera. The behavioral parameters are: total activity, total number of squares crossed; peripheral activity, the number of squares crossed in the peripheral sector; rearing activity, the number of squares crossed with the body inclined vertically, forequarters raised with and without the forelimbs touching the wall of the apparatus; first minute activity, the total number of squares crossed during the first minute of testing; grooming, the number of times the animal groomed its face, licked/cleaned or scratched various parts of the body; defecation, the number of fecal boli excreted during the period, and duration of immobility. These tests were conducted at baseline and at the end of week 9.
2.5 [F-18] FDG micro PET scan
[F-18] FDG, with a specif i c activity of 500 Ci/mmol, was prepared in the Department of Nuclear Medicine at the Second Affiliated Hospital of Zhejiang University.Before the FDG injection, each rat was deprived of food for 10 hours. Then 0.5 mCi of pyrogen-free FDG was injected into the rat’s tail vein. After 40 min, the animal was placed in a spread-legged prone position under halothane gas anesthesia (5% induction and 1.5% for maintenance) and scanned with the micro-PET R4 (Concorde Microsystems, Knoxville, TN, USA)as previously described.[10]All data were reconstructed using a maximum-a-posterior probability algorithm with a pixel size of 0.4×0.4×1.2 mm³. Brain regions were extracted and normalized using rat brain templates.To obtain accurate anatomical information, we used statistical parametric mapping (SPM 5) software for PET template normalization and compared the results with the magnetic resonance imaging (MRI) template, which made it possible to identify the stereotaxic placement of the results.[13]We used the region of interest method to evaluate FDG uptake in brain regions with significant metabolic changes, including the thalamus and striatum.Because of cost considerations, this assessment was only conducted at the end of the 9-week trial.
2.6 Statistical methods
Results are expressed as the means and standard errors of means. The data obtained from the sucrose preference test, body weight and serum lipids were analyzed using t-tests (comparing the two groups at each time period), paired t-tests (comparing changes over time within each group) and repeated measures ANOVA (comparing the changes over time between the two groups). OFT was analyzed using the nonparametric Friedman ANOVA. Comparisons of the [F-18] FDG micro-PET results between the two groups at the end of week 9 were made using t-tests. Pearson’s correlation coefficients were calculated between the measures of behavior and those for glucose metabolism. All results with p<0.05 were considered to be statistically significant.
3. Results
Baseline mean (se) body weight was 193.6 (2.6) g for control group rats and 191.9 (1.6) g for HFD rats (t=1.94,p=0.217). There were no significant differences between the two groups in the baseline values of the 4 measures of serum lipids assessed (triglycerides, total cholesterol,high-density lipoprotein cholesterol, and low-density lipoprotein cholesterol). At the end of the 9-week trial,compared to rats on the standard diet, rats on the high fat diet were significantly heavier, had significantly higher serum total cholesterol, significantly higher lowdensity lipoprotein cholesterol, and significantly lower high-density lipoprotein cholesterol. (Table 1).
Results of the sucrose preference test are shown in Table 2. At baseline, weight-adjusted sucrose intake,weight-adjusted water intake and percent sucrose preference did not differ significantly between the two groups. At the end of the trial there were no significant changes in the three measures over time in the control group, but the HFD group had experienced a significant increase in weight-adjusted water intake and a corresponding decrease in the percent sucrose preference. We used repeated measures ANOVA analyses to compare the changes in the three measures over time between the two groups: there was no significant difference in the change in weight-adjusted sucrose intake between the two groups but there was a significantly greater increase over time in the weightadjusted water intake and a corresponding significantly greater decrease in the percent sucrose preference in the high fat diet group compared to the control group.

Table 1. Comparison of mean (se) body weight and serum lipids between 10 control group rats and 10 high-fat diet rats at end of the 9-week trial

Table 2. Comparison of mean (se) body weight-adjusted sucrose and water intake and sucrose preference of 10 control rats fed a standard diet and 10 rats fed a high-fat diet

Table 3. Mean (se) results of open field test (OFT) in 10 control rats and 10 high fat diet rats at baseline and after 9 weeks of feeding
Results for the seven measures derived from the OFT are shown in Table 3. There were no significant differences between baseline and the 9-week followup assessment in any of the measures in either of the groups. Comparison of the change in the measures during the 9-week trial between the two groups using repeated measures ANOVA found no significant differences between the groups.
Differences in the changes in the coronal and horizontal sections of HFD rats compared to control rats are shown in Figure 2. Table 4 shows the brain regions with significantly different changes in glucose metabolism between groups at the end of the 9-week trial, identified using Paxinos coordinates.[14]The high fat diet was associated with a substantial deactivation of the right thalamus and striatum. Figure 3 summarizes the changes in glucose metabolism in these two regions of interest. The magnitude of the deactivation of brain activity in the right thalamus and striatum induced by the HFD was positively correlated with the magnitude of the decrease in percent sugar preference (r=0.78,p<0.01 in the thalamus; r=0.81, p<0.01 in the striatum).However, this deactivation in brain activity in the right thalamus and striatum was not related to an increase in the weight-adjusted water intake (r=-0.38, p=0.276 in the thalamus; r=-0.16, p=0.651 in the striatum).
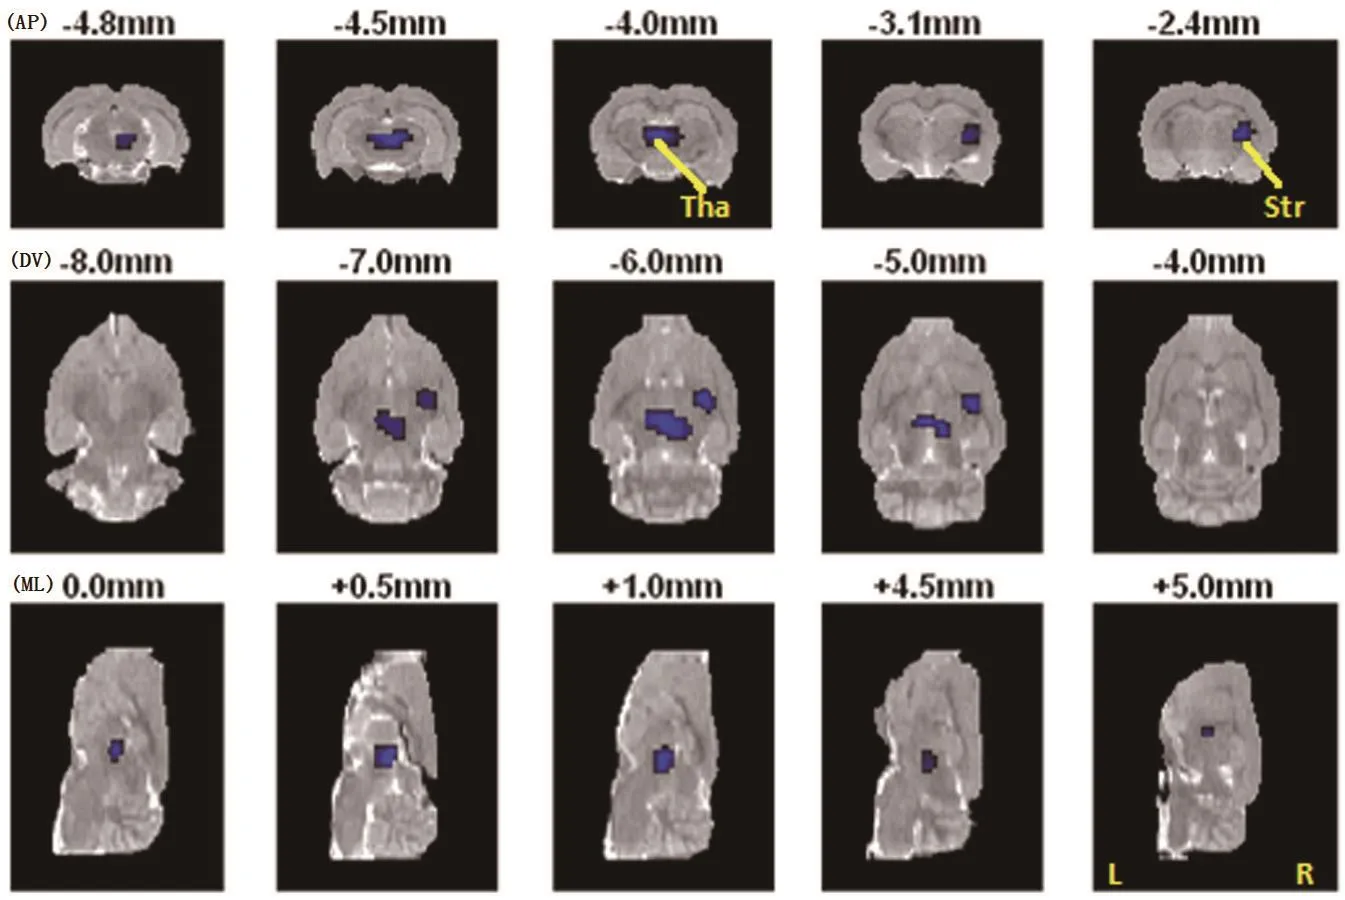
Figure 2. Brain areas with significant changes in glucose metabolism induced by high-fat diet

Table 4. Comparison of glucose metabolism changes over the 9-week trial between 10 rats fed a high fat diet and 10 rats fed a standard diet

Figure 3. Changes over the 9-week trial in glucose metabolism in brain areas in control (CON) and high-fat diet (HFD) groups.
4. Discussion
4.1 Main findings
This study presents novel evidence supporting prior reports about the effects of a HFD on brain activity. We used micro-PET to assess changes in cerebral glucose metabolism and found that both the right thalamus and the right striatum were significantly deactivated after feeding rats a HFD for nine weeks.
The HFD was also associated with significant increases in body weight, increased water intake,and decreased sucrose preference. The decreased sucrose preference – a change which is considered an indication of anhedonia[15]—suggests that the rewarding value of sucrose solution was disrupted. One possible explanation for this is that the sucrose in the HFD may lower the rat’s hedonic response to sweet stimuli;however, this explanation is not supported by a study by Amsterdam and colleagues[16]which reported that depressed patients gave similar pleasantness ratings to water and to a diluted sucrose solution as nondepressed controls. Moreover, another study by Willner and colleagues[12]showed that the consumption of salt water in depressed rats and non-depressed rats was similar. We conclude that the greasy, high calorie food used in our study did not directly affect sucrose preference; rather, rats given a HFD showed a loss of interest or decreased pleasure in sweet stimuli (i.e.,anhedonia).
We also found that HFD rats drank more water, a change that was not correlated with changes in brain glucose metabolism. Further study will be needed to clarify the interaction between diet and water intake.Human studies have found higher water intake is associated with reduced blood viscosity and very high water intake (five or more glasses daily) is associated with a lower risk of coronary heart disease.[17]Increased water intake may also be related to serum insulin levels:HFD causes insulin resistance which results in increased serum insulin levels and corresponding changes in appetite and body weight.[18]
The open field test is a common qualitative and quantitative measure of general locomotor activity and willingness to explore in rodents.[19]In our study, we did not find any significant differences in the observed indices between rats fed a HFD and those fed the standard diet. There was, however, a trend for decreased locomotor activity (number of crossings) in the HFD rats. Previous studies[20]suggest that decreased locomotor activity in rats is associated with high emotionality while increased grooming and defecation reflected an increased activation of the autonomic nervous system initiated by fear and anxiety.[20]An alternative explanation by Levin and colleagues[21]is that HFD-induced obese rodents have low sympathetic activity resulting in decreased energy expenditure.[21]Several potential confounding variables could explain these divergent results, including the behavior measure used, the species of animal, and the severity of depression.[10]Combining results from our sucrose preference and open field tests, our findings provide some support for the hypothesis that prolonged consumption of a HFD is associated with the onset of depressive symptoms.
Pearson’s correlation analysis revealed that sucrose preference was positively correlated with glucose metabolism in the right thalamus and striatum, which were significantly deactivated after consuming a HFD for nine weeks. The limbic system and other brain areas such as the basal ganglia are involved in emotional processing so if a HFD impairs the functioning of the limbic systemstriatum-thalamus circuit it would have a corresponding adverse effect on the processing of emotion.Furthermore, this circuit may be part of the neuronal network controlling human feeding behavior, so HFD-induced obesity may be associated with the differential activation (or a progressively worsening deficit) of some of these areas of the brain.[22-23]Even without the development of obesity, chronic consumption of a HFD is capable of attenuating dopamine turnover within the limbic system and decreasing operant response to sucrose.[24]Thus, there appears to be a natural relationship between a HFD and the regulation of emotion.
Several lines of research suggest a role of the thalamus and striatum in both eating behavior and in the regulation of emotion. In healthy men, neuronal activity in the thalamus decreases in response to a single meal.[25]In obese men, satiation produces a significant decrease in regional cerebral blood flow(rCBF) in the limbic areas, caudate and putamen.[23]Lesions or manipulation of the paraventricular nuclei of the thalamus affect adrenocorticotropin responses in rats exposed to chronic mild stress.[26]Independent component analysis of fMRI results of restingstate thalamus functional connectivity in depressed subjects[27]show increased connectivity of the default mode network. Young and colleagues showed an elevation in total neuron number in the thalamus of depressed subjects,[28]a finding that was not confirmed by Mayberg and colleagues.[29]Stice and colleagues[30]demonstrated that normal weight youth at a high risk for obesity showed greater activation of striatal regions on fMRI. Gautier and colleagues[23]showed that satiation in obese men produced significant increases in rCBR in the striatum. There are, however, some contradictory findings: decreased central dopamine in humans is associated with diet-induced obesity;[24]striatal D2receptors are down-regulated in obese animal models;[22]Mayberg and colleagues[29]observed decreased blood flow in the caudate nucleus of depressed patients; and structural neuroimaging methods demonstrated volume reductions in the putamen and the caudate nucleus in depressed patients.[31]Taken together, these findings suggest that both the thalamus and striatum are part of the neuronal network controlling feeding behavior and/or depressive emotions though the mechanism underlying these relationships remain unclear. Our findings support this growing consensus.
The micro-PET data clearly show that HFD-related differences in glucose metabolism were isolated to the right hemisphere. This left-right asymmetry in regional changes is an usual finding warranting further investigation. Previously, we found that changes of brain activity induced by chronic mild stress were lateralized in the left hemisphere.[10]The probable reason for the different regions identified in these two studies is the different designs: the present study was a controlled trial comparing the HFD to the standard diet while the previous study compared changes in a single sample of rats before and after exposure to mild chronic stress.One previous study[32]has reported hypometabolism of the right prefrontal cortex of obese patients, which is consistent with our results in rats who become obese after exposure to a HFD.
4.2 Limitations
Our failure to find significant differences in the open field test could be the result of several factors: (a) the sample size was not large enough to detect differences;(b) the test is not a good measure of depression-like symptoms in rats; or (c) there were no differences in the depressive symptoms between the two groups.Resolving this issue would require repeating the study with a larger sample and employing additional measures of emotionality and depression-like symptoms in rats,such as the Force Swimming Test.[33]
Changes in brain glucose metabolism (assessed using micro-positron emission tomography) were only examined at the end of the 9-week trial so it was not possible to compare changes in glucose metabolism over time. But the rats in the study were randomly selected from a homogenous pool of rats, so it is unlikely that the results of comparing changes in glucose metabolism over time would be different from the cross-sectional results at the end of the trial.
Finally, the micro-PET neuroimaging technology used in the present study allowed us to investigate in vivo changes in brain glucose metabolism induced by a HFD in small animals,[10,34]but the resolution of the micro-PET system was not sufficient to analyze the activity changes of all brain regions of interest.
Follow-up studies will be needed to assess the rate of change in brain activity after starting a HFD and the persistence of the changes after stopping a HFD.
4.3 significance
These findings support hypotheses about the role of a HFD in the causal pathway for depressive symptoms.Nine weeks of a HFD in rats resulted in the expected increase in weight and change in serum lipid levels,but it was also associated with a decreased preference for sucrose – which may be due to a loss of interest in pleasurable activities – and a significant deactivation of the right thalamus and right striatum. Further work is needed to confirm these findings and to clarify the underling mechanisms involved, but it appears clear that the interaction between the content of the diet and the limbic system-striatum-thalamus circuit plays a role in both eating behavior and depressive symptoms.
Conflict of interest
Authors report no conflict of interest related to this paper.
Funding
This study was partly supported by the Stanley Medical Institute Award (Grant ID #02I-008) and Suzhou Ke Jiao Xing Wei Project (Grant ID KJXW2013011).
Acknowledgments
We thank Dong-Pyo Jang, Ph.D for excellent technical assistance and for providing the [F-18] FDG rat brain PET template. We also thank Weijun Tang, M.D. for imaging processing and Drew Fralick, B.A. for polishing this paper.
1. Loguercio C, De Simone T, D’auria M, Sio I, Federico A, Tuccillo C, et al. Non-alcoholic fatty liver disease: a multicentre clinical study by the Italian Association for the Study of the liver. Digestive and liver disease. 2004;36(6):398-405. doi: http://dx.doi.org/10.1016/j.dld.2004.01.022
2. Anstey KJ, Lipnicki DM, Low L-F. Cholesterol as a risk factor for dementia and cognitive decline: a systematic review of prospective studies with meta-analysis. Am J Geriatr Psychiatry. 2008;16: 343-354. doi: http://dx.doi.org/10.1097/JGP.0b013e31816b72d4
3. Morgan RE, Palinkas LA, Barrett-Connor EL, Wingard DL. Plasma cholesterol and depressive symptoms in older men. Lancet. 1993;341: 75-79. doi: http://dx.doi.org/10.1016/0140-6736(93)92556-9
4. Beasley CL, Honer WG, Bergmann K, Falkai P, Lütjohann D,Bayer TA. Reductions in cholesterol and synaptic markers in association cortex in mood disorders. Bipolar disorders.2005;7: 449-455. doi: http://dx.doi.org/10.1111/j.1399-5618.2005.00239.x
5. Richter N, Juckel G, Assion HJ. Metabolic syndrome: a follow-up study of acute depressive inpatients. Eur Arch Psychiatry Clin Neurosci. 2010;260: 41-49. doi: http://dx.doi.org/10.1007/s00406-009-0013-5
6. Murphy JM, Horton NJ, Burke Jr JD, Monson RR, Laird NM, Lesage A, et al. Obesity and weight gain in relation to depression: findings from the Stirling County Study.International Journal of Obesity. 2009;33(3): 335-341. doi:http://dx.doi.org/10.1038/ijo.2008.273
7. Vogelzangs N, Kritchevsky SB, Beekman AT, Brenes GA,Newman AB, Satterfield S, et al. Obesity and Onset of Significant Depressive symptoms: Results from a community-based cohort of older men and women. J Clin Psychiatry. 2010;71: 391. doi: http://dx.doi.org/10.4088/JCP.08m04743blu
8. Glueck CJ, Tieger M, Kunkel R, Tracy T, Speirs J, Streicher P, et al. Improvement in symptoms of depression and in an index of life stressors accompany treatment of severe hypertriglyceridemia. Biol Psychiatry. 1993;34: 240-252. doi:http://dx.doi.org/10.1016/0006-3223(93)90078-R
9. Seplowitz AH, Chien S, Smith FR. Effects of lipoproteins on plasma viscosity. Atherosclerosis. 1981;38: 89-95
10. Hu H, Su L, Xu YQ, Zhang H, Wang LW. Behavioral and [F-18]fluorodeoxyglucose micro positron emission tomography imaging study in a rat chronic mild stress model of depression. Neuroscience. 2010;169: 171-181. doi: http://dx.doi.org/10.1016/j.neuroscience.2010.04.057
11. Molteni R, Barnard RJ, Ying Z, Roberts CK, Gόmez-Pinilla F. A high-fat, refined sugar diet reduces hippocampal brain-derived neurotrophic factor, neuronal plasticity, and learning. Neuroscience. 2002;112: 803-814. doi: http://dx.doi.org/10.1016/S0306-4522(02)00123-9
12. Willner P, Towell A, Sampson D, Sophokleous S, Muscat R.Reduction of sucrose preference by chronic unpredictable mild stress, and its restoration by a tricyclic antidepressant.Psychopharmacology. 1987;93: 358-364. doi: http://dx.doi.org/10.1007/BF00187257
13. Schweinhardt P, Fransson P, Olson L, Spenger C, Andersson JL. A template for spatial normalisation of MR images of the rat brain. J Neurosci Methods. 2003;129: 105-113. doi:http://dx.doi.org/10.1016/S0165-0270(03)00192-4
14. Paxinos G, Watson C. The Rat Brain in Stereotaxic Coordinates. 2007; Massachusetts: Academic Press
15. Willner P. Chronic mild stress (CMS) revisited: consistency and behavioural-neurobiological concordance in the effects of CMS. Neuropsychobiology. 2005;52: 90-110. doi: http://dx.doi.org/ 10.1159/000087097
16. Amsterdam JD, Settle RG, Doty RL, Abelman E, Winokur A.Taste and smell perception in depression. Biol Psychiatry.1987;22(12):1481-1485
17. Chan J, Knutsen SF, Blix GG, Lee JW, Fraser GE. Water, other fluids, and fatal coronary heart disease the adventist health study. Am J Epidemiol. 2002;155: 827-833. doi: http://dx.doi.org/10.1093/aje/155.9.827
18. Barnard RJ, Roberts CK, Varon SM, Berger JJ. Diet-induced insulin resistance precedes other aspects of the metabolic syndrome. J Appl Physiol. 1998;84: 1311-1315
19. Stanford, SC. The Open Field Test: Reinventing the Wheel.J Psychopharmacology.21(2): 134–135. doi: http://dx.doi.org/10.1177/0269881107073199
20. Katz RJ, Roth KA, Carroll BJ. Acute and chronic stress effects on open field activity in the rat: implications for a model of depression. Neurosci Biobehav Rev. 1981;5: 247-251. doi:http://dx.doi.org/10.1016/0149-7634(81)90005-1
21. Levin BE, Triscari J, Sullivan AC. Altered sympathetic activity during development of diet-induced obesity in rat.American Journal of Physiology-Regulatory, Integrative and Comparative Physiology. 1983;244: R347-R355
22. Johnson PM, Kenny PJ. Dopamine D2 receptors in addictionlike reward dysfunction and compulsive eating in obese rats.Nat neuroscience. 2010;13: 635-641. doi: http://dx.doi.org/10.1038/nn.2519
23. Gautier JF, Chen K, Salbe AD, Bandy D, Pratley RE, Heiman M,et al. Differential brain responses to satiation in obese and lean men. Diabetes. 2000;49: 838-846. doi: http://dx.doi.org/10.2337/diabetes.49.5.838
24. Davis JF, Tracy AL, Schurdak JD, Tshöp MH, Lipton JW, Clegg DJ et al. Exposure to elevated levels of dietary fat attenuates psychostimulant reward and mesolimbic dopamine turnover in the rat. Behav Neurosci. 2008;122: 1257. doi: http://dx.doi.org/10.1037/a0013111.
25. Tataranni PA, Gautier JF, Chen K, Uecker A, Bandy D, Salbe AD, et al. Neuroanatomical correlates of hunger and satiation in humans using positron emission tomography.Proce Nati Aca Sci USA. 1999;96: 4569-4574. doi: http://dx.doi.org/10.1073/pnas.96.8.4569
26. Bhatnagar S, Huber R, Nowak N, Trotter P. Lesions of the posterior paraventricular thalamus block habituation of hypothalamic-pituitary-adrenal responses to repeated restraint. J Neuroendocrinology. 2002;14: 403-410. doi:http://dx.doi.org/10.1046/j.0007-1331.2002.00792.x
27. Greicius MD, Flores BH, Menon V, Glover GH, Solvason HB, Kenna H, et al. Resting-state functional connectivity in major depression: abnormally increased contributions from subgenual cingulate cortex and thalamus. Bio Psychiatry.2007;62: 429-437. doi: http://dx.doi.org/10.1016/j.biopsych.2006.09.020
28. Young KA, Holcomb LA, Yazdani U, Hicks PB, German DC.Elevated neuron number in the limbic thalamus in major depression. Am J Psychiatry. 2004;161: 1270-1277. doi:http://dx.doi.org/10.1176/appi.ajp.161.7.1270
29. Mayberg HS, Lewis PJ, Regenold W, Wagner HN Jr. Paralimbic hypoperfusion in unipolar depression. J Nucl Med. 1994;35(6): 929
30. Stice E, Yokum S, Burger KS, Epstein LH, Small DM.Youth at risk for obesity show greater activation of striatal and somatosensory regions to food. J Neurosci.2011;31: 4360-4366. doi: http://dx.doi.org/10.1523/JNEUROSCI.6604-10.2011
31. Krishnan KR, McDonald WM, Doraiswamy PM, Tupler LA,Husain M, Boyko OB et al. Neuroanatomical substrates of depression in the elderly. Eur Arch Psychiatry Clin Neurosci. 1993;243: 41-46. doi: http://dx.doi.org/10.1007/BF02191522
32. Andreason PJ, Altemus M, Zametkin AJ, King AC, Lucinio J,Cohen RM. Regional cerebral glucose metabolism in bulimia nervosa. Am J Psychiatry. 1992;149: 1506-1515
33. Sung KK, Jang DP, Lee S, Kim M, Lee SY, Kim YB, et al.Neural responses in rat brain during acute immobilization stress: a [F-18] FDG micro PET imaging study. Neuroimage.2009;44: 1074-1080. doi: http://dx.doi.org/10.1016/j.neuroimage.2008.09.032
2014-05-19; accepted: 2014-05-22)

Hua Hu graduated with a bachelor’s degree in clinical medicine from the Shanxi Medical University in 2003. She obtained a master’s degree in psychiatry from Suzhou University in 2007 and a doctoral degree in psychiatry from Fudan University in 2010. Since June 2011, she has been working in the Department of Internal Neurology of the No. 2 Hospital affiliated with Suzhou University. She is currently an attending doctor. She is mainly interested in clinical research in depression and dementia.
9周高脂肪饮食后大鼠行为及脑葡萄糖代谢的改变:一项随机对照试验
胡华,许烨勍,刘春风,赵合庆,张宏,王立伟
高脂肪的饮食,抑郁症,动物模型,葡萄糖代谢,小动物PET
Background: A high-fat diet (HFD) is a well-known risk factor for cardio-cerebrovascular disease but the relationship between a HFD and depressive symptoms remains unknown.Aim:Compare changes in behavioral and measures of brain glucose metabolism in rats fed a HFD to those of rats fed a standard diet.Methods:Twenty male Sprague-Dawley rats were randomly assigned to a study group (n=10) that
a high fat diet for 9 weeks or a control group (n=10) that received a standard diet for 9 weeks. At baseline and at the end of the 9-week trial assessments included body weight, serum lipids (total cholesterol,triglycerides, high-density lipoprotein cholesterol, and low-density lipoprotein cholesterol), the sucrose preference test, and the open field test. The rate of brain glucose metabolism in different brain regions(assessed using micro-positron emission tomography) at the end of the trial was also compared between the two groups of rats.Results:Nine weeks of a HFD in rats resulted in the expected increase in weight and changes in serum lipid levels, but it was also associated with a decreased preference for sucrose (which may be due to a loss of interest in pleasurable activities), increased weight-adjusted water intake, and a significant deactivation of the right thalamus and right striatum (based on decreased rates of glucose metabolism). In the HFD group the magnitude of the drop in the sucrose preference was strongly correlated to the magnitude of the deactivation of the right thalamus (r=0.78) and the right striatum (r=0.81).Conclusion:These findings support hypotheses about the role of a HFD in the causal pathway for depressive symptoms. Further work is needed to clarify the underling mechanism, but it appears that the interaction between the content of the diet and the limbic system-striatum-thalamus circuit plays a role in both eating behavior and depressive symptoms.
http://dx.doi.org/10.3969/j.issn.1002-0829.2014.03.004
1Department of Neurology, The Second Affiliated Hospital, Soochow University, Suzhou, Jiangsu Province, China
2Department of Psychiatry, Huashan Hospital, Fudan University, Shanghai, China
3Department of Nuclear Medicine, The Second Affiliated Hospital, Zhejiang University, Hangzhou, Zhejiang Province, China*correspondence: lwwang163@163.com
A full-text Chinese translation of this article will be available at www.saponline.org on July 25, 2014.
背景:高脂肪饮食(HFD)是心脑血管疾病的一个众所周知的危险因素,但HFD和抑郁症状之间的关系仍然不明目标:大鼠喂食高脂饮食后,与喂食普通食物的大鼠对照比较对行为和脑葡萄糖代谢的改变的差异。方法:20只雄性SD大鼠被随机分为研究组(n=10)、对照组(n=10),分别予高脂肪或标准喂食9周。基线和试验9周后的评估包括体重,血脂(总胆固醇,甘油三酯,高密度脂蛋白胆固醇,和低密度脂蛋白胆固醇),蔗糖偏好测试,以及旷场试验。在试验结束时再比较两组大鼠的不同脑区的大脑葡萄糖代谢率(采用小动物正电子发射断层扫描评估)。结果:正如预期,HFD组大鼠9周后体重增加、血清脂质水平出现变化,这些变化还与蔗糖偏好程度降低(这可能是由于对愉快性行为失去兴趣)、体重调整的水份摄入量增加、以及右丘脑和右侧纹状体的显著失活(基于糖代谢率的降低)有关。在HFD组中,蔗糖偏好的下降程度与右丘脑(r=0.78)和右纹状体(r=0.81)的失活程度显著相关。结论:这些发现支持了HFD与抑郁症状的产生过程有关的假说。目前看来,食物和边缘系统—纹状体—丘脑环路之间的相互作用在进食行为和抑郁症状的发生中起到一定作用,但还需要进一步研究来探索其内在机制。
猜你喜欢
杂志排行

上海精神医学的其它文章
- Neuroimaging studies of depressive disorders in China since 2000
- Two-year prospective case-controlled study of a case management program for community-dwelling individuals with schizophrenia
- Retrospective assessment of factors associated with readmission in a large psychiatric hospital in Guangzhou, China
- Retrospective assessment of the prevalence of cardiovascular risk factors among homeless individuals with schizophrenia in Shanghai
- Opportunities and challenges for promoting psychotherapy in contemporary China
- Case report of comorbid alcohol-induced psychotic disorder and Madelung’s disease