Log-transformation and its implications for data analysis
2014-12-09ChangyongFENGHongyueWANGNaijiLUTianCHENHuaHEYingLUXinTU
Changyong FENG*, Hongyue WANG, Naiji LU, Tian CHEN, Hua HE, Ying LU, Xin M. TU
•Biostatistics in psychiatry (20)•
Log-transformation and its implications for data analysis
Changyong FENG1*, Hongyue WANG1, Naiji LU1, Tian CHEN, Hua HE1, Ying LU2, Xin M. TU1
hypothesis testing, outliers, log-normal distribution, normal distribution, skewness
1. Introduction
The log transformation, a widely used method to address skewed data, is one of the most popular transformations used in biomedical and psychosocial research. Due to its ease of use and popularity, the log transformation is included in most major statistical software packages including SAS, Splus and SPSS.Unfortunately, its popularity has also made it vulnerable to misuse – even by statisticians – leading to incorrect interpretation of experimental results.[1]Such misuse and misinterpretation is not unique to this particular transformation; it is a common problem in many popular statistical methods. For example, the twosample t-test is widely used to compare the means of two independent samples with normally distributed(or approximately normal) data, but many researchers take this critical assumption for granted, using t-tests without bothering to check or even acknowledge this underlying assumption. Another example is the Cox regression model used in survival analysis; many studies apply this popular model without even being aware of the proportionality assumption (i.e., the relative hazard of groups of interest is constant over time) required for valid inference.
In this article we focus on the log-transformation and discuss major problems of using this method in practice. We use examples and simulated data to show that this method often does not resolve the original problem for which it is being used (i.e., non-normal distribution of primary data) and to show that using this transformation can introduce new problems that are even more difficult to deal with then the problem of non-normal distribution of data. We conclude with recommendations of alternative analytic methods that eliminate the need of transforming non-normal data distributions prior to analysis.
2. Log-normal transformation
2.1 Using the log transformation to make data conform to normality
The normal distribution is widely used in basic and clinical research studies to model continuous outcomes.Unfortunately, the symmetric bell-shaped distribution often does not adequately describe the observed data from research projects. Quite often data arising in real studies are so skewed that standard statistical analyses of these data yield invalid results. Many methods have been developed to test the normality assumption of observed data. When the distribution of the continuous data is non-normal, transformations of data are applied to make the data as ‘normal’ as possible and,thus, increase the validity of the associated statistical analyses. The log transformation is, arguably, the most popular among the different types of transformations used to transform skewed data to approximately conform to normality.
If the original data follows a log-normal distribution or approximately so, then the log-transformed data follows a normal or near normal distribution. In this case, the log-transformation does remove or reduce skewness. Unfortunately, data arising from many studies do not approximate the log-normal distribution so applying this transformation does not reduce the skewness of the distribution. In fact, in some cases applying the transformation can make the distribution more skewed than the original data.
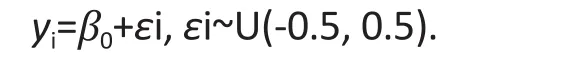
To show how this can happen, we first simulated data uiwhich is uniformly distributed between 0 and 1,and then constructed two variables as follows:

Shown in the left panel in Figure 1 is the histogram of xi, while the right panel is the histogram of yi(the logtransformed version of xi) based on a sample size of n=10,000. While the distribution of xiis right-skewed,the log-transformed data yiis clearly left-skewed. In fact,the log-transformed data yiis more skewed than the original xi, since the skewness coefficient for yiis 1.16 while that for xiis 0.34. Thus, the log-transformation actually exacerbated the problem of skewness in this particular example.
In general, for right-skewed data, the logtransformation may make it either right- or left-skewed.If the original data does follow a log-normal distribution,the log-transformed data will follow or approximately follow the normal distribution. However, in general there is no guarantee that the log-transformation will reduce skewness and make the data a better approximation of the normal distribution.
2.2 Using the log transformation to reduce variability of data
Another popular use of the log transformation is to reduce the variability of data, especially in data sets that include outlying observations. Again, contrary to this popular belief, log transformation can often increase –not reduce – the variability of data whether or not there are outliers.
For example, consider the following simple linear regression with only an intercept term:
Unlike the ordinary regression analysis where the error term is assumed to have a normal distribution,the error term in this regression is uniformly distributed between -0.5 and 0.5. Thus yiin the above model does not follow a log-normal distribution and the logtransformed yidoes not have a normal distribution. We then simulated data yifor this model with a sample size of n=100 and a value of the β0parameter ranging from 0.5 to 5.5. Note that β0starts from 0.5, rather than from 0, to ensure yi>0 and, thus, log (yi) is correctly estimated when performing the log transformation on the data simulated from the linear regression of the original data.We fit two different linear models on the same data.The first model used the data without transformation,the second model used the log-transformed data. Theordinary least square method was used to estimate the intercepts in both models.
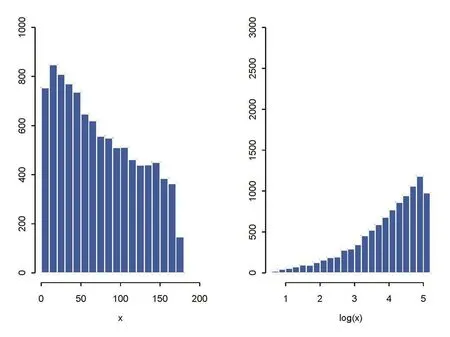
Figure 1. Histograms of original data (left plot) and log-transformed data (right plot) from a simulation study that examines the effect of log-transformation on reducing skewness.
Table 1 shows the original and log-transformed estimates of β0and its standard errors averaged over 100,000 Monte Carlo (MC) simulations[1]from fitting the linear model to the original data. We use a large MC sample size to help reduce the sampling variability in the standard error estimates; thus the differences in the presented estimates from fitting the original and log-transformed data reflect true differences. The table shows that when β0=0.5, the standard errors from the model fi t to the original yiwere much smaller than those from fitting the log-transformed data. As β0increased towards 5.5, the standard errors from fitting the original data remained the same, while their counterparts from fitting the log-transformed data decreased. When β0increased past the value 1, the standard errors from fitting the log-transformed data became smaller than those from fitting the original data. Table 2 presents the same estimates of β0as those in Table 1, except that we introduced four outlying points (4, 6, 8 and 10) in the simulated data, thereby increasing the sample size to 104. As can be seen in Table 2, the estimates of β0and of the standard error of β0changed after introduction of the outliers, but the pattern of differences in these estimates between the model for the original data and for the log-transformed data remains the same. This example shows that the conventional wisdom about the ability of a log transformation of data to reduce variability especially if the data includes outliers, is not generally true. Whether the log transformation reduces such variability depends on the magnitude of the mean of the observations — the larger the mean the smaller the variability.
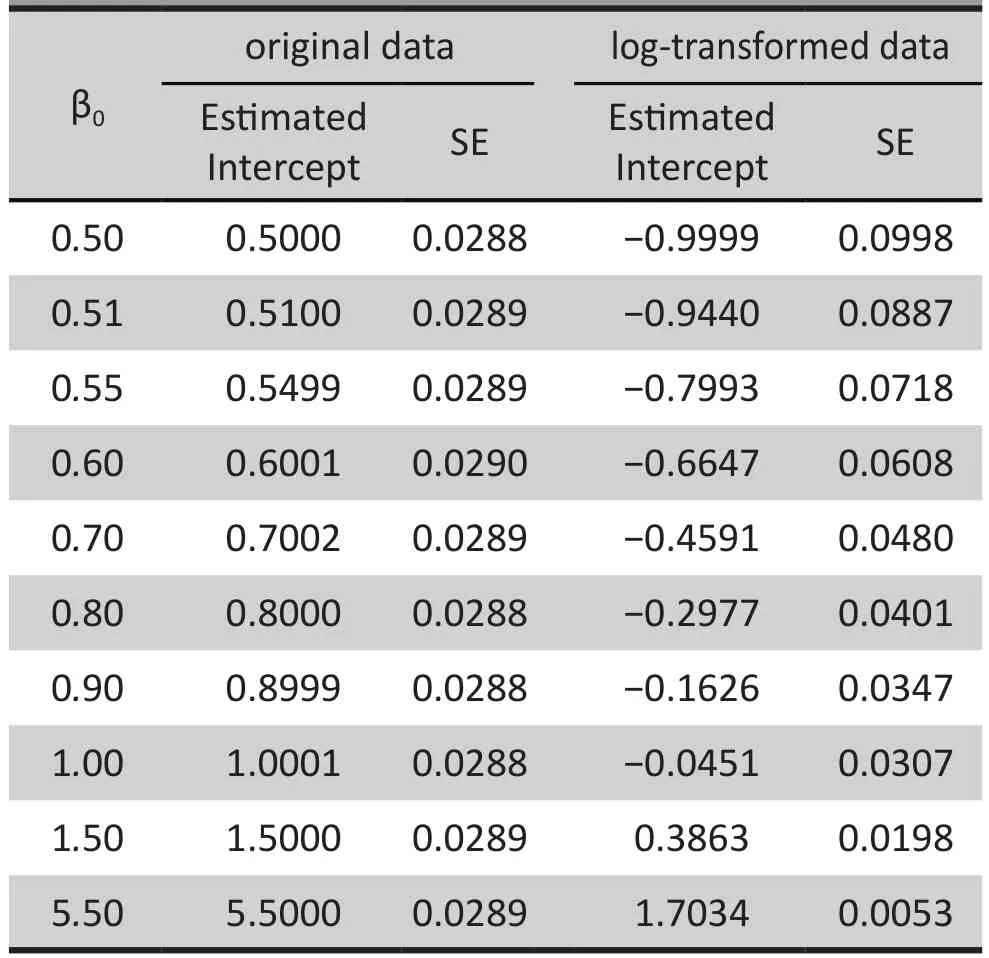
Table 1. Simulation results for simple linear regression without outliers (n=100; 100,000 simulations)
A more fundamental problem is that there is little value in comparing the variability of original versus logtransformed data because they are on totally different scales. In theory we can always find a transformation for any data to make the variability of the transformed version either smaller or larger than that of the original data. For example, if the standard deviation of variable x is σ, then the standard deviation of the scale transformation x/K (K>0) is σ/K; thus by selecting a sufficiently large or small K we can change the standard deviation of the transformed variable x/K to any desired level.
3. Difficulty of interpreting model estimates from logtransformed data
3.1 Estimation of model parameters
Once the data is log-transformed, many statistical methods, including linear regression, can be applied to model the resulting transformed data. For example,the mean of the log-transformed observations (log yi),often used to estimate the population mean of the original data by applyingthe anti-log (i.e., exponential) function to obtain However, this inversion of the mean log value does not usually result in an appropriate estimate of the mean of the original data. For example, as shown by Feng and colleagues,[2]if yifollows a log-normal distribution (µ,σ2), then the mean of yiis given by E(yi)=exp(µ + σ2/2).If we log-transform yi, the transformed log yifollows a normal distribution with a mean of µ.mean of the log-transformed datayiis an unbiased estimatethe exponential function ofestimate of exp(µ). However, the mean of the original data yiis exp(µ+σ2/2), not exp(µ). Thus, even in this ideal situation, estimating the mean of the original yiusing the exponent or anti-log of the sample mean of the logtransformed data can generate inaccurate estimates of the true population mean of the original data.
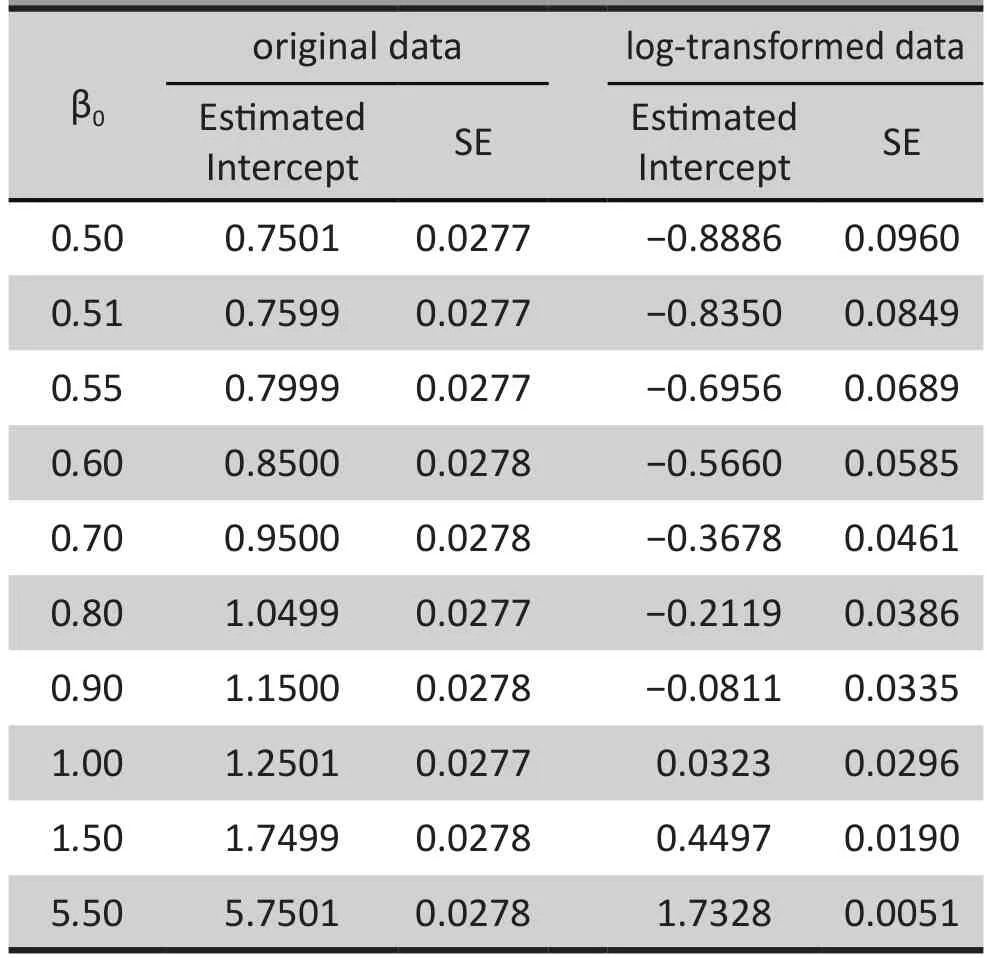
Table 2. Simulation results for simple linear regression with outliers (n=104; 100,000 simulations)
3.2 Hypothesis testing with log-transformed data
It is also more difficult to perform hypothesis testing on log-transformed data. Consider, for example, the two sample t-test, which is widely used to compare the means of two normal (or near normal) samples. If the two samples have the same variance, the test statistic has a t-distribution. For skewed data (when the variance of samples is usually different), researchers often apply the log-transformation to the original data and then perform the t-test on the transformed data. However,as demonstrated below, applying such a test to logtransformed data may not address the hypothesis of interest regarding the original data.
Let y1iand y2idenote two samples. If the data from both samples follow a log-normal distribution,with log-normal (µ1, σ12) for the first sample and (µ2,σ22) for the second sample, then the first sample has the mean exp(µ1+σ12/2) and the second has the mean exp(µ2+σ22/2). If we apply the two-sample t-test to the original data, we are testing the null hypothesis that these two means are equal, H0: exp(µ1+σ12/2)=exp(µ2+σ22/2).
If we log-transform the data, the transformed data have the mean µ1and variance σ12for the first sample and mean µ2and variance σ22for the second sample. Thus, if we apply the two-sample t-test to the transformed data, the null hypothesis of the equality of the means becomes, H0: µ1=µ2.
The two null hypotheses are clearly not equivalent.Although the null hypothesis based on the logtransformed data does test the equality of the means of the two log-transformed samples, the null hypothesis based on the original data does not, since the mean of the original data also involves the parameters, σ12and σ22. Thus, even if no difference is found between the two means of the log-transformed data, it does not mean that there is no differences between the means in the original data of the two samples. For example, if the null hypothesis for the log-transformed data, H0: µ1=µ2,is not rejected for the log-transformed data, it does not imply that the null hypothesis for comparing the means of the original data of the samples, H0: exp(µ1+σ12/2)=exp(µ2+σ22/2), is true, unless the variances of the two samples are the same.
3.3 Effect of adding a small constant to data when performing log transformations of data
Since the log transformation can only be used for positive outcomes, it is common practice to add a small positive constant, M, to all observations before applying this transformation. Although appearing quite harmless,this common practice can have a noticeable effect on the level of statistical significance in hypothesis testing.
We examine the behavior of the p-value resulting from transformed data using a simulation. We simulated data from two independent normal distributions,with sample size n=100. The data is generated in the following way: (1) generate two independent random numbers uiand vi(i=1, …, n), where uihas a standard normal distribution and vihas a normal distribution with mean of 1 and a standard deviation of 2; (2) generate yi1and yi2according to the following formulas:

We then added a constant, M, to each observation of yi1and yi2before the data were log transformed.Figure 2 shows the p-values from comparing the means of the log-transformed data from the two samples, based on using different values of M. When M=0, the p-value for the difference in the means of the two samples of log-transformed data is 0.058, that is, the difference was not statistically significant at the usual typeierror level of α=0.05. However, as M increases the p-values dropped and fell below the 0.05 threshold for statistical significance after it rose above 100. This simulation study indicates that the p-value of the test depends on what value is added to the data before applying the log-transformation, potentially making conclusions about differences between groups dependent on the somewhat arbitrary decision of the researcher about the size of M to be used in the analysis.
4. Discussion
Using transformations in general and log transformation in particular can be quite problematic. If such an approach is used, the researcher must be mindful about its limitations, particularly when interpreting the relevance of the analysis of transformed data for the hypothesis of interest about the original data.For example, we have demonstrated that in most circumstances the log transformation does not help make data less variable or more normal and may, in some circumstances, make data more variable and more skewed. Furthermore, log-transformed data cannot usually facilitate inferences concerning the original data,since it shares little in common with the original data.
For many applications, rather than trying to fi nd an appropriate statistical distribution or transformation to model the observed data, it would probably be better to abandon this classic approach and switch to modern distribution-free methods. For example, a popular approach that can avoid many of these problems is the generalized estimating equations, or GEE.[3,4]This approach forgoes the distribution assumption, providing valid inference regardless of the distribution of the data.However, this is only appropriate for skewed data, if the data can be reasonably modeled by a parametric distribution such as the normal distribution, it is preferable to use the classic statistical methods because they usually provide more efficient inference than GEE.
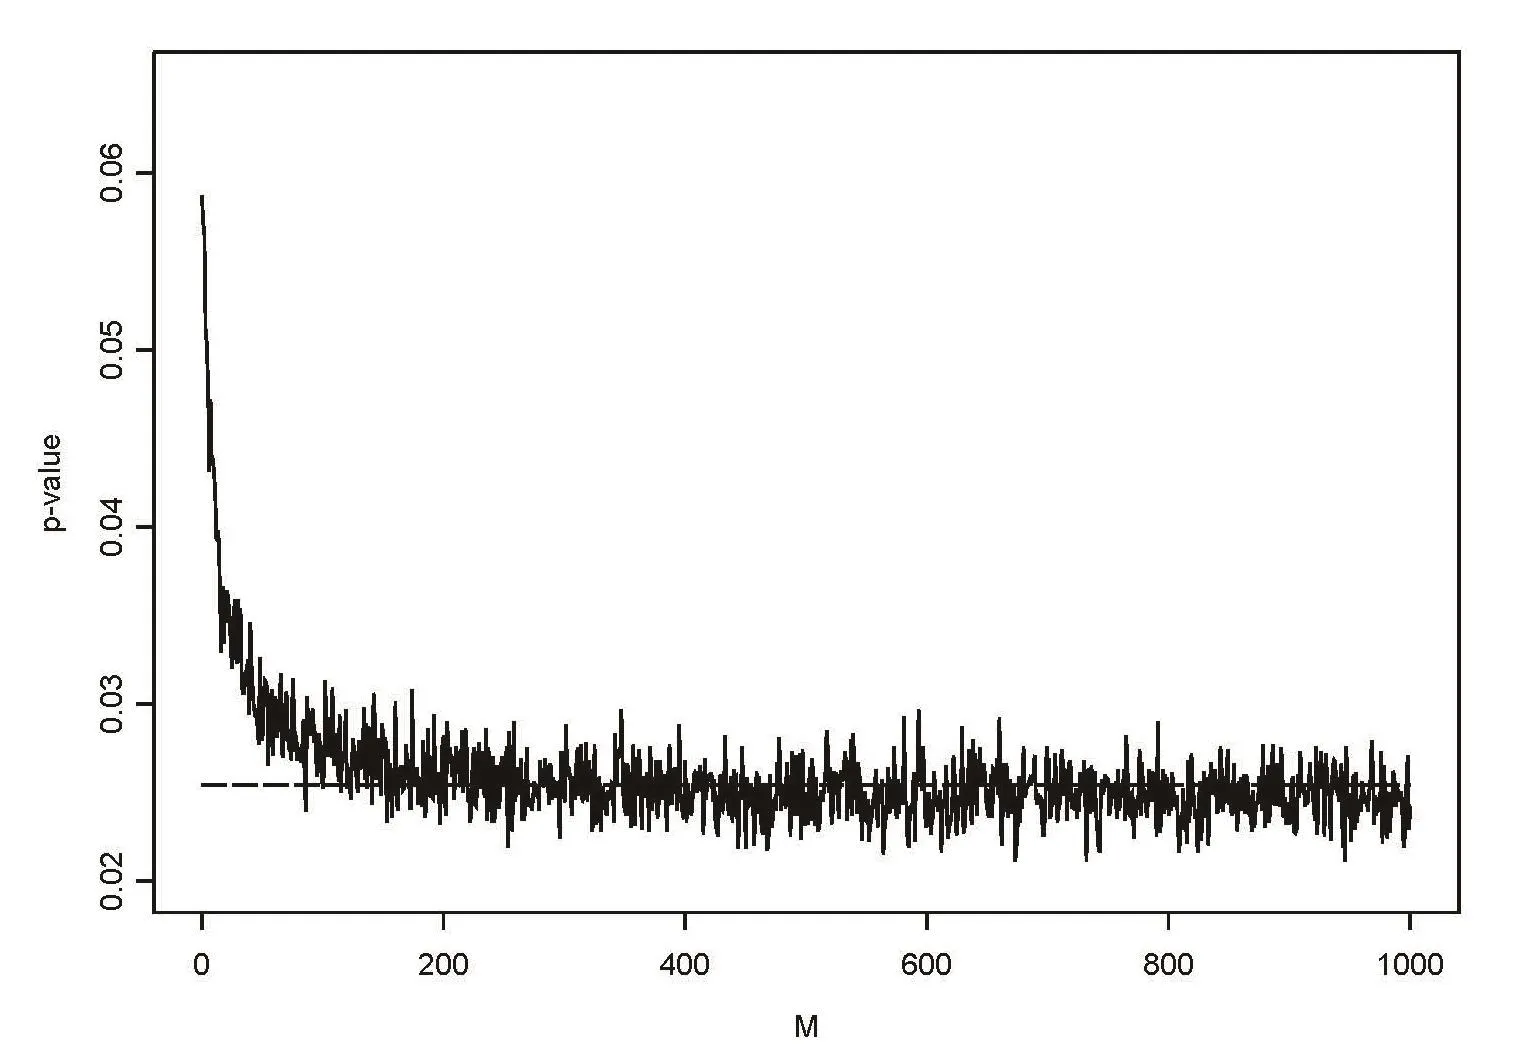
Figure 2. P-values as a function of values added to the data before applying log-transformation.
Conflict of interest
The authors report not conflict of interest related to this manuscript.
Funding
This research was supported in part by the Novel Biostatistical and Epidemiologic Methodology grants from the University of Rochester Medical Center Clinical and Translational Science Institute Pilot Awards Program.
1. Robert CP, Casella G. Monte Carlo Statistical Methods (2ndedition). New York: Springer. 2004
2. Feng C, Wang H, Lu N, Tu XM. Log-transformation:applications and interpretation in biomedical research.Statistics in Medicine. 2012;32: 230-239. doi: http://dx.doi.org/10.1002/sim.5486
3. Kowalski J, Tu XM. Modern Applied U Statistics. New York:Wiley. 2007
4. Tang W, He H, Tu XM. Applied categorical and count data analysis. FL: Chapman & Hall/CRC. 2012
数据分析中的对数转换和意义
Changyong FENG, Hongyue WANG, Naiji LU, Tian CHEN, Hua HE, Ying LU, Xin M. TU
对数转换的方法在生物医学和社会心理研究中处理非正态数据时被广泛应用。本文重点介绍该传统方法在处理非正态数据时存在的严重问题。尽管通常认为对数转换可以减少数据的变异性,使数据更符合正态分布,但是通常并非如此。此外,对数转换后的数据得出的标准统计测试结果往往和未转化的原始数据不相关。我们通过使用模拟数据示例来说明这些问题。我们认为如果采用数据转换,必须非常谨慎应用。我们建议研究者在大多数情况下摒弃这些处理非正态数据的传统方法,选择采用较新的不依赖于数据分布的方法:如广义估计方程(GEE)。
假设检验,离群值,对数正态分布,正态分布,偏度
Summary:The log-transformation is widely used in biomedical and psychosocial research to deal with skewed data. This paper highlights serious problems in this classic approach for dealing with skewed data. Despite the common belief that the log transformation can decrease the variability of data and make data conform more closely to the normal distribution, this is usually not the case. Moreover, the results of standard statistical tests performed on log-transformed data are often not relevant for the original, non-transformed data. We demonstrate these problems by presenting examples that use simulated data. We conclude that if used at all,data transformations must be applied very cautiously. We recommend that in most circumstances researchers abandon these traditional methods of dealing with skewed data and, instead, use newer analytic methods that are not dependent on the distribution the data, such as generalized estimating equations (GEE).
http://dx.doi.org/10.3969/j.issn.1002-0829.2014.02.009
1Department of Biostatistics and Computational Biology, University of Rochester, Rochester, New York, United States2Department of Health Research and Policy, Stanford University School of Medicine, Stanford, California, United States
*correspondence: feng@bst.rochester.edu
A full-text Chinese translation will be available at www.saponline.org on May 15, 2014.

his BSc in 1991 from the University of Science and Technology of China and subsequently obtained a PhD in statistics from the University of Rochester in 2002. He is currently an associate professor in the Department of Biostatistics and Computational Biology at University of Rochester. The main focus of his research is on survival analysis.
猜你喜欢
杂志排行

上海精神医学的其它文章
- The dopamine system and alcohol dependence
- Suicide in India: a systematic review
- Effectiveness of self-management training in community residents with chronic schizophrenia: a single-blind randomized controlled trial in Shanghai, China
- Randomized controlled trial comparing changes in serum prolactin and weight among female patients with first-episode schizophrenia over 12 months of treatment with risperidone or quetiapine
- Retrospective comparison of cognitive behavioral therapy and symptom-specific medication to treat anxiety and depression in throat cancer patients after laryngectomy
- Providing free treatment for severe mental disorders in China