The atmospheric circulation patterns influencing the frequency of spring sand-dust storms in the Tarim Basin
2014-10-09HongJunLiXinHuaYangYongZhaoMinZhongWangWenHuo
HongJun Li , XinHua Yang, Yong Zhao, MinZhong Wang, Wen Huo
Urumqi Institute of Desert Meteorology, China Meteorological Administration, Urumqi, Xinjiang 830002, China
1 Introduction
The Tarim Basin (75°E–91°E, 37°N–41°N) is located in an extremely arid climate zone, with the Taklimakan Desert (the largest desert in China) dominating vast parts of the region. Frequent sand-dust storms occur in spring and summer when its surface temperature rises and the surface winds strengthen (Qianet al., 2002). The observed wind velocity threshold of sand movement is only 5.2 m/s (Chen, 1994). Consequently, the Tarim Basin is a major origin of severe and extremely severe sand-dust storm events (Qianet al., 2002; Wanget al., 2003; Wanget al., 2010) affecting China (Gao and Jiang, 2002; Wanget al., 2003; Liuet al., 2004; Liet al., 2008). Within the Tarim Basin, the most frequent sandstorms occur in the Taklimakan Desert, with pronounced interannual and decadal variations. Sand-dust storms in the Taklimakan Desert mainly occur from March to August, with April to June being the most active period (Gao and Jiang, 2002;Maet al., 2006). A large number of sandstorms were observed in the 1970s, but the number dramatically declined in the 1990s, although the total number of weak and localized sand-dust storms increased (Zhou, 2001;Gao and Jiang, 2002; Maet al., 2006; Fenget al., 2010).
Based on satellite images of sandstorms in the hinterland of the basin in recent decades, it is generally acknowledged that there are four types of air motions generating the dust storms in the Tarim Basin: (1) strong,large-scale cold air invasions from the west and north; (2)cold air invasions coming from the east; (3) the combination of downslope cold air flow and east-originating cold air; and (4) the basin’s middle air is pumped from low level to upper level (Li and Xiao, 1999). These systems are largely influenced by the unique topographic features of the Tarim Basin, with the Tibetan Plateau at its south,the Kunlun Mountains at its west, and the Tianshan Mountains at its north (Xu, 1997).
The synoptic cause for the sand-dust storms in the basin is that, due to the strong surface heating in its warm seasons, a shallow thermal depression normally dominates the region. When cold air invades the basin, a strong, low-level atmospheric convergence forms over the areas of Hetian-Yutian-Minfeng and Keping. The associated strong ascending motion in the atmospheric boundary layer provides the dynamic lifting mechanism for sand dust, causing these two areas to have the most frequent sand-dust storms in all of China (Heet al., 1998;Hanet al., 2005). Furthermore, corresponding to the low-level heat system, the upper atmosphere is dominated by strong atmospheric divergence and a descending motion in the upper-level jet stream inlet area. This leads to the downward propagation of the high-level momentum, which further enhances the middle and low-level wind speeds and develops a cold front moving southward.This finally triggers the outbreaks of sandstorm events(Wanget al., 2008; Penget al., 2009).
Besides these large-scale synoptic patterns, the frequency of sand-dust storms is also influenced by local climate factors such as precipitation, relative humidity,surface temperature, and wind velocity (Zenget al.,2010). Previous research (e.g., Weiet al., 2004) reported rising temperatures in recent past decades in the Tarim Basin. At the same time, precipitation has increased and the near-surface winds have declined. Those researchers concluded that these changes have contributed to the decline of sand-dust storm days in South Xinjiang.
Although there is a reasonable understanding of the synoptic setup and local climate conditions that are favorable for sandstorms to develop in the basin, the causes of the remarkable year-to-year variation in sandstorm occurrences are less clear. Liet al. (2008) posited that sandstorms have a quasi 3-year cycle, and other studies have shown that the spring and summer sand-dust weather patterns are influenced by many circulation systems ranging from polar regions to the low latitudes, such as the polar front embedded in the westerlies in the middle latitudes, the East Asia trough, and the position and strength of the subtropical high (Maoet al., 2005; Wanget al., 2007; Zenget al., 2010). Most of the analyses of the relationship between sand-dust storms and circulations have focused on the dust storms in northern China and the eastern part of northwest China. Less is understood about the atmospheric circulation systems influencing the dust storms in the Tarim Basin. This was the purpose of this study.
2 Data
We used the monthly sand-dust storm data from 37 meteorological stations situated in the Tarim Basin for the period of January 1961 to December 2009. Studies by Wang and Dong (2000) and Qianet al. (2002) showed that the data are of good quality. We mainly focused on the dust storm activities in the boreal spring season by averaging the sandstorm days during March-April-May to obtain the interannual time-series of the spring sandstorm frequencies. The atmospheric circulation data used in this study are from the NCEP/NCAR monthly reanalysis grid data at the spatial resolution of 2.5°×2.5° (Kalnayet al., 1996).
3 Analysis results
3.1 Changes in sandstorm frequencies
Sand-dust storms in the Tarim Basin exhibit significant interannual and decadal variations. Sand-dust storms occurred frequently during the 1960s and the 1970s and declined significantly in the 1980s. Since the 1990s,sandstorm occurrence in the basin has become less frequent (Figure 1). Calculation of the linear trend over the whole period revealed a declining trend of -1.2 sandstorm days per decade, which is statistically significant at the 99% confidence level. This result is consistent with the conclusions derived from other studies (Liet al.,2008).

Figure 1 The variation of sand-dust days in the Tarim Basin in spring during 1961–2009
3.2 Atmospheric circulation patterns associated with spring sandstorms
The dynamic and thermodynamic conditions that affect the variation of sand-dust storms are closely related to the large-scale atmospheric circulation background(Wang and Dong, 2000; Ren and Wang, 2009). Figure 2 shows correlations of the spring 500-hPa geopotential height and the sand-dust storm frequency in the Tarim Basin during the study period. It clearly displays a "- +-" pattern from the west to the east crossing the Eurasian continent, with negative correlations over the Paris Basin and the Zara region in midwestern Mongolia. In between, there is a weak positive correlation pattern near the Ural River region. The correlations over the Zara region have the highest negative values, with the correlation coefficient reaching -0.6. The correlation patterns over both the Zara region and the Paris Basin are statistically significant at the 95% confidence level.Combined with the mean circulation background (with a ridge system over the Urals and a trough over the midwestern Mongolia region), and the rising of the geopotential height at 500 hPa over midwestern Mongolia and its decline over the Ural region, the correlation patterns suggest a weakening of the meridional circulation between the two regions, and the prevailing circulation in the middle troposphere becomes more zonally oriented.This makes it difficult for high-latitude cold air masses to penetrate southward, resulting in weakened low-level winds and reduced frequency. The weakened low-level winds cannot easily cross over the Tianshan Mountains into the Tarim Basin. This also means that the cold air mass which often accumulates along the northern side of the Tianshan Mountains becomes weak and there is less east-originating cold air invasion into the Tarim Basin.
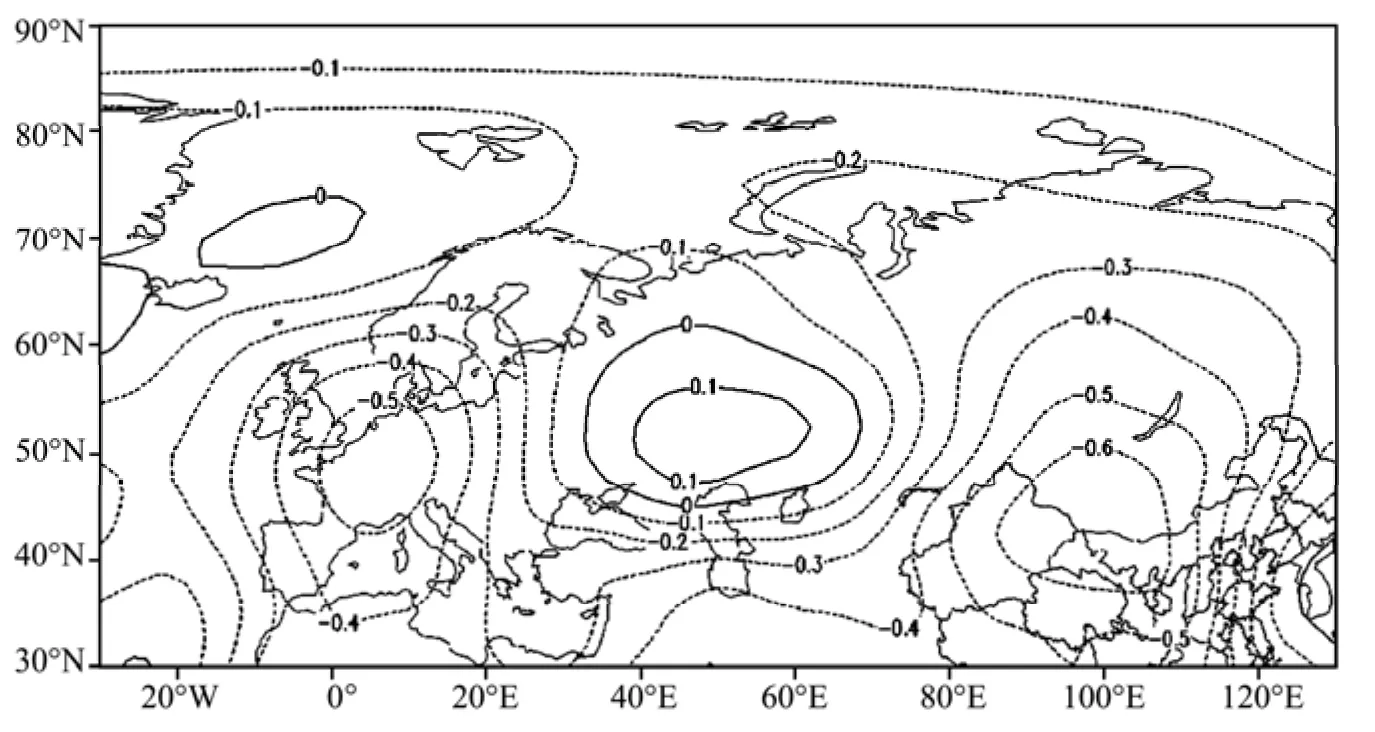
Figure 2 Correlations between sand-dust storm frequency in the Tarim Basin and atmosphere circulations in spring
Because the 500-hPa geopotential height over midwestern Mongolia has the most significantly negative correlation with the sand-dust storm frequency in the Tarim Basin, we further explored the relationship between the long-term variation of the height field and the sandstorm frequency in the basin. Figure 3 shows the interannual variation of the 500-hPa height over the area of 30°N–70°N, 80°E–120°E, where statistically negative correlations are shown in figure 2. The 500-hPa height in this region has experienced steady increases, and its correlation coefficient with the sandstorm frequency in the Tarim Basin reaches -0.69, passing the significance test at the 99% confidence level. The 500-hPa geopotential height has an increasing linear trend of 7.0 gpm per decade. Such an increase indicates that the low-value cyclone system is weakened and the large-scale winter monsoon circulation is also weakened. This means the southward intrusion of cold air from high latitudes is reduced. Associated with weakened surface winds in the spring, the sand-dust storm events are significantly reduced. This finding is in good agreement with the results of Zheng (2004).
3.3 Sandstorms and the abrupt increase in the 500-hPa geopotential height
Figures 1–3 show that the spring sandstorms vary significantly in response to changes in the regional atmospheric circulation. We used the Mann-Kendall rank statistical method (hereafter, MKT) (Fu and Wang, 1992)to test whether the variations of the sand-dust storms and geopotential height were significant during different periods, and whether the timing of the abrupt changes was consistent between the two.
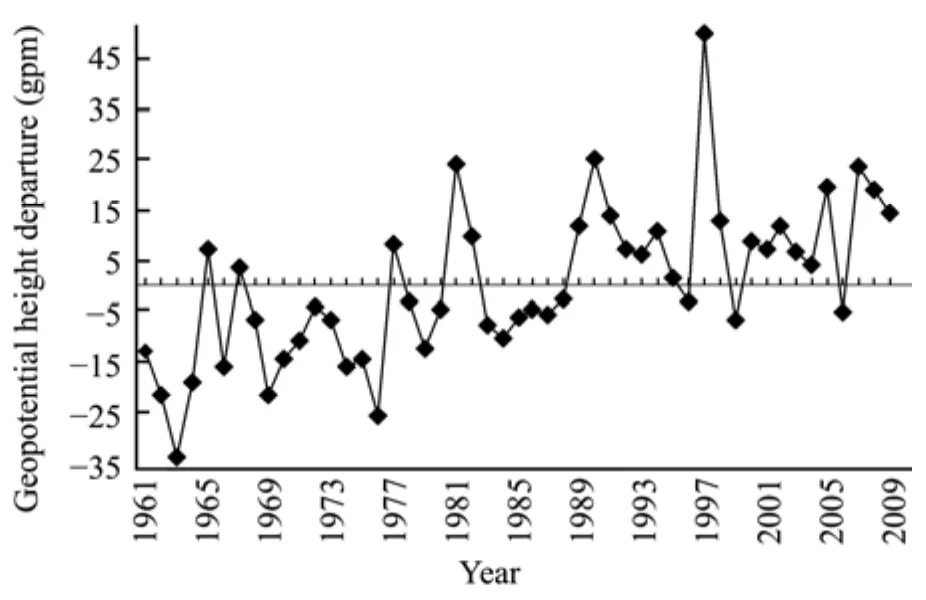
Figure 3 Time-series of the average geopotential height departure from 500 hPa over the area located in 30°N–70°N and 80°E–120°E
Figure 4 shows the time-series of the MKT curves for sandstorms in the Tarim Basin, and the 500-hPa geopotential height averaged over the areas of significantly negative correlations in the Zara region. In the early 1960s, the trend of sand-dust storm days was positive but became negative in the mid-1960s. From the late 1970s,the MKT curve of sand-dust storm frequency (line c1)dropped sharply. After 1984, the number of sand-dust storm days reached a significant decrease of 5%.
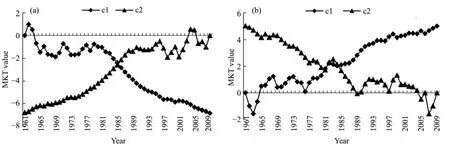
Figure 4 Abrupt changes of sand-dust storm frequency (a) and 500-hPa geopotential height (b) over the significantly negative correlation areas. c1 and c2 represent abrupt test statistical series in positive sequence and statistical series in reverse sequence, respectively.
The crossing point of lines c1 and c2 of the MKT appears in 1985, suggesting an abrupt change point of the dust storms around that time. The abrupt change in the spring sand-dust storms is related to the abrupt change in the geopotential height at 500 hPa. Figure 4b shows that the geopotential height (line c1) was in a negative trend in the early 1960s, and in the mid-1960s it turned into a positive trend. From the late 1970s to the 2000s, it has kept increasing significantly. According to the MKT curves in figure 4b, the abrupt changes in geopotential height which occurred in 1980 and 1984 coincide with the rapid declines in the sand-dust storm frequencies around 1985.
To further illustrate the influence of the atmospheric circulations on the sand-dust storms in the Tarim Basin,we conducted a composite analysis by calculating the mean atmospheric circulation anomalies during the years with higher and lower numbers of the spring sandstorms in the Tarim Basin. Out of the 49 spring seasons, we selected the years of 1962, 1979, 1971,1963, and 1966 as representing higher numbers of dust storms, and the years of 2005, 1997, 1996, 2000, and 2009 as representing lower numbers of the dust storms.The corresponding 500-hPa circulation patterns for more-frequent dust storms in the basin are related to the fact that the Tarim Basin is located in front of a high-pressure ridge, with cold air from the northwest travelling southward and eastward and then entering the Tarim Basin, causing strong surface winds and sandstorms (Figure 5).

Figure 5 The circulation departure field at 500 hPa in years with more (a) and fewer (b) sand-dust storms, and the circulation field (c) and wind departure field (d) at 850 hPa in years with more sand-dust storms
Figure 5a shows that the 500-hPa geopotential height has a positive anomaly center in the west and a negative center in the east. The negative anomaly over the western part of Mongolia extends farther north to the polar region.Meanwhile, the positive anomaly is located over the East European plains to the west of the Urals, and its northern boundary extends to the high-latitude region. The large pressure gradient between the two centers causes the zonal westerlies to be distorted and the circulation becomes more meridional. This kind of circulation situation formed by the high pressure (ridge) near the East European plains and the low pressure (trough) over Mongolia is a typical synoptic pattern that is often observed in the development of sand-dust storm weather in the Tarim Basin. In contrast, for the years with few sandstorms(Figure 5b) the synoptic pattern is almost opposite to the one shown in figure 5a, with a negative anomaly over eastern Europe and positive anomalies over western Mongolia. Under such conditions, the meridional circulation is weakened and the circulations become more stable,resulting in conditions that are not favorable for the development of sandstorms.
In the lower troposphere, figures 5c and 5d show the 850-hPa height and wind conditions favorable for dust storm development in the Tarim Basin. Over western Asia there exists one high pressure ridge, and from the Okhotsk Sea to the Tarim Basin is a trough in the northeast–southwest direction. The Tarim Basin is located in front of the ridge and in the back of the trough, so the prevailing airflow draws more cold air from the north into the basin from the northeast. The low-pressure system over western Mongolia is the primary factor that influences the occurrence of sand-dust storms in the Tarim Basin.
4 Conclusions
Based on NCEP/NCAR reanalysis data and sandstorm frequency data from the Tarim Basin, the impact of atmosphere patterns on sand-dust storms was investigated by correlations and atmosphere field composite analysis. The main conclusions are as follows:
1) The sand-dust storm frequency in the Tarim Basin in the spring season is closely related to certain patterns of large-scale atmospheric circulation. It has significantly negative correlations with the 500-hPa geopotential height over the Paris Basin and midwestern Mongolia,but positive correlations with the 500-hPa height over the Ural River region.
2) The 1985 abrupt decline in spring sandstorms in the Tarim Basin was accompanied by an abrupt increase in the 500-hPa height field over western Mongolia. This followed abrupt increases in the 500-hPa height in 1980 and 1984.
3) At the interannual scale, strengthened cyclonic circulation patterns over western Mongolia and anticyclones in the East European plains at 500-hPa geopotential height, are the typical background conditions conducive to more sand-dust storms in the Tarim Basin.
This work was supported by the Special Fund of the Central Scientific Research Institution (No. IDM201203),the National Natural Science Foundation of China (No.41305107), and the Nonprofit Sector Specific Research(Nos. GYHY201106025 and GYHY201006012).
Chen WN, Dong ZB, Yang ZT,et al., 1995. Threshold velocities of sand-driving wind in the Taklimakan Desert. Acta Geographica Sinica, 50(4): 360–367. DOI: 10.3321/j.issn:0375-5444.1995.04.009.
Gao WD, Jiang W, 2002. Discussion on the formation and harms of the sand-dust storms in the west and the south of Taklimakan Desert. J. Arid Land Resources and Env., 16(3): 64–70. DOI:10.3969/j.issn.1003-7578.2002.03.012.
Feng XY, Wang SG, Cheng YF,et al., 2010. Climatic features of sandstorms in the central and western part of the north in China. J. Desert Res., 30(2): 394–399.
Fu CB, Wang Q, 1992. The definition and test method of abrupt climate change. Chinese J. Atmos. Sci., 16(1): 111–119. DOI:10.3878/j.issn.1006-9895.1992.04.11.
Han YX, Fang XM, Song LC,et al., 2005. Discussion on atmospheric circulations and the cause of sand-dust storms in Tarim Basin, based on the desert aeolian deposit landform and wind fields reestablished by meteorological observations. Chinese J. Atmos. Sci., 29(4):627–635.
He Q, Xiang M, Tang SJ, 1998. Analysis on two severe sandstorms in the hinterland of Taklimakan Desert. J. Desert Res., 18(1): 320–327.
Kalnay E, Kanamitsu M, Kistler R, 1996. The NCEP/NCAR 40-year reanalysis project. Bull. Amer. Meteorol. Soc., 77: 437–471. DOI:10.1175/1520-0477(1996)077<0437:TNYRP>2.0.CO;2.
Li HJ, Li J, He Q, 2008. Study on the trends and sudden changes of sand-dust storms in Xinjiang. J. Desert Res., 28(5): 915–919.
Li H, Xiao JD, 1999. Remote monitoring to the sandstorms in the hinterland of Taklimakan Desert. J. Xinjiang Agri. Univ., 22(3):219–223.
Li SK, Lu M, Wang KR,et al., 2008. The effect of soil erosion to the ground surface in south Xinjiang on the formation of sand-dust weathers. Agricul. Sci. in China, 141(10): 3158–3167. DOI:10.3864/j.issn.0578-1752.2008.10.032.
Liu XD, Tian L, Zhang XY, 2004. Impact of the sand-dust events in Taklimakan Desert on the atmospheric PM10concentration in the lower reaches. China Env. Sci., 24(5): 528–532. DOI:10.3321/j.issn:1000-6923.2004.05.005.
Ma Y, Xiao KT, Wang X, 2006. Climatic features of the sand-dust weathers in Tarim Basin. Acta Sientiarum Naturalium Universitatis Pekinensis, 42(6): 784–790. DOI: 10.3321/j.issn:0479-8023.2006.06.016.
Mao WY, Ai L, Chen S,et al., 2005. Correlations between spring dust weathers in Xinjiang and characteristic quantities of month circulations in the earlier stages. Arid Land Geog., 28(2): 171–175. DOI:10.3321/j.issn:1000-6060.2005.02.007.
Peng Y, Wang Z, Xu XT, 2009. Analysis on the dynamic characteristics of circulations during a large-scale sand-dust weather event in the northwest. J. Desert Res., 29(4): 766–772.
Qian ZA, Song MH, Li WN, 2002. Analysis on the distribution and variation trend of sandstorms in the last 50 years in China. J. Desert Res., 22(2): 106–110. DOI: 10.3321/j.issn:1000-694X.2002.02.002.
Ren YL, Wang JS, 2009. Analysis on the factors affecting the changes of sandstorm weathers in the northwest and Tibetan Plateau of China. J. Desert Res., 29(4): 734–743.
Wang CZ, Niu SJ, Wang LN, 2010. Variation features of sand-dust storms in the past 50a in China. J. Desert Res., 30(4): 933–939.
Wang JY, Wang SG, Ma Y,et al., 2007. The relations between sandstorms in spring in the north of China and climatic factors. J. Desert Res., 27(2): 296–300. DOI: 10.3321/j.issn:1000-694X.2007.02.022.
Wang MZ, Wei WS, Yang LM,et al., 2008. Analysis on the dynamic structure of circulations in the process of one east-coming sandstorm event in Tarim Basin. J. Desert Res., 28(2): 370–376.
Wang SG, Dong GR, 2000. The development of the study on sand-dust storms. J. Desert Res., 20(4): 349–356. DOI:10.3321/j.issn:1000-694X.2000.04.002.
Wang SG, Wang JY, Zhou ZJ,et al., 2003. Regional characteristics of sand-dust storms in China. J. Geog. Sci., 58(2): 193–200. DOI:10.3321/j.issn:0375-5444.2003.02.005.
Wei WS, Gao WD, Shi YG, 2004. Study on the effect of the climate and environment changes on sand-dust storms in Xinjiang.Arid Land Geography, 27(2): 138–141. DOI:10.3321/j.issn:1000-6060.2004.02.002.
Xu XH, 1997. Analysis and study on the satellite imagery of sand-dust storms in Tarim Basin. Research on Sand-Dust Storms in China.Meteorological Press, Beijing, pp. 88–91.
Zeng SL, Cheng YF, Wang SG,et al., 2010. Investigation on the inter-annual variations and the causes of spring sandstorms in the northwest and Inner Mongolia in China. J. Desert Res., 30(5):1200–1206.
Zheng XJ, 2004. Analysis on some characteristics of sand-dust weathers in Beijing region. Clim. and Env. Res., 9(1): 14–23. DOI:10.3969/j.issn.1006-9585.2004.01.003.
Zhou ZJ, 2001. Flying dust and sandstorm weathers in the last 45 years in China. Quaternary Sci., 21(1): 9–17. DOI:10.3321/j.issn:1001-7410.2001.01.002.
杂志排行

Sciences in Cold and Arid Regions的其它文章
- Status and prospects of frozen soil studies using CT technology
- A new MODIS daily cloud free snow cover mapping algorithm on the Tibetan Plateau
- Greenland Ice Sheet surface melt: A review
- Role of blowing snow in snow processes in Qilian Mountainous region
- Earthquakes as a potential contributing factor to climate change at multi-decadal scale
- Ecological adaptation of Reaumuria soongorica root system architecture to arid environments