丽江MS7.0地震余震深度揭示出的中地壳脆塑性转化特征
2014-07-02娟周永胜杨伟红
宋 娟周永胜杨伟红
1)中国石油大学(华东),青岛 266580
2)中国地震局地质研究所,地震动力学国家重点实验室,北京 100029
3)国土资源部中央地质勘查基金管理中心,北京 100045
丽江MS7.0地震余震深度揭示出的中地壳脆塑性转化特征
宋 娟1)周永胜2)*杨伟红3)
1)中国石油大学(华东),青岛 266580
2)中国地震局地质研究所,地震动力学国家重点实验室,北京 100029
3)国土资源部中央地质勘查基金管理中心,北京 100045
1996年丽江MS7.0地震的余震深度分布明显具有时间依赖性,主震发生后短时间内余震震源深度较深,随着时间的延续,余震震源深度变得越来越浅。余震的这种深度分布受地壳脆塑性转化带深度控制,而脆塑性转化带的深度变化与地震前后断层的应变速率有关。由震后GPS地表变形数据得到的地表变形模型表明,震后地表变形主要来自地壳深部,震后滑动与地壳深部弹性松弛有关。根据鲜水河断层地表的滑动数据和按Marone's(1991)给出的方程确定的震后滑动模型,估计的应变速率显示,主震发生后应变速率较高,随时间延续,应变速率逐渐下降。基于地壳P波速度结构和利用热流数据估计的丽江地区地壳温度,采用含水石英的塑性流变参数,估计了中地壳脆塑性转化带深度随震后应变速率的变化。结果表明,主震震源深度与余震深度分布下限与中地壳脆塑性转化带的深度随时间变化趋势一致。由于断层的震后快速滑动致使断层带深部具有很高的应变速率,高应变速率引起断层脆塑性转化带深度下移,主震之后短时间内发生了较深的余震;随着震后时间的延续,断层逐渐进入蠕变阶段,断层滑动速率逐渐减小,地壳应变速率逐渐降低,断层脆塑性转化带也逐渐恢复到间震期的深度,相应余震深度随之变化。因此,余震分布的深度变化是中地壳流变结构和脆塑性转化带深度变化的直接反映。
震源深度 余震 脆塑性转化带 流变 丽江MS7.0地震
0 引言
野外、实验和地震数据表明:浅部地壳变形以脆性破裂为主,深部地壳变形以晶体塑性流变为主,即地壳脆性摩擦-塑性流变二元结构,其中,根据Byerlee(1978)摩擦定律限定了中上地壳的脆性变形强度,根据稳态流变方程限定了下地壳塑性变形强度(Goetze et al.,1979;Brace et al.,1980;Sibson,1982;Kohlstedt et al.,1995;Bürgmann et al.,2008)。在脆性变形和晶体塑性流变之间存在脆塑性转化带,而且地壳脆塑性转化的深度与地震深度分布具有很好的一致性(Sibson,1982;Chen et al.,1983;Scholz,1988),显示地壳流变结构和脆塑性转化深度控制了地震的深度分布(Scholz,1988;Bokelmann et al.,2000;Schaff et al.,2002)。也有研究者认为断层从粘滑向稳滑转化控制着大震发生的深度(Tse et al.,1986;Li et al.,1987),只有余震发生的深度与脆塑性转化深度有关,余震分布下限发生在脆塑性转化带(Sibson,1982;Hobbs et al.,1986;Scholz,1988)。因此,余震深度的分布为我们提供了大量的地壳流变信息。另一方面,强震发生后,震后快速滑动和震后蠕变也为研究深部地壳塑性变形提供了条件。主震后的地表变形包含了浅部地壳弹性松弛和断层带的震后滑动(Shen et al.,1994;Savage et al.,1997;Bürgmann et al.,2002)两部分,它们都是地壳深部变形过程的直接体现(Savage,1990)。因此,根据余震分布深度变化可以限定脆塑性转化带的深度(Iio et al.,2003),而利用流变实验数据和震后蠕变可以反演断层带流变特征(Montesi et al.,2003;Ma et al.,2004)。
本文通过1996年2月3日丽江地震及其余震的深度分布、地壳脆塑性转化深度随断层滑动速率变化,讨论余震深度分布揭示出的地壳脆塑性转化深度随时间的变化特征。
1 丽江MS7.0地震的主震和余震深度分布特征
丽江MS7.0地震发生在1996年2月3日,主震及震后滑动阶段的余震深度的分布为我们研究地壳流变提供了条件。
由中国地震台网记录的丽江MS7.0地震及其余震震中分布见图1a,图中震后滑动阶段的余震是指从1996年2月3日至2003年3月30日期间发生的地震。主震发生在经度27.34°E,100.25°N,余震序列发生的位置在26.5°~27.7°E,100.0°~101.0°N,包括震级从MS2.0到MS6.0共182个余震(图1a)。1996年丽江MS7.0地震及其余震和丽江地震之前的地震(震级从MS3.0~4.7)的深度分布见图1b,震前的数据时间段从1990年初到主震发生前,所有地震的空间分布见图1a。如图1b所示,震源深度的分布具有明显的时间依赖性。丽江地震之前的23个震级在MS3.0~4.7的地震多数震源深度<15km。极少数地震震源深度>15km,在主震之后的短时间内发生了很多较深余震,震源深度达25~30km,震源深度远大于主震深度(10km),但随着时间延续,余震深度逐渐变浅。主震发生6a后(1996—2003年),余震深度接近主震的震源深度。
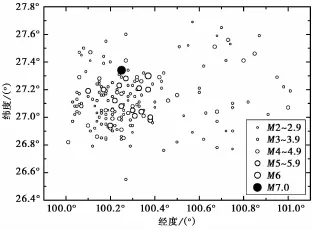
图1 a 1996年丽江MS7.0地震及其余震(1996-02-03—2003-03-30)震中分布图Fig.1 a The location of Lijiang MS7.0 earthquake and aftershock sequence from February 3,1996 to March 30,2003.
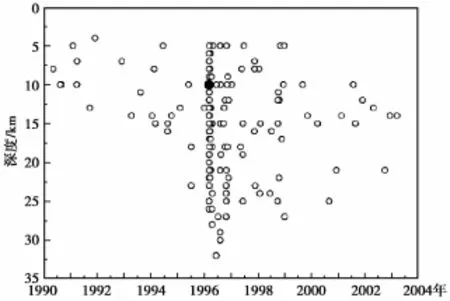
图1 b 1996年丽江MS7.0地震及其余震和丽江地震之前的地震震源深度分布图Fig.1 b Focal depth distribution of the main-shock and aftershocks of and the earthquakes before the 1996 Lijiang MS7.0 earthquake.
2 丽江地震引起的中地壳脆塑性转化深度变化
2.1 根据地表热流计算的丽江地区地壳温度剖面
根据在钻井内测得的丽江地区热流数据,利用热传导方程估计地壳温度。钻井的位置和地热参数见表1。丽江钻井的深度是350m,但温度测量是在30~150m距离内进行的,这个范围内主要岩石是二叠纪—三叠纪火山沉积岩,根据热流和温度剖面计算的此深度范围内地温梯度是19.8℃/km。从4个钻孔测得的热导率和热流值的平均值分别是(2.79±0.10)W/mk和(55.3±4.1)mW/m2,从11个岩心样品测得的产热量是1.05W/m3(汪辑安等,1990)。

表1 丽江地区地表热流数据Table 1 The heat flow data of Lijiang area
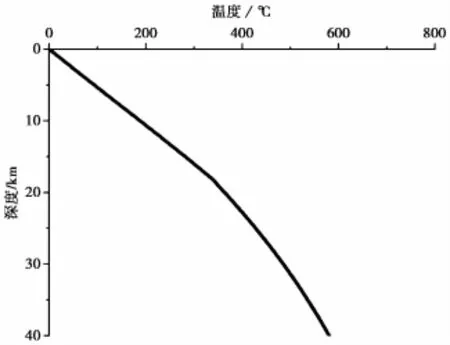
图2 丽江地区地壳温度剖面图Fig.2 The crustal temperature profile of Lijiang area.
熊绍柏等(1986)研究认为丽江地壳分为3层,深度为19km和37.5km的界面分别将地壳分为上地壳、中地壳和下地壳。上地壳的热导率和生热率使用的是汪集旸等(1990)所给研究数据,中地壳和下地壳的热导率和生热率来自汪洋(1999)和Hu(2000)的研究结果。我们利用Chapman(1986)的方法估计了地壳温度,其温度曲线如图2所示。
2.2 断层带震后形变的应变速率估计
主震后的地表变形包含了浅部地壳弹性松弛和断层带的震后滑动(Shen et al.,1994;Savage et al.,1997;Bürgmann et al.,2002)两部分,它们都是地壳深部变形过程的直接体现(Savage,1990)。多数震后地表变形是地壳弹性松弛。因此,可以根据主震后地表的变形数据估计地壳深部的应变速率。震后变形可以按Marone等(1991)给出的方程确定:

式(1)中:L是总变形量,t是大震发生后的时间,a,b,q是系数。
我们没有1996年MS7.0丽江地震的地表变形的数据,但可以根据1973年炉霍地震在1976—1990年观测得到的地表面变形数据(Bilham,1992)估计川滇地区地壳深部的应变速率。鲜水河断裂强震震后的地表总变形量随时间的变化如图3(实圆圈)所示,这些数据由方程(1)拟合得到的曲线见图3(实线)。与加利福尼亚1966年Parkfield地震和1992年Landers地震(Savage,1990)相比,发现鲜水河断层震后地表变形模型与Park field地震的震后地表变形(图3虚线)相似,但不同于1992年Landers地震的震后地表变形(图3点线),其中,主震发生后比较短的时间内,曲线比较陡,表明地表形变比较显著,随着时间延长,曲线逐渐变缓,显示地表形变减弱。Parkfeild地震震后地表变形和鲜水河断层的这种震后地表变形是由于地壳蠕变引起的。
如果丽江地震的震后地表变形模型与鲜水河断层震后滑动类似,也是由地壳蠕变引起的,则蠕变模型与鲜水河的蠕变相似。因此,可以利用鲜水河断层的地震得到的地表变形的数据估计丽江地震震后地表形变数据(图3实线),尽管它们不是同一个地震。
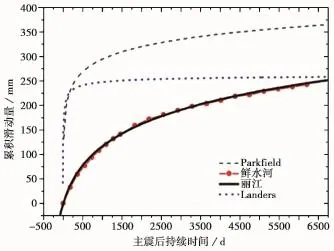
图3 根据鲜水河断层震后滑动估计的丽江地震震后地表变形Fig.3 The post-seismic deformation of the 1996 Lijiang MS7.0 earthquake.实圆圈:鲜水河断裂震后地表总变形量随时间的变化;实线:按方程(1)计算得到的丽江地震震后地表变量随时间的变化;虚线:Parkfeild地震震后地表变形量随时间的变化;点线:Landers地震震后地表变形量随时间的变化
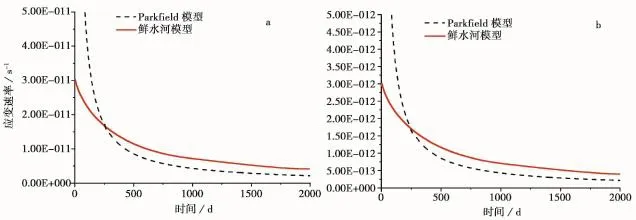
图4 丽江地震震后应变速率随时间的变化趋势Fig.4 The post-seism ic strain rate change with time.a给出应变速率的上限;b给出应变速率的下限
假定断层变形带主要分布在100m和1 000m的宽度,根据震后地表形变数据(图3),可以换算出断层带内的应变,以及应变随时间的变化率,即应变速率。图4给出了根据Parkfeild地震与鲜水河断层震后地表形变,估算的丽江地震震后应变速率随时间的变化趋势,其中图4a给出应变速率的上限,图4b给出应变速率的下限。这一结果显示,主震发生后,断层带深部的应变速率很高,达到3~5×10-11~12s-1,随着时间延长,应变速率逐渐降低到2× 10-12~13s-1。
2.3 中地壳的脆塑性转化深度随时间的变化规律
中地壳长英质岩石的塑性流变强度与石英的流变强度相同(周永胜等,2003)。因此,可以根据石英的流变参数(Gleason et al.,1995)、温度随深度分布曲线(图2)、应变速率随震后时间的变化曲线(图4),估计地壳脆塑性转化深度随时间的变化规律。
根据图4中的应变速率随时间变化规律,选取不同的应变速率上限和下限,计算脆塑性转化深度上限和下限。例如,在主震后短期内的应变速率为5×10-11~12s-1时,得到的脆塑性转化深度为23.8~31.3km(图5a);随着时间延长,应变速率逐渐降低到2× 10-11~12s-1时,脆塑性转化深度为16.5~19km(图5b);当应变速率降低到2×10-12~13s-1时,脆塑性转化深度为14.5~16.5km(图5c)。因此,随着震后地表形变减弱,应变速率降低,地壳脆塑性转化深度由深变浅。
3 丽江地震余震深度与脆塑性转化深度对比
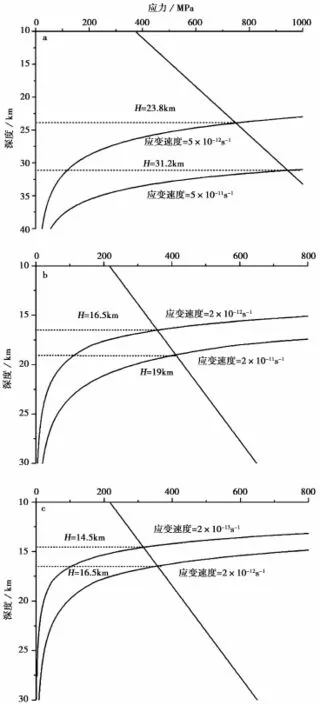
图5 丽江地区地壳脆塑性转化深度随时间的变化趋势Fig.5 The depth change of brittle-plastic transition due to the decreasing of post-seismic strain rate.
图5显示,脆塑性转化深度随时间逐渐变浅,从震后的23.8~31.3km至14.5~16.5km。图6给出脆塑性转化深度随时间变化的趋势,其中红色和蓝色点是根据图4应变速率随时间变化规律的上限与下限,分别计算得到的脆塑性转化深度上限与下限,红线和蓝线是基于这些变化点拟合的脆塑性转化深度随时间变化的曲线。曲线显示在主震发生后短时间内,脆塑性转化深度很深,但迅速变浅,然后随着时间继续缓慢变浅。显示主震和震后快速滑动阶段,中地壳原来发生塑性变形的区域,在短期内转化为脆性变形,即地震破裂向断层深部延伸。随着震后地表变形减弱,脆塑性转化趋于正常水平。
脆塑性转化深度的这种变化,与丽江MS7.0地震主震和余震深度分布规律非常相似,显示出二者之间的必然联系。但是部分余震仍处于图6给出的脆塑性转化点下面,而且同样有随着时间变浅的趋势。根据川滇地区地壳速度结构剖面和流变实验,给出的地壳流变结构剖面(周永胜等,2009)显示(图7),14~19km深度为酸性岩流变,与图6中给出的脆塑性转化对应。19~38km为中性岩脆塑性转化与塑性流变层。由此推测,这些在20km以下的余震,可能发生在中性岩中,而且余震深度随时间变化的趋势,应该受中性岩脆塑性转化深度随时间变化控制。
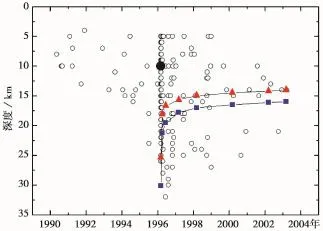
图6 主震和余震深度分布及震后脆塑性转化深度随时间的变化趋势Fig.6 Comparison of the focal depth distribution of main-shock and aftershocks with the depth change of brittle-plastic transition in the postseismic period.红线:脆塑性转化的上限,蓝线:脆塑性转化的下限
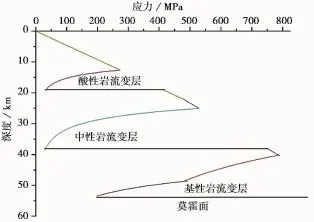
图7 川滇地区地壳流变结构剖面图(周永胜等,2009)Fig.7 The rheological structure of crust in Sichuan-Yunnan region(after ZHOU Yong-sheng et al.,2009).
显然,余震深度分布变化是中地壳流变结构和脆塑性转化带深度变化的直接反映,而脆塑性转化是余震深度变化的原因。地震断层在强震孕育不同阶段,其应变速率都会发生变化,从而引起脆塑性转化深度的变化。在间震期,应变速率比较低,脆塑性转化深度比较浅,在同震加载和震后快速滑动阶段,应变速率比较高,脆塑性转化深度增加。由应变速率的这种变化引起的脆塑性转化得到地质证据和实验证据支持(Trepmann et al.,2001,2002,2003,2007;张媛媛等,2012;韩亮等,2013)。
4 结论
1996年丽江MS7.0地震的余震深度分布表明,主震发生后短时间内余震震源深度较深,随着时间的延续,余震震源深度变得越来越浅。根据震后滑动模型和断层地表的滑动数据,估计的应变速率显示,主震发生后应变速率较高,随时间延续,应变速率逐渐下降。基于应变速率随时间的变化特征,估计的中地壳脆塑性转化带深度随地震后应变速率的变化表明,主震震源深度与余震深度分布下限与中地壳脆塑性转化带的深度随时间变化趋势一致。主震发生后,断层的震后快速滑动致使断层带深部具有很高的应变速率,引起断层脆塑性转化带深度下移;随着震后时间的延续,断层逐渐进入蠕变阶段,断层滑动速率逐渐减小,地壳应变速率逐渐降低,断层脆塑性转化带也逐渐恢复到间震期的深度。因此,余震分布的深度变化是中地壳流变结构和脆塑性转化带深度变化的直接反映。
致谢 感谢审稿专家对本文提出的有益修改建议。
韩亮,周永胜,姚文明.2013.中地壳断层带内微裂隙愈合与高压流体形成条件的模拟实验研究[J].地球物理学报,56(1):91—105.doi:10.6038/cjg2013110.
HAN Liang,ZHOU Yong-sheng,YAO Wen-ming.2013.A simulating experimental study on crack healing and the formation of high pore fluid pressure in faults of middle crust[J].Chinese JGeophysics,56(1):91—105(in Chinese).
汪缉安,徐青,张文仁.1990.云南省热流数据和一些地热问题[J].地震地质,12(4):367—377.
WANG Ji-an,XU Qing,ZHANG Wen-ren.1990.Heat flow data and some geologic geothermal problems in Yunnan Province[J].Seismology and Geology,12(4):367—377(in Chinese).
汪集旸,黄少鹏.1990.中国大陆地区大地热流数据汇编(第二版)[J].地震地质,12(4):351—366.
WANG Ji-yang,HUANG Shao-peng.1990.Collection of heat flow data in China continental region(Second edition)[J].Seismology and Geology,12(4):351—366(in Chinese).
汪洋.1999.中国大陆大地热流分析[D].[学位论文].北京:中国科学院地质研究所.
WANG Yang.1999.An analysis for the continental heat flow in China[D].Ph D Thesis.Institute of Geology,Chinese Academy of Sciences,Beijing(in Chinese).
熊绍柏,滕吉文,尹周勋,等.1986.攀西构造带南部地壳与上地幔结构的爆炸地震研究[J].地球物理学报,29(3):235—244.
XIONG Shao-bai,TENG Ji-wen,YIN Zhou-xun,et al.1986.Explosion seismological study of the structure of the crust and uppermantle at southern part of the Panxi tectonic belt[J].Chinese JGeophysics,29(3):235—244(in Chinese).
张媛媛,周永胜.2012.断层脆塑性转化带的强度与变形机制及其流体和应变速率的影响[J].地震地质,34(1):172—194.doi:10.3669/j.issn.0253-4967.2012.01.016.
ZHANG Yuan-yuan,ZHOU Yong-sheng.2012.The strength and deformation mechanisms of brittle-plastic transition zone,and effects of strain rate and fluid[J].Seismology and Geology,34(1):172—194(in Chinese).
周永胜,何昌荣.2003.地壳主要岩石流变参数及华北地壳流变性质研究[J].地震地质,25(1):109—122.
ZHOU Yong-sheng,HE Chang-rong.2003.Rheological parameter of crustal rocks and crustal rheology of North China[J].Seismology and Geology,25(1):109—122(in Chinese).
周永胜,何昌荣.2009.汶川地震区的流变结构与发震高角度逆断层滑动的力学条件[J].地球物理学报,52(2):474—484.
ZHOU Yong-sheng,HE Chang-rong.2009.The rheological structures of crust and mechanics of high-angle reverse faultslip for Wenchuan MS8.0 earthquake[J].Chinese JGeophysics,52(2):474—484(in Chinese).
Bilham R.1992.Sinestral creep on the Xianshuihe Fault at Xialatuo in the 17 years following the 1973 Luhuo earthquake[A].In:Proc PRC-USBilateral Symposium on the Xianshuihe Fault Zone,October 1990,Chengdu,China.Seismological Press,Beijing.226—231.
Bokelmann G H R,Beroza G C.2000.Depth-dependent earthquake focalmechanism orientation:Evidence for a weak zone in the lower crust[J].JGeophy Res,105(B9):21683—21695.
Bürgmann R,Ergintav S,Segall P,et al.2002.Time-dependent distributed afterslip on and deep below the Izm it earthquake rupture[J].Bulletin of the Seismological Society of America,92(1):126—137.
Bürgmann R,Dresen G,2008.Rheology of the lower crust and uppermantle:Evidence from rock mechanics,geodesy and field observations[J].Annu Rev Earth Planet Sci,36:531—561.
Brace W T,Kohlstedt D L.1980.Limits on lithospheric stress imposed by laboratory experiments[J].JGeophy Res,85:6248—6252.
Byerlee JD.1978.Friction of rocks[J].Pure Appl Geophys,116:615—626.
Chen W P,Molnar P.1983.Focal depths of intracontinental and intraplate earthquake and their relation for thermal and mechanical properties of the lithosphere[J].JGeophy Res,88:4183—4214.
Chapman D S.1986.Thermal gradients in the continental crust[A].In:Dawson J B ed.The Nature of the Lower Continental Crust.Geological Society Special Publication,24:63—70.
Gleason G C,Tullis J.1995.A flow law for dislocation creep of quartz aggregates determined with the molten salt cell[J].Tectonophysics,247:1—23.
Goetze C,Evans B.1979.Stress and temperature in the bending lithosphere as constrained by experimental rock mechanics[J].Geophys JR Astr Soc,59:463—478.
Hobbs B E,Ord A,Teyssier C.1986.Earthquakes in the ductile regime?[J].Pure Appl Geophys,124:309—336. Hu S,He L,Wang J.2000.Heat flow in the continental area of China:A new data set[J].Earth and Planetary Science Letters,179:407—419.
Iio Y,Kobayashi Y.2003.Is the plastic flow uniform ly distributed below the seismogenic region?[J]Tectonophysics,364:43—53.
Kohlstedt D L,Evans B,Mackwell S J,et al.1995.Strength of the lithosphere:Constraints imposed by laboratory experiments[J].JGeophys Res,100:17587—17602.
Li K K,Rice JR.1987.Crustal deformation in great California earthquake cycles[J].JGeophy Res,92:11533—11551.
Ma K F,Song T R A.2004.Thermo-mechanical structure beneath the young orogenic belt of Taiwan[J]. Tectonophysics,388:21—31.
Marone C J,Scholz C H,Bilham R.1991.On the mechanics of earthquake afterslip[J].JGeophys Res,96:8441—8452.
Montesi L G J,Hirth G.2003.Grain size evolution and the rheology of ductile shear zones:From laboratory experiments to postseism ic creep[J].Earth and Planetary Science Letters,211(1-2):97—110.
Savage JC.1990.Equivalent strike-slip earthquake cycles in half-space and lithosphere-asthenosphere earth models[J].JGeophys Res,95:4873—4879.
Savage JC,Svarc JL.1997.Postseismic deformation associated with the 1992 MW7.3 Landers earthquake,southern California[J].JGeophys Res,102:7565—7577.
Schaff D P,Bokelmann G H R,Beroza G C,et al.2002.High-resolution image of Calaveras Fault seismicity[J].J Geophys Res,107(B9):2186.
Scholz C H.1988.The brittle-plastic transition and depth of seism ic faulting[J].Geol Rund,77:319—328.
Shen Z K,Jackson D D,Feng Y,et al.1994.Postseismic deformation following the Landers earthquake,California,28 June 1992[J].Bull Seism Soc Am,84:780—791.
Sibson R H.1982.Fault zone models,heat flow,and the depth distribution of earthquakes in the continental crust of the United States[J].Bull Seismol Soc Am,72:151—163.
Trepmann C A,Stöckhert B.2001.Mechanical twinning of jadeite-An indication of synseismic loading beneath the brittle-plastic transition[J].Int JEarth Sciences(Geol Rundsch),90:4—13.
Trepmann C A,Stöckhert B.2002.Cataclastic deformation of garnet:A record of synseismic loading and postseismic creep[J].JStuct Geol,24:1845—1856.
Trepmann C A,Stöckhert B.2003.Quartz m icrostructures developed during non-steady state plastic flow at rapidly decaying stress and strain rate[J].JStuct Geol,25(12):2035—2051.
Trepmann C A,Stöckhert B,Dorner D,et al.2007.Simulating coseismic deformation of quartz in themiddle crust and fabric evolution during postseismic stress relaxation-An experimental study[J].Tectonophysics,442:83—104. Tse S T,Rice J R.1986.Crustal earthquake instability in relation to the depth variation of frictional slip properties[J].JGeophys Res,91:9452—9472.
Wang Y,Wang J,Xiong L.2000.Heat flow pattern in the mainland of China and its geodynamic significance[J]. Acta Geologica Sinica,74(2):375—380.
TEM PORAL EVOLUTION OF FOCAL DEPTHS OF AFTERSHOCK SEQUENCE FOLLOW ING LIJIANG MS7.0 EARTHQUAKE AND THE IM PLICATION FOR RHEOLOGICAL PROPERTY OF THE M IDDLE CRUST
SONG Juan1)ZHOU Yong-sheng2)YANG Wei-hong3)
1)China University of Petroleum,Qingdao 266580,China
2)State key Laboratory of Earthquake Dynamics,Institute of Geology,China Earthquake Adm inistration,Beijing 100029,China
3)Central Geological Exploration Fund,M inistry of Land and Resources,Beijing 100045,China
The depth distribution of aftershocks of the 1996 Lijiang MS7.0 earthquake is strongly timedependent.Events occurring shortly after the main shock had deeper focal depths,and as the time going on,the focal depth of the aftershocks became shallower and shallower,i.e.the cutoff depth of seism icity became shallower and shallower with time.As we know,the lowermost events occur around the depth of brittle-plastic transition,and this depth depends on strain rate.The postseismic deformation model inferred from GPS data show that the major contribution of postseism ic strain release comes from the lower layer of the crust.These results suggest that significant afterslip is related to viscous relaxation of lower layer.
We estimated the lower bound of the strain rate according to Marone′s et al.(1991)afterslip model and the slip data observed at the surface of Xianshuihe Fault.The results show that the strain rate is high after the main shock,and decreases gradually with time.We calculated the strength profile of m iddle crust based on flow law of wet quartz,estimated strain rate,temperature profile determined using the heat flow data at Lijiang,as well as crustal structure based on P wave velocity. By comparing the cutoff depth of seism icity and the brittle-plastic transition depth of them idd le crust,we found the two depths are consistent to each other.We suggest the temporary existence of deeper small events after main shock and the depth distribution of aftershock is due to the changing brittleplastic transition of the middle crust corresponding to strain rate variation from high to lower values after the main shock,and this kind of change is the manifestation of rheology of the m iddle crust.
focal depth,aftershock,brittle-plastic transition,rheology,Lijiang MS7.0 earthquake
315.2
A
0253-4967(2014)01-0186-10
宋娟,女,1975年生,2004年毕业于中国地震局地质研究所固体地球物理专业,获硕士学位,讲师,主要从事高温高压岩石力学与流变学及与地震学相关的教学和研究工作,电话:18669880408,E-mail:songjuan95@126.com。
10.3969/j.issn.0253-4967.2014.01.015
2013-04-08收稿,2013-11-04改回。
地震动力学国家重点实验室自主课题(LED2010B03,LED2013A05)资助。*通讯作者:周永胜,男,研究员,E-mail:zhouysh@ies.ac.cn。
