Finite element analysis of stress and strain distributions in mortise and loose tenon furniture joints
2014-06-19MohammadDerikvandGhanbarEbrahimi
Mohammad Derikvand • Ghanbar Ebrahimi
Finite element analysis of stress and strain distributions in mortise and loose tenon furniture joints
Mohammad Derikvand • Ghanbar Ebrahimi
We studied the effect of loose tenon dimensions on stress and strain distributions in T-shaped mortise and loose tenon (M<) furniture joints under uniaxial bending loads, and determined the effects of loose tenon length (30, 45, 60, and 90 mm) and loose tenon thickness (6 and 8 mm) on bending moment capacity of M< joints constructed with polyvinyl acetate (PVAc) adhesive. Stress and strain distributions in joint elements were then estimated for each joint using ANSYS finite element (FE) software. The bending moment capacity of joints increased significantly with thickness and length of the tenon. Based on the FE analysis results, under uniaxial bending, the highest shear stress values were obtained in the middle parts of the tenon, while the highest shear elastic strain values were estimated in glue lines between the tenon surfaces and walls of the mortise. Shear stress and shear elastic strain values in joint elements generally increased with tenon dimensions and corresponding bending moment capacities. There was consistency between predicted maximum shear stress values and failure modes of the joints.
bending moment capacity, failure mode, finite element, furniture, mortise and loose tenon joint; stress and strain distributions
Introduction
Finite element analysis (FEA) is among the most effective numerical and computer-based techniques used for analyzing and solving a variety of complex problems of engineering, including physical phenomena in the field of structural, solid, and fluid mechanics (Mackerle 2005; Çolakoğlu and Apay 2012). Various studies used the finite element (FE) technique on wooden structures as well as furniture using FE modeling (Smardzewski and Prekrat 2002; Smardzewski and Papuga 2004; Smardzewski and Ożarska 2005; Kasal 2006; Koç et al. 2011; Demirci 2011; Çolakoğlu and Apay 2012; Mohamadzadeh et al. 2012; Smardzewski 2012). Smardzewski and Papuga (2004) studied the stress distribution in mortise and tenon and double-dowel joints of skeleton furniture using the FE method. They demonstrated that the values of normal stresses directly affect the strength of construction nodes of skeleton furniture. Çolakoğlu and Apay (2012) investigated the strength of a wooden chair constructed of three different wood species in free drop by ANSYS FE software. They concluded that, in order to develop the design of furniture and its packaging, the drop of furniture can be simulated by using FE software, such as ANSYS, for performance testing of packaged or unpackaged furniture. Mohamadzadeh et al. (2012) indicated that FE models yield beneficial information, including the location of damage initiation in composite joints. The stress on critical components that caused the failure can be tabulated and recognized using corresponding failure criteria and this is not possible in experimental studies.
Our aim was to determine the effect of loose tenon dimensions on stress and strain distributions in T-type mortise and loose-tenon (M<) furniture joints. In the first step, we experimentally determined the effects of tenon length and tenon thickness on bending moment capacity of M< joints. Then, we used ANSYS FE software to estimate the stress and strain distributions in the joint elements with varying thicknesses and lengths of tenons. We compared both results from experiment tests and FE models
Materials and methods
M< joint specimens
Eastern beech (Fagus orientalis L.), with 12% moisture content, was utilized in constructing T-type M< joint specimens used in the study (Fig. 1).Tenon were 6- and 8-mm, while tenon lengths were 30, 45, 60, and 90 mm. Tenon width was constantat 50 mm for all joint specimens. Clearance of 0.05 mm was allowed between tenons and mortise walls, while the clearance between the bottom of the mortise and the end of the tenon was a nominal 0.125 mm (Derikvand et al. 2013). Totally, 40 M< joint specimens [2 (tenon thicknesses) × 4 (tenon lengths) × 5 (replicates)] were constructed using polyvinyl acetate (PVAc) adhesive (60%). Prior to performing the tests, the joint specimens were conditioned at 20°C±2°C and relative humidity of 65%±3% for three weeks (Derikvand et al. 2013; Maleki et al. 2012).

Fig. 1: Geometry and dimensions (mm) of T-type M< joint specimens
Testing
Tests were performed on an Instron (4486) testing machine with a loading velocity of 5 mm⋅min-1(Fig. 2). Bending moment capacities of the joints were estimated by Equ. 1:

where, M is bending moment capacity (N⋅m), F is the maximum applied load (N), and L is the moment arm, 0.35 m.

Fig. 2: Method of loading used to evaluate bending moment capacity of joint specimens
FE models
After performing the laboratory tests, 3-dimensional models of T-type M< joints with different tenon dimensions were constructed in the DesignModeler environment of ANSYS Workbench v.14 finite element software. The following actions were:
(1) The properties of joint members and PVAc glue were defined as orthotropic and isotropic materials, respectively (Table 1).

Table 1: Technical properties of oriental beech (Fagus orientalis L.) and PVAc adhesive used in the FEA.
(2) Twenty-node hexahedral elements were applied to the FE models (Fig. 3). The horizontal and vertical members of joints were meshed with 3 mm hexahedral elements. To increase the reliability of analysis, 1 mm hexahedral elements were applied to the tenon and glue line.
(3) Based on the experimental results of ultimate bending moment capacities of joints, maximum force values required for loading of each joint were calculated by Equ. 2:

where F is the required load value (N); M is calculated bending moment capacity (N⋅m); and L is the moment arm (0.35 m).
After defining the loading type characteristics, loading direction, and other boundary conditions, we recorded outputs of FE models, including maximum shear stress and shear elastic strain values in joint members.

Fig. 3: Standard 20-node hexahedral element
Data evaluation
Analysis of variance (ANOVA) was applied to quantify differences between mean values for variables.
Results
Modulus of failures of joint specimens
For the joints with 30 mm length tenons, most failures occurred in the glue line of joints. However, along with increase in tenon length from 30 to 90 mm, for both 6 and 8 mm tenon thicknesses, failures occurred mostly in tenons (Fig. 4).

Fig. 4: Tenon fracture in a test joint with tenon thickness of 6 mm and tenon length of 90 mm
Bending moment capacity of tested joints
Average bending moment capacities of joints under uniaxial bending load are shown in Fig. 5.
Bending moment capacities of the tested joints varied significantly between groups in terms of thickness and length of tenons (Table 2). However, the interaction effect between thickness and length of the tenon was not statistically significant (p >0.05).

Fig. 5: Average bending moment capacity of joint specimens

Table 2: Results of ANOVA related to bending moment capacity of M< joints
The highest bending moment capacity (518.93 Nm) was recorded for joints with tenon length of 90 mm and tenon thickness of 8 mm, while the lowest bending moment capacity (181.62 Nm) was obtained in joints that had tenons of 30 mm length and 6 mm thickness. Bending moment capacity of joints with tenon thickness of 6 mm increased by approximately 106% with increase in tenon length from 30 to 90 mm. In addition, for joints with 8 mm thick tenons, bending moment capacity increased by 107% with increase in tenon length from 30 to 90 mm. The increase of tenon thickness from 6 to 8 mm yielded increased bending moment capacity by 36.6%.
Stress and strain distributions in joint elements
Based on the results obtained from FEA, under uniaxial bending load, the horizontal member of the joint moved along the negative direction of the Y-axis (loading direction). Affected by this displacement, the horizontal member separated from the vertical member at the top corner of the joint (Fig. 6). Accordingly, an increasing bending moment occurred at the joint under loading. In this situation, under different bending loads, maximum stress values occurred in the middle parts of the tenon (Fig. 7). For the joints with tenon thickness of 6 mm and tenon lengths of 30, 50, 60, and 90 mm, shear stress values in middle parts of the tenon were 27.09, 44.49, 72.52, and 87.98 MPa, respectively (Fig. 8). With increase in tenon thickness from 6 to 8 mm, along with increase of bending moment capacity of joints, shear stress values in the tenon increased for all joint combinations (Fig. 8). The highest shear stress value (110 MPa) was obtained in the middle parts of joints with tenon thickness of 8 mm and tenon length of 90 mm. Average value of shear stress in joints with 8 mm tenon thickness (70.97 MPa) was approximately 22% higher than for joints with 6 mm tenon thickness (58.02 MPa). Maximum shear elastic strain values in middle parts of the tenon in the joints with 6 mm tenon thickness and tenon lengths of 30, 50, 60, and 90 mm were 0.007, 0.011, 0.016, and 0.018, respectively. For joints with 8 mm tenon thickness and 30, 50, 60, and 90 mm tenon length, maximum shear elastic strain values in middle parts of the tenon were 0.009, 0.012, 0.018, and 0.022, respectively. Horizontal member Separation
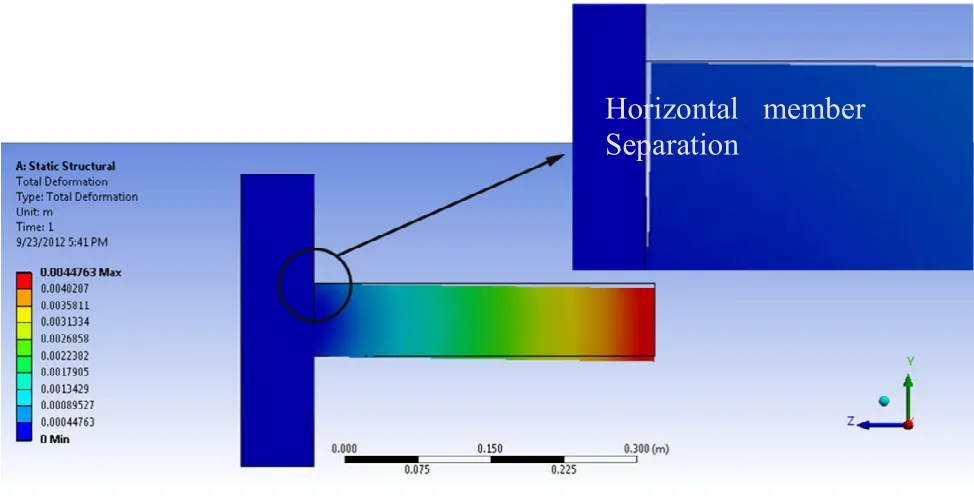
Fig. 6: Total deformation of M< joint with tenon thickness of 8mm and tenon length of 90 mm under loading
Highest shear elastic strain values were recorded in the glue line between the tenon and walls of the mortise (Fig. 9). Shear elastic strain values in the glue line increased with increasingthickness and length of tenons (Fig. 10). The maximum shear elastic strain values in the glue line of joints with 6 mm tenon thickness and tenon lengths of 30 and 50 mm were higher than those of similar joints with 8 mm tenon thickness (Fig. 10). For joints with 8 mm tenon thickness and 60 and 90 mm length tenons, the maximum shear elastic strain values were greater than for joints with 6 mm tenon thickness and tenon lengths of 60 and 90 mm.
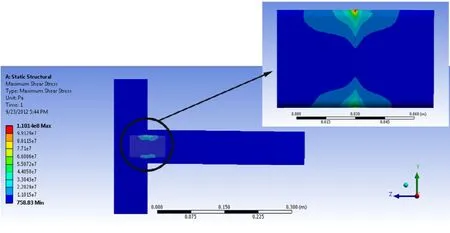
Fig. 7: Shear stress distribution in M< joint with tenon thickness of 8mm and tenon length of 90 mm
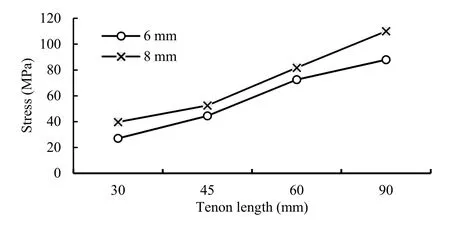
Fig. 8: Maximum shear stress values in the middle parts of tenon
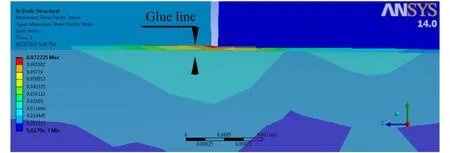
Fig. 9: Shear elastic strain distribution in glue line of M< joint with tenon thickness of 8mm and tenon length of 90 mm

Fig. 10: Maximum shear elastic strain values in the glue line of M< joint specimens
Discussion
The bending moment capacity of joints increased significantly with increasing length and thickness of tenons. Increase in total glued area of the tenon and its increasing impact on joint strength was one reason for this result. Along with increase in tenon dimensions and corresponding bending moment capacity, shear stress and shear elastic strain values in joint elements increased. Maximum shear stress values were recorded in the middle parts of tenons, while the highest shear elastic strain values were recorded in the glue line between the tenon surfaces and walls of the mortise. The results of FE models in this study are in agreement with results obtained by Smardzewski and Papuga (2004) for stress distributions in single mortise and tenon joints. However, some of the stress values predicted by FE models in this study exceed allowable values for shear strength of wood. These unusual values can be explained by failure modes of the joints. During the laboratory tests, most fractures occurred in the tenon apart from the adhesive line. Accordingly, since the highest shear stress values were obtained in the middle parts of tenons, it can be said that those stress values of joints predicted by FE models that exceeded the allowable shear strength of the wood indicate failure areas of the joints. Similar results were obtained by Mohamadzadeh et al. (2012) for failure modes of screwed single shear joints in wood plastic composite, and Demirci (2011) for various frame-type furniture corner joints.
Conclusions
We studied the effects of loose tenon length and loose tenon thickness on bending moment capacity of M< joints and corresponding stress-strain distribution in the joint elements, and experimentally investigated bending moment capacities of the joints, while using the FEA technique to determine the stress and strain distributions in the joint element.
We conclude:
(1) Dimensions of the loose tenon showed significant impacts on bending moment capacity of M< T-type joints.
(2) Bending moment capacity of M< joints increased with increasing thickness and length of loose tenons.
(3) Under uniaxial bending load, the highest stress values were in the middle parts of the loose tenon.
(4) Maximum shear elastic strain values were in the glue line between the loose tenon and walls of the mortise.
(5) Increase in tenon dimensions and corresponding bending moment capacity caused increase of shear stress and shear elastic strain values in M< joint elements.
(6) There was consistency between values predicted by FE models for maximum shear stress and failure modes of joints in laboratory tests.
(7) The FEA technique showed good potential for predicting the failure modes of furniture joints.
Çolakoğlu MH, Apay AC. 2012. Finite element analysis of wooden chair strength in free drop. International Journal of the Physical Sciences, 7(7): 1105-1114.
Demirci Hİ. 2011. The experimental and finite element analysis of diagonal tensile tests conducted on frame-type constructed corner joints. Technology, 14(1): 11-21.
Derikvand M, Smardzewski J, Ebrahimi GH, Dalvand M, Maleki S. 2013. Withdrawal force capacity of T-type mortise and loose tenon furniture joints. Turkish Journal of Agriculture and Forestry, 37: 377-384.
Gawroński T. 2006. Rigidity-strength models and stress distribution in housed tenon joints subjected to torsion. Electronic Journal of Polish Agricultural Universities, Wood Technology, 9(4).
Kasal A. 2006. Determination of the strength of various sofa frames with finite element analysis. GUJS, 19(4): 191-203.
Koç KH, Kizilkaya K, Erdinler ES, Korkut DS. 2011. The use of finite element method in the furniture industry. African Journal of Business Management, 5(3): 855-865.
Mackerle J. 2005. Finite element analyses in wood research: a bibliography. Wood Science and Technology, 39: 579-600.
Maleki S, Derikvand M, Dalvand M, Ebrahimi G. 2012. Load carrying capacity of mitered furniture corner joints with dovetail keys under diagonal tension load. Turkish Journal of Agriculture and Forestry, 36: 636-643.
Mohamadzadeh M, Rostampour Haftkhani A, Ebrahimi G, Yoshihara H. 2012. Numerical and experimental failure analysis of screwed single shear joints in wood plastic composite. Materials & Design, 35: 404-413.
Smardzewski J. 2012. Auxetic springs for seating. Turkish Journal of Agriculture and Forestry, 37: 369-376.
Smardzewski J, Ożarska B. 2005. Rigidity of cabinet furniture with semi-rigid joints of the confirmat type. Electronic Journal of Polish Agricultural Universities, Wood Technology, 8(2).
Smardzewski J, Papuga T. 2004. Stress distribution in angle joints of skeleton furniture. Electronic Journal of Polish Agricultural Universities, Wood Technology, 7(1).
Smardzewski J, Prekrat S. 2002. Stress distribution in disconnected furniture joints. Electronic Journal of Polish Agricultural Universities, Wood Technology, 5(2).
2013-01-18; Accepted: 2013-05-29
DOI 10.1007/s11676-014-0507-5
The online version is available at http://www.springerlink.com
Mohammad Derikvand (), Ghanbar Ebrahimi
Department of Wood and Paper Science and Technology, College of Agriculture and Natural Resources, University of Tehran, Karaj, 31587-77878, Iran.
Tel.: +98 935 100 6032, +98 261 224 9311, Fax: +98 261 224 9311
E-mail: m.derikvand@ut.ac.ir and ronashmd@yahoo.com
Corresponding editor: Yu Lei
© Northeast Forestry University and Springer-Verlag Berlin Heidelberg 2014
杂志排行
Journal of Forestry Research的其它文章
- Effects of shifting cultivation on biological and biochemical characteristics of soil microorganisms in Khagrachari hill district, Bangladesh
- An integrated method for matching forest machinery and a weight-value adjustment
- The in fl uence of silane coupling agent and poplar particles on the wettability, surface roughness, and hardness of UF-bonded wheat straw (Triticum aestivum L.)/poplar wood particleboard
- Effects of plant growth regulators, carbon sources and pH values on callus induction in Aquilaria malaccensis leaf explants and characteristics of the resultant calli
- Changes induced by osmotic stress in the morphology, biochemistry, physiology, anatomy and stomatal parameters of almond species (Prunus L. spp.) grown in vitro
- Effects of gaps on regeneration of woody plants: a meta-analysis
