Numerical predictions of pressure pulses in a Francis pump turbine with misaligned guide vanes*
2014-06-01XIAOYexiang肖业祥WANGZhengwei王正伟ZHANGJin张瑾LUOYongyao罗永要
XIAO Ye-xiang (肖业祥), WANG Zheng-wei (王正伟), ZHANG Jin (张瑾), LUO Yong-yao (罗永要)
State Key Laboratory of Hydroscience and Engineering and Deparment of Thermal Engineering, Tsinghua University, Beijing 100084, China, E-mail: xiaoyex@mail.tsinghua.edu.cn
Numerical predictions of pressure pulses in a Francis pump turbine with misaligned guide vanes*
XIAO Ye-xiang (肖业祥), WANG Zheng-wei (王正伟), ZHANG Jin (张瑾), LUO Yong-yao (罗永要)
State Key Laboratory of Hydroscience and Engineering and Deparment of Thermal Engineering, Tsinghua University, Beijing 100084, China, E-mail: xiaoyex@mail.tsinghua.edu.cn
(Received June 7, 2013, Revised August 5, 2013)
Previous experimental and numerical analyses of the pressure pulse characteristics in a Francis turbine are extended here by using the unsteady Reynolds-averaged Navier-Stokes equations with the shear stress transport (SST) turbulence model to model the unsteady flow within the entire flow passage of a large Francis pump turbine with misaligned guide vanes at the rated rotational speed. The S-curve characteristics are analyzed by a combined use of the model test and the steady state simulation with the aligned guide vane firstly. Four misaligned guide vanes with two different openings are chosen to analyze the influence of pressure pulses in the turbine. The characteristics of the dominant unsteady flow frequencies in different parts of the pump turbine for various misaligned guide vane openings are investigated in detail. The predicted hydraulic performance and the pressure fluctuations show that the misaligned guide vanes reduce the relative pressure fluctuation amplitudes in the stationary part of the flow passage, but not the runner blades. The misaligned guide vanes have changed the low frequencies in the entire flow passage with the change of the pulse amplitudes mainly due to changes in the rotor-stator interaction and the low frequency vortex rope flow behavior.
pump turbine, misaligned guide vanes, pressure pulsation, rotor stator interaction, numerical simulation
Introduction
The development of pumped storage plants in China has promoted studies of the stability of pump turbine units. The hydraulic interactions between the runner blades and the guide vanes are a well-known cause of vibrations and noises in pump turbines[1]. Misaligned guide vanes were originated from an incident involving wicket gates in the Vianden 10 power station in 1973, which could turn freely and were different from those usual wicket gates in the opening. A series of model tests on these devices were carried out in Norway[1]. Misaligned guide vanes are used in pump turbines and also in many pump storage plants in China to improve the stability in the no-load mode and the turbine startup mode, to eliminate vibrations, to improve the S-curve characteristics and to cut down the surge pressure raises under the turbine load-rejections, such as in the Tianhuangping, Zhanghewan and Heimifeng stations. Therefore, it is necessary to clarify the influence of the MGV on the internal flow mechanism and performance changes.
The application of misaligned guide vanes in pump storage turbines has promoted hydrodynamics researches of the RSI between the misaligned guide vanes and the runner[2,3]. The rotor stator interactions (RSI) involve a combination of the effects of the viscous flow, the wake, and the structures[4-6]. Recently, notable effort was focused on the RSI and the low frequency vortex rope in the draft tube in pump turbines[7]. Misaligned guide vanes improve the pump turbine stability in the no-load and turbine startup modes and reduce the pressure surges during turbine load-rejections[8]. Experimental and numerical studies were carried out for the MGV devices. Billdal and Wedmark[9]used the MGV to overcome difficulties with aligned guide vanes and to obtain a stable speed after the load rejection experimentally. Qian et al.[10]analyzed the influence of misaligned guide vanes onthe pressure oscillations inside a Francis turbine experimentally and numerically, and it is found that the new rotor-stator interaction between the MGV and the runner increases the high-frequency pressure pulsation in the guide and spiral casing. Xiao et al.[11-13]pointed out that the vane MGV can be used to avoid the influence of the S characteristics under a steady flow. Xiao et al.[14]simulated the unsteady flow behavior and the pressure pulse changes of a pump-turbine with the MGVs at the rated speed.
The pump turbine vibration mechanisms with misaligned guide vanes need to be studied in order to improve the S-curve characteristics, the hydraulic performance and the operating stability of pump turbines. This paper combines model tests with numerical simulations to analyze the S characteristics of a pump-turbine with aligned guide vanes firstly. The misaligned guide vanes would influence the pressure pulses in various turbine modes, which is then investigated to enable more applications of misaligned guide vanes in pump turbines. Previous numerical and experimental studies of the pressure pulse characteristics and the unsteady flow behavior in a large Francis turbine are extended here to studies of 3-D flow mechanisms in a pump turbine[15,16]. This study focuses on the characteristics of the dominant unsteady flow frequencies in the entire flow passage of the pump turbine for various misaligned guide vane openings.
1. Prototype pump turbine
The Francis pump turbine under consideration has a runner of 3.9 m in diameter. The turbine mode design water head H is 500 m for the turbine of 7 runner blades, 20 stay vanes and 20 guide vanes. The rotational speed is 500 rpm. The computed flow domain includes the entire turbine flow passage as shown in Fig.1.
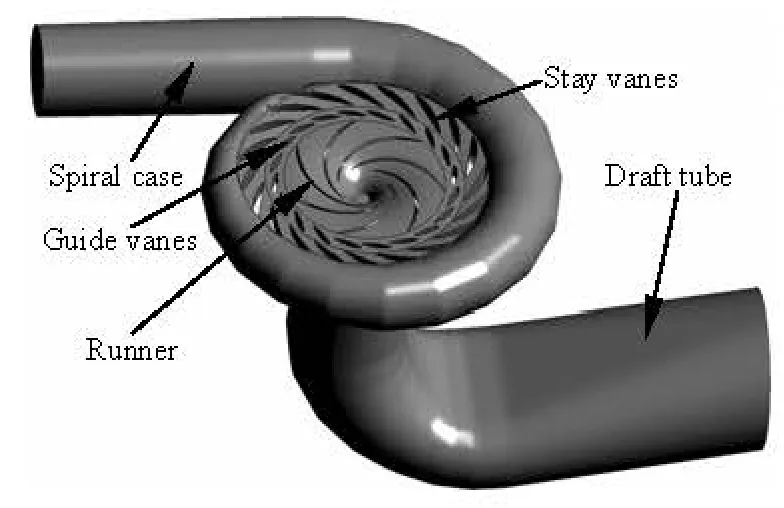
Fig.1 The flow passage of a prototype Franceis pump turbine
The positions of the four misaligned guide vanes are shown in Fig.2. The optimum guide vane opening is 23o. The misaligned guide vanes have openings of 14oor 24o, with the other guide vanes having openings of 9 degrees in the analyses. The parameters for the three operating conditions are listed in Table 1. For all three operating conditions, the rotational speeds are all the rated speed and the water heads are all 500 m.
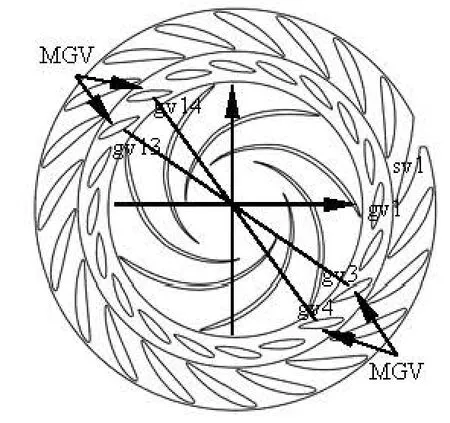
Fig.2 Positions of the four misaligned guide vanes
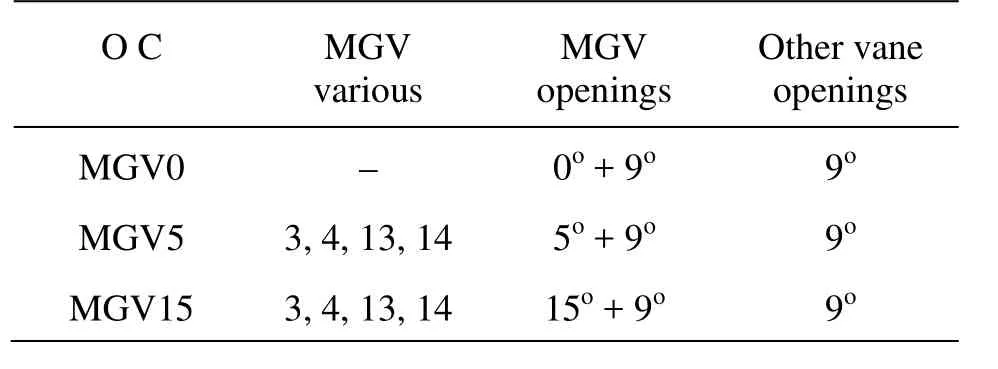
Table 1 Operation conditions for unsteady flow simulations
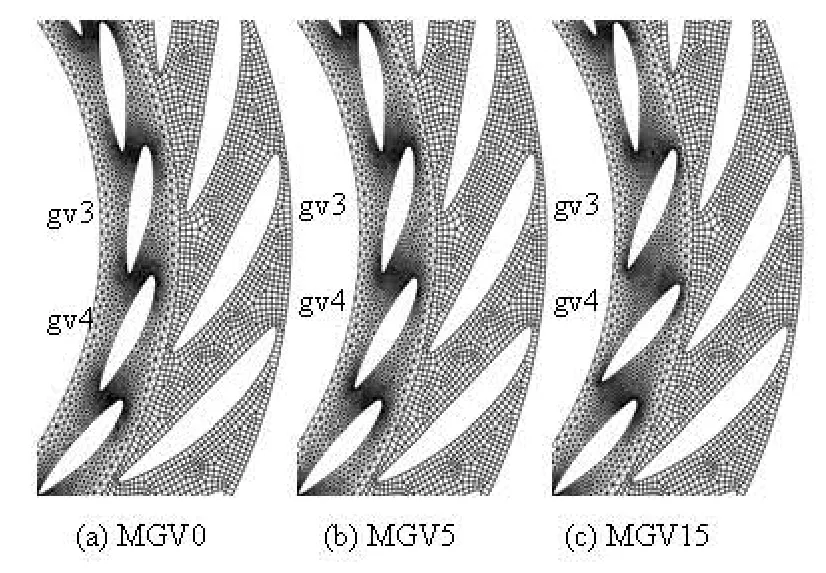
Fig.3 Three meshes near the stay vanes and the misaligned guide vanes
An unstructured mesh is used so that the cell density could be controlled manually based on the flow features. The effects of the mesh on the computational results are studied in preliminary calculations to determine the appropriate number of elements. Six different sizes of meshes and the number of elements from 6.7×10⁴to 3.2×10⁵are chosen. The steady numerical simulation shows that the efficiency results are more accurate with larger element number. The computing deviation of different grids is under 0.2% when the grid element is larger than 2.6×10⁵. So, the final mesh has about 1.24×10⁵nodes and 2.6×10⁵elements in the entire flow passage. The spiral case region has a relatively coarse mesh, with the mesh refined downstream as the flow is accelerated. Particular attention is paid to the discretization near the stay vanes, the guidevanes and the runner blades to correctly represent the local large velocity gradients. The local meshes for the three misaligned guide vane opening cases are shown in Fig.3.
The k-ω based SST model combines the k-ε and k-ω models by introducing a blending function with the objective to get the best out of both models. The SST model accounts for the transport of the turbulent shear stresses and gives very accurate predictions of the onset and the amount of flow separation with adverse pressure gradients[17]. A second-order backward Euler scheme is used for the convection terms with a central difference scheme for the diffusion terms in the momentum equations. The model is implemented in ANSYS CFX 13. The Reynolds number is about 2×10⁷for the present pump turbine, which affects the low frequency of the pressure fluctuation. For those unsteady simulations, the time step is related to the runner rotational speed to achieve one complete runner revolution every 100 time steps. The data are recorded every 2 time steps. The long periods for the irregular fluctuating flows are analyzed for 2 000 time steps in each case with data sampled for the last 1 000 steps. The pressures are converted to heads at various frequencies. The dominant relative frequency (f/fn) and the pulse amplitude at this frequency are then calculated by fast Fourier transforms (FFT).
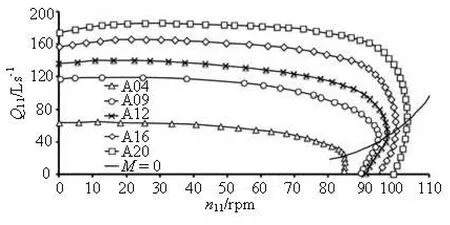
Fig.4 Model test performance curves with different openings in turbine model[18]
2. Analyses of experimental and numerical results
2.1 Comparison of experimental and numerical results
The model pump-turbine has a runner of 0.4046 m in diameter. The rated speed is 1 700 rpm. The model test unit speed-unit flow1111(n-Q) curves of five openings of 4o, 9o, 12o, 16oand 20oare shown in Fig.4[18]. The model tests are carried out without misaligned guide vanes. According to the model test performance curves, for those given openings, the unit flow Q11rapidly bends downward and even bends back to the horizontal axis n11, with a decreasing unit flow, it forms a S-curve shape in the larger unit speed region. The pumped turbine is required to change the operating modes frequently, so the transform among the turbine, the braking and the reverse pump operation modes is necessary, once it operates in the S-curve region, the entire unit stability will be deteriorated.
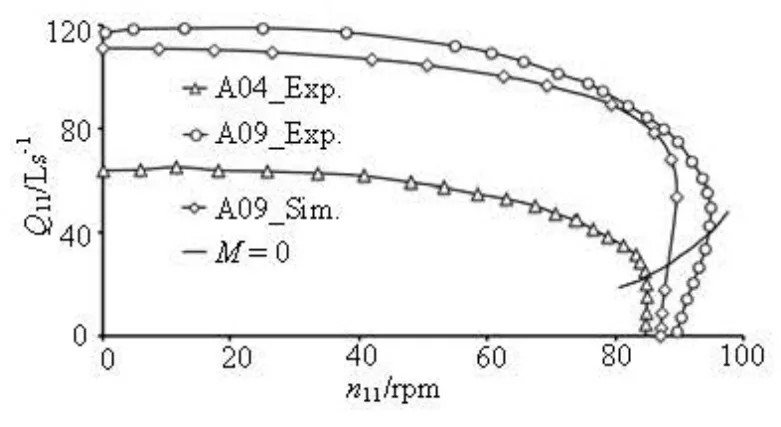
Fig.5 Numerical and experimental unit speed-unit flow curves at the guide vane opening of 9o
The calculation for the prototype pump turbine is used to select the guide vane opening of 9oto predict the performance curve. The steady-state simulation is performed with more than 15 simulation points of the turbine mode. The predicted steady unit speed-unit flow curves are compared with the experimental data, as shown in Fig.5. The basic trend of the experimental performance data agrees with the simulated turbine performance curve. At a larger unit flow, the experimental unit flow is larger than the predicted data. At a larger unit speed, the experimental unit speed is larger than the predicted data, too. The steady-state simulations have large errors in the range of S-curves. Although the predicted performance curves agree with the measured data, the error in the steady simulations is obvious.
2.2 Pressure analysis in the flow diversion region
During the calculations, the flow data are saved at selected points inside the spiral case, the stay vanes and the guide vanes, as shown in Fig.6(a). Five points are on the spiral case (named sp1-sp5), four on the stay vanes (named sv1-sv4), four on the pressure side of the guide vanes (named mv1–mv4), and four on the suction side of the guide vanes (named gv1-gv4) with each set of four points evenly arranged along the circumferential direction. Four points are also located on the MGV suction side (named gv5-gv8). All these points are located on the middle span plane (0.5 span) along the blade height. They are in a stationary reference frame.
The pressure is recorded at those seventeen points in the spiral case, the stay vane and the guide vane in the unsteady predictions. The relative peak-to-peak pulse amplitude is defined as ΔH/ H, where ΔH is the amplitude of the pressure fluctuation in the time domain. The relative peak-to-peak amplitudes of the pulses are shown in Figs.6(b)-6(f) for the three different MGV openings. In each figure, the last column is the average of the relative pulse amplitude at the fouror five points.
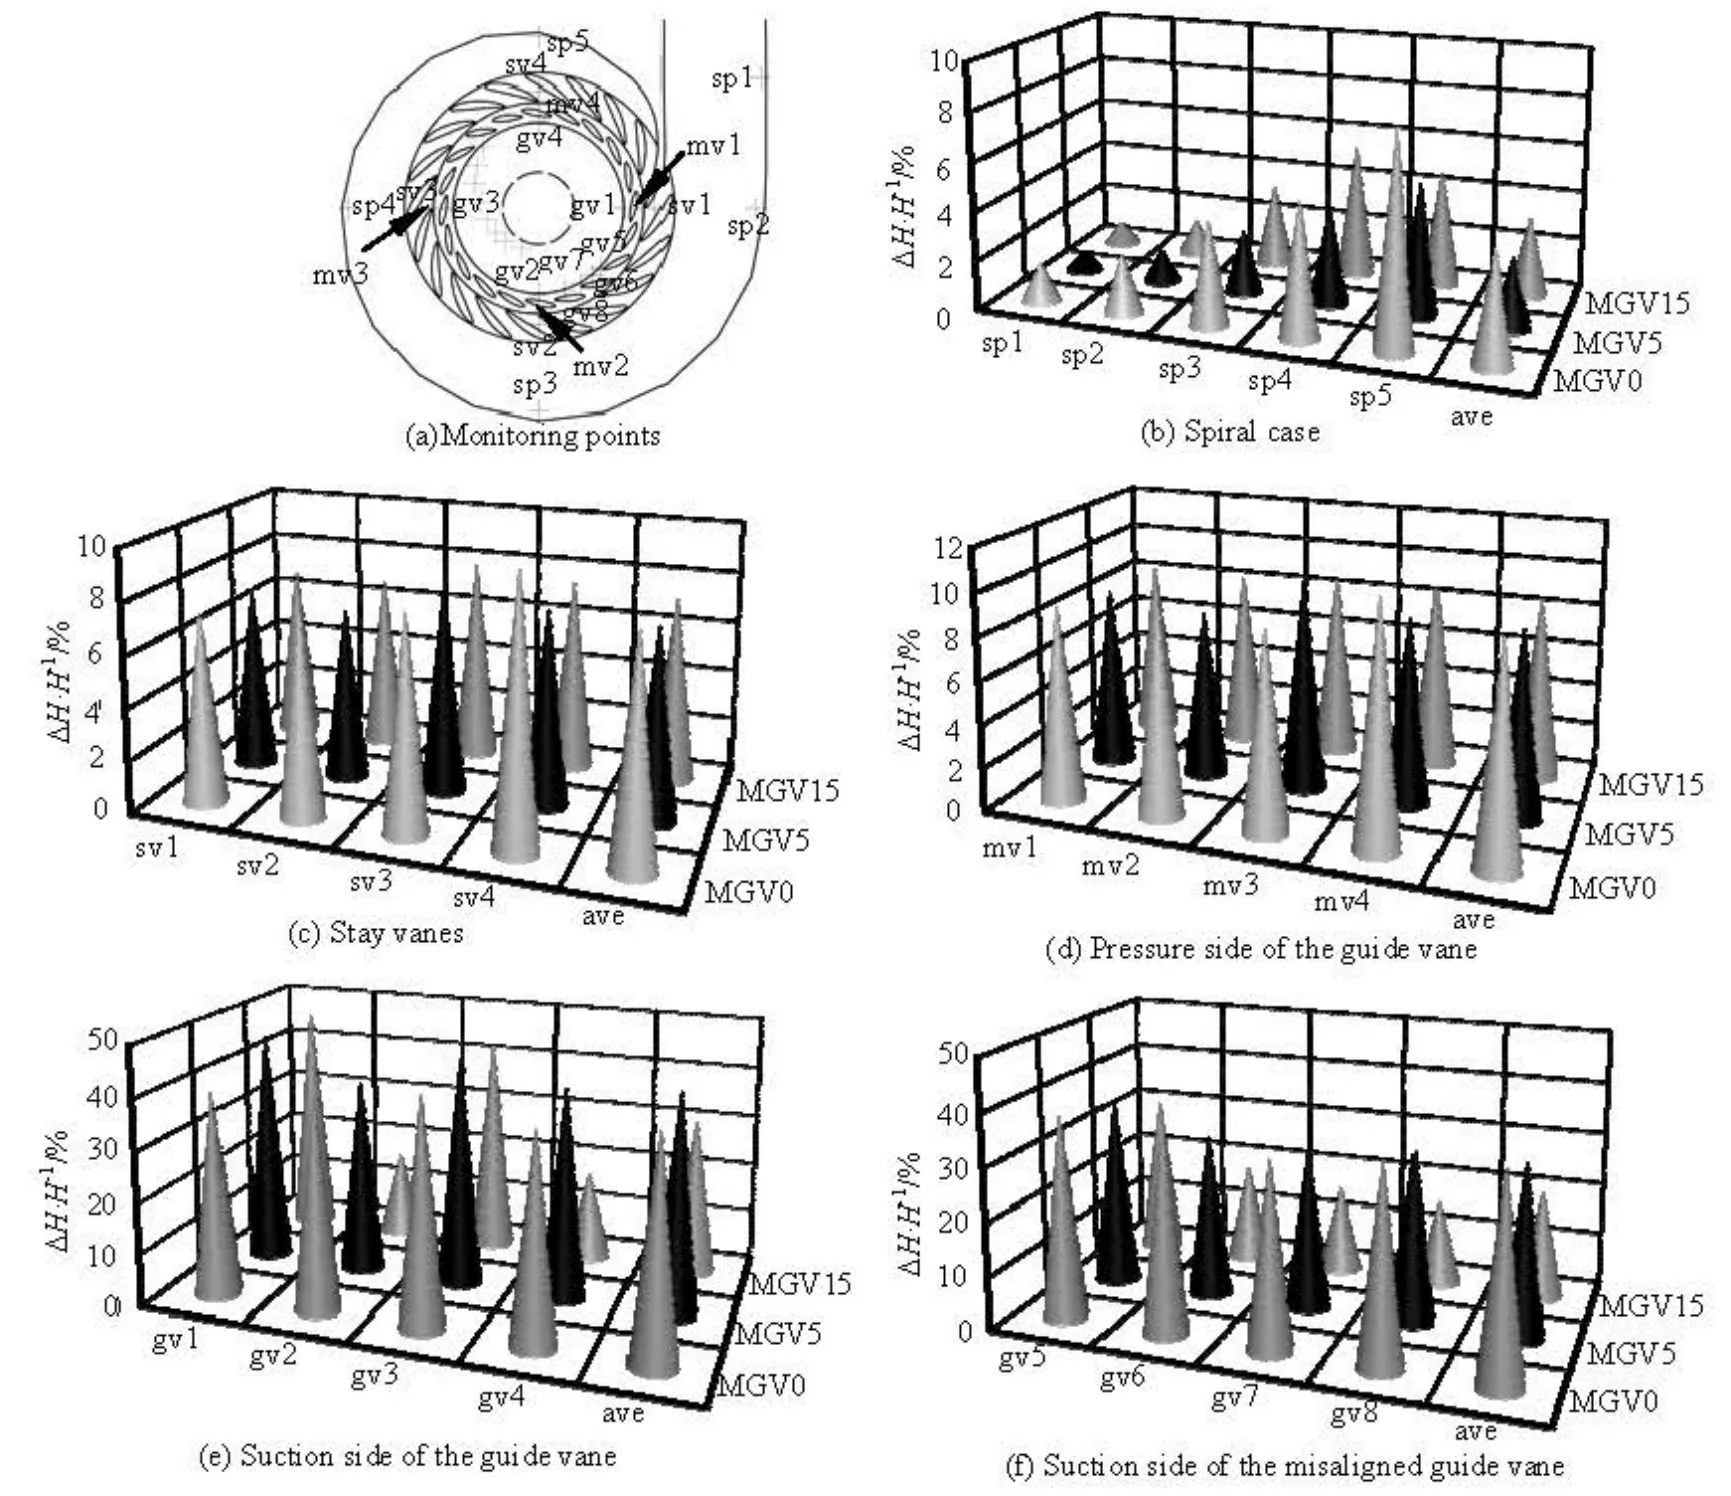
Fig.6 Predicted relative pulse amplitudes in front of the runner at 17 points for three cases
The calculated results show that, in the spiral case, the relative pressure amplitude increases along the flow direction for all three cases. The pulse amplitude at each monitoring point decreases as the MGV opening increases. At smaller monitoring point radii, the relative pulse amplitude increases from the spiral case to the stay vane and to the pressure side of the guide vane, with a dramatically increase on the suction side of the guide vane. Three sets of points on the stay vane and the guide vane, sv1 to sv4, mv1 to mv4, and gv1 to gv4, are evenly arranged along the circumferential direction. The results in Figs.6(c) and 6(d) show that the pulse amplitude is less than 12%, with little difference between the four values on each surface. The relative pulse amplitude then increases dramatically on the suction side of the guide vane, by almost 40%, as shown in Figs.6(e) and 6(f). The results show that the amplitudes at the four symmetric points (gv1 to gv4) change greatly for the case MGV15, which means that the MGV leads to a nonuniform flow in the circumferential direction to cause large differences in the pulse amplitudes between the four points. The average pressure pulses in the flow diversion region show that the misaligned guide vanes can significantly reduce the pulse amplitude. As the MGV opening increases, the pulse amplitudes decrease significantly.
2.3 Pressure analysis for the runner blade passage
There are also eight monitoring points rotating with the runner between the two runner blades in the blade passage (named rv1-rv8) as shown in Fig.7(a) to record the pressure pulses. The relative pulse amplitudes at the eight rotating points in the blade passage are shown in Fig.7(b) for the three MGV openings.
These results show that the pulse amplitudes decrease gradually from point rv1 to rv8 in the cases MGV0 and MGV5. However for the case MGV15, the pressure pulses at the first three points increase from 40% to 50%, and then decrease gradually from rv3 to rv8. At the same monitoring point, the pulse amplitudes also increase in some extent from the case MGV0 to MGV15. Thus, the MGV will reduce the pulse amplitudes in the stay parts of the pump turbine flow passages, but will increase the pulse amplitudes within the rotating runner blade passages.
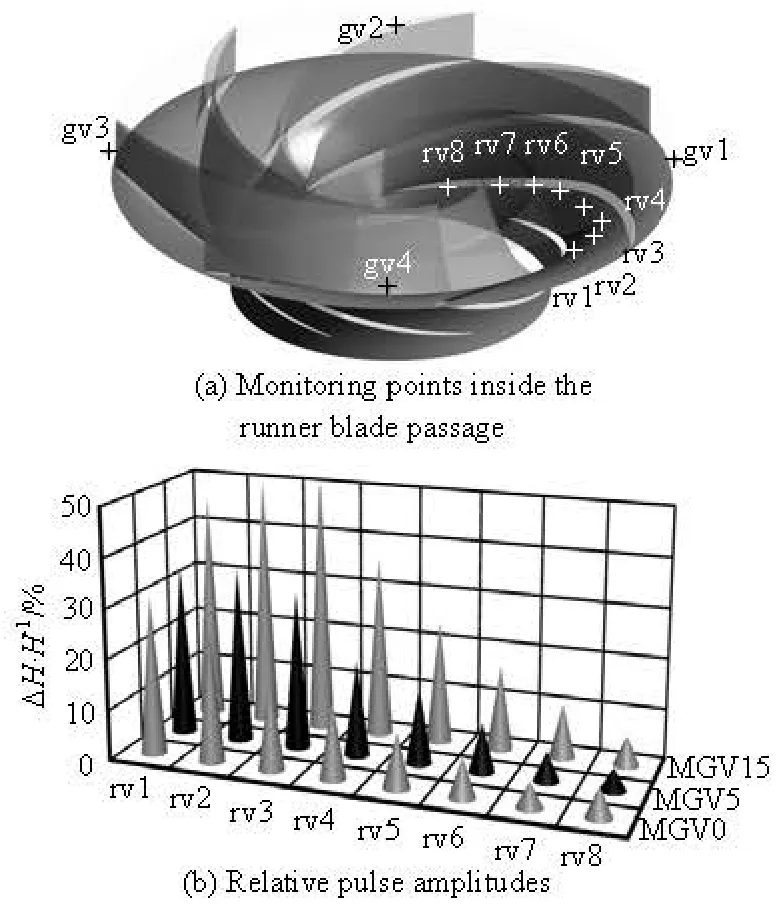
Fig.7 Predicted relative pulse amplitudes at the eight rotating points inside the runner passage
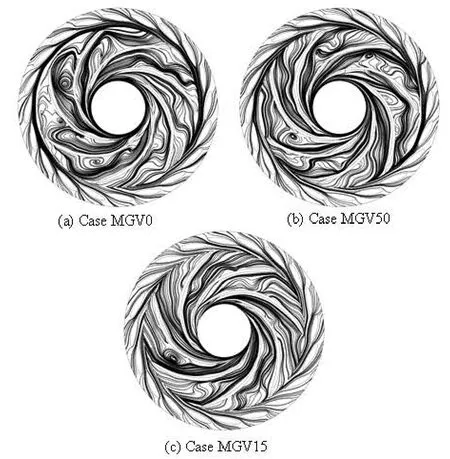
Fig.8 The streamline in guide vane and runner middle span surface at the same time of 4.8 s
The predicted results show that the increase of the MGV opening increases the relative pulse amplitudes at the runner rotating points. The features of the flow structures inside the runner passage at various MGV openings are shown in Fig.8, with the streamline distributions on the runner inlet mid-span surface around point rv1 in the rotating coordinate. The streamline distributions can be seen on this surface for three cases. For the case MGV0 with small guide vane opening, there is a significant turbulence created in each seven blade passages, as shown in Fig.8(a). The vortices in the runner passages are the main reason of the large pressure pulse amplitudes, and the so called unstable S-curve characteristics for the pump-turbine. By using the misaligned guide vanes, the flow is increased for those MGV passages, which decreases the vortex in the downstream blade passages. With larger MGV openings, the flow is increased more and fewer vortices are found in the corresponding blade passage, as shown in Figs.8(b) and 8(c). In each blade passage, the flow structure will change from a smooth pattern to vortices periodically with the runner rotating, which results in more larger pressure pulse amplitudes.
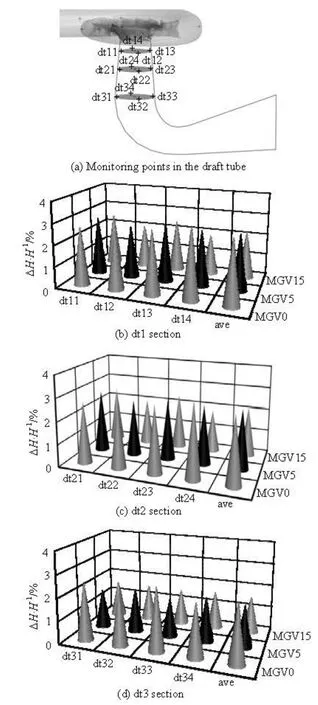
Fig.9 Predicted relative pulse amplitudes at the three sections in the draft tube
2.4 Pressure analysis in the draft tube
The flow data recorded include also those at three sections (named dt1-dt3) in the upper tube, with each section having four points near the wall. Point 1 on the dt2 plane is named dt21 with the other pointsnamed in a same manner, as shown in Fig.9(a). These points are in a stationary reference frame. The relative peak-to-peak pressure amplitudes at these 12 survey points along the cone tube (from dt1 to dt3) are shown in Figs.9(b)-9(d). At each section, the relative pressure pulse amplitudes at the four points near the wall are almost the same. The maximum amplitude reaches 4% at dt14 for the case MGV0. The relative amplitudes decrease gradually along the flow direction from section dt1 to dt3 for all three cases. The average pressure amplitudes in the draft tube indicate that the misaligned guide vanes reduce the pulse amplitude in an increased extent as the MGV opening increases.
2.5 Analysis of the pulse spectrum
The pressure pulse spectra are analyzed at various points throughout the entire flow passage. The pulse amplitude spectra at points sp5, sv4, mv4, gv4, rv1, rv4, rv8 and dt11 are shown in Fig.10 for all three cases. The calculated pressure pulse frequencies and amplitude spectra for the case MGV0 are shown in Fig.10(a). The pressure amplitude spectra show that at each point (sp5 to gv4) inside the runner upstream, the frequencies 7fn, 14fnand 21fnare included, These frequencies, which are 7 times the runner rotational frequency, which corresponds to the number of blades on the runner, are the results of the rotor-stator interference between the runner and the guide vanes, which, thus, is one of the main factors creating the pressure pulses in the turbine guide components. Figure 10(a) also shows that the 7fnpulse amplitudes gradually increases from point sp5 to gv4, indicating that the influence of the runner becomes stronger along the flow direction upstream of the runner. In addition, the dominant frequency is a low frequency of 0.732fn. At the rotating points (rv1, rv4 and rv8), the dominant frequency is 20fn, instead of the low frequency in the upstream region. The 20fnpulse amplitudes decrease gradually from point rv1 to rv8, indicating that the influence of the cascades is weakened along the flow direction. At the draft tube point dt11, the dominant frequency is still the low frequency of 0.732fn, due to the unsteady vortex rope in the draft tube.
The calculated pressure pulse amplitude spectra for the cases MGV5 and MGV15 are shown in Figs.10(b) and 10(c). For these two cases, the spectra show that at the points (sp5 to gv4) inside the upstream of the runner, the frequencies of 7fn, 14fnand 21fncan still be found. The 7k fnpulse amplitudes also gradually increase from point sp5 to gv4. For the case MGV5, the dominant frequency is still a low frequency of 1.07fn, with an obvious 0.54fncomponent. For the case MGV15, the dominant frequency changes to 0.63fn, with an obvious 1.27fncomponent.

Fig.10 Predicted pressure amplitude spectra in the entire flow passage of the three cases
For the cases MGV5 and MGV15, at the rotating points (rv1, rv4 and rv8), one sees the 20fnfrequency with the amplitudes of the 20fnpulses decreasing gradually from point rv1 to rv8. The dominant frequencies are 2fn, 4fnand 6fn. The amplitudes of the 2kfnpulses are very large in both cases, due to the two sets of misaligned guide vanes. At the draft tube point dt11, the dominant frequency changes to 0.54fnin the case MGV5 and 0.63fnin the case MGV15.The misaligned guide vane and the openings also change the unsteady vortex rope flow behavior in the draft tube.
Figure 10 also shows the amplitude of the energy spectra E at these monitoring points for all three cases. In the runner upstream region and the draft tube, the RSI (7k fnand 20fn) pulse energy spectra change a little for all three cases, while the misaligned guide vanes reduce the low frequencies and the energy spectra significantly. That is the reason why the misaligned guide vanes reduce the pulse amplitudes in the stationary parts of the turbine. At all rotating points, the 20fnpulse energy spectra are almost the same for all three cases, while the 2kfnpulse energy spectra increase dramatically in the cases MGV5 and MGV15, then the pulse amplitudes are increased. These two sets of misaligned guide vanes destroy the consistency of the runner inner flow, which becomes more evident with the increase of the opening.
3. Conclusions
The pressure pulses in a Francis pump turbine are predicted numerically under turbine operating conditions for the rated rotational speed at different misaligned guide vane openings.
The numerical results show that the misaligned guide vanes significantly reduce the pulse amplitudes in the stationary parts of the turbine, with larger amplitude decreases, when the misaligned guide vane opening increases. However, the misaligned guide vane increases the pulse amplitudes within the rotating runner blade passages with the pulse amplitudes increasing more with increasing misaligned guide vane opening.
The pressure pulse spectra indicate that the misaligned guide vane opening changes the low frequencies and the energy spectra in the entire flow passage. The change in the pulse amplitude is mainly due to the effect of the RSI and the low frequency vortex rope behavior in the entire flow passage.
Acknowledgement
This work was supported by the State Key Laboratory of Hydroscience and Engineering, Tsinghua University (Grant No. 2014-KY-05).
[1] GREIN H., BACHMANN P. Hydraulic torque on misaligned guide vanes[J].Water Power and Dam Con-struction,1976, 28(2): 37-40.
[2] RODRIGUEZ C. G., EGUSQUIZA E. and SANTOS I. F. Frequencies in the vibration induced by the rotor stator interaction in a centrifugal pump turbine[J].Jour-nal of Fluids Engineering,2007, 129(11): 1248-1435.
[3] ZOBEIRI A., KUENY J.-L. and FARHAT M. et al. Pump-turbine rotor-stator interactions in generating mode: Pressure fluctuation in distributor channel[C].Proceedings of the 23rd IAHR Symposium.Yokohama, Japan, 2006.
[4] NENNEMANN B., VU T. and FARHAT M. CFD prediction of unsteady wicket gate-impeller interaction in Francis turbines: A new standard hydraulic design pro- cedure[C].Waterpower XIV.Austin, USA, 2005.
[5] SUSAN-RESIGA R., CIOCAN G. D. and ANTON I. et al. Analysis of the swirling flow downstream a Francis turbine runner[J].Journal of Fluids Engineering,2006, 128(1): 177-189.
[6] SCHOBEIRI M. T., ABDELFATTAH S. and CHIBLI H. Investigating the cause of computational fluid dynamics deficiencies in accurately predicting the efficiency and performance of high pressure turbines: A combined experimental and numerical study[J].Journal of FluidsEngineering,2012, 134(10): 101104.
[7] DRING R. P., JOSLYN H. D. and HARDIN L. W. et al. Turbine rotor-stator interactions[J].Journal of FluidsEngineering,1982, 104(4): 729-742.
[8] SHAO W. Y. Improving stability by misaligned guide vanes in pumped storage plant[C].2009 Asia-Pacific Power and Energy Engineering Conference.Wuhan, China, 2009.
[9] BILLDAL J. T., WEDMARK A. Recent experiences with single stage reversible pump turbines in GE Energy’s hydro business[C].Hydro 2007.Granada, Spain, 2007.
[10] QIAN Z. D., ZHENG B. and HUAI W. X. et al. Analysis of pressure oscillations in a Francis hydraulic turbine with misaligned guide vanes[J].Proceedings of the Institution of Mechanical Engineers, Part A: Journalof Power and Energy,2010, 224(1): 139-152.
[11] XIAO Ruo-fu, SUN Hui and LIU Wen-chao et al. Analysis of S characteristics and its pressure pulsation of pump-turbine under pre-opening guide vanes[J].Journal of Mechanical Engineering,2012, 48(8): 174-179(in Chinese).
[12] SUN H., XIAO R. F. and YANG W. et al. The optimal model of misaligned guide vanes for a particular pumpturbine[C].The 26th IAHR Symposium on HydraulicMachinery and Systems.Beijing, China, 2012.
[13] SUN H., XIAO R. F. and LIU W. C. et al. Analysis of S characteristics and pressure pulsations in a pump-turbine with misaligned guide vanes[J].Journal of FluidsEngineering, 2013, 135(5): 051101.
[14] XIAO Y. X., SUN D. G. and WANG Z. W. et al. Numerical analysis of unsteady flow behavior and pressure pulsation in pump turbine with misaligned guide vanes[C]The 26th IAHR Symposium on HydraulicMachinery and Systems.Beijing, China, 2012.
[15] XIAO Y., WANG Z. and YAN Z. et al. Numerical analysis of unsteady flow under high-head operating conditions in Francis turbine[J].Engineering Computations,2010, 27(3): 365-386.
[16] XIAO Y. X., WANG, Z. W. and YAN Z. G. Experimental and numerical analysis of blade channel vortices in a Francis turbine runner[J].Engineering Computatio-ns,2011, 28(2): 154-171.
[17] MENTER F. R. A comparison of some recent eddy-viscosity turbulence models[J].Journal of Fluids Engi-neering,1996, 118(3): 514-519.
[18] MEI Z. Y.The pump storage power station technology[M]. Beijing, China: China Machinery Industry Press, 2000(in Chinese).
10.1016/S1001-6058(14)60028-7
* Project supported by the National Natural Science Foundation of China (Grant No. 51009077), the National High Technology Research and Development Program of China (863 Program, 2009AA05Z424).
Biography: XIAO Ye-xiang (1978-), Male, Ph. D.
WANG Zheng-wei, E-mail: wzw@mail.tsinghua.edu.cn
杂志排行
水动力学研究与进展 B辑的其它文章
- Numerical prediction of 3-D periodic flow unsteadiness in a centrifugal pump under part-load condition*
- Experimental investigations of transient pressure variations in a high head model Francis turbine during start-up and shutdown*
- Improved conservative level set method for free surface flow simulation*
- Capillary effect on the sloshing of a fluid in a rectangular tank submitted to sinusoidal vertical dynamical excitation*
- Effect of compressive stress on the dispersion relation of the flexural–gravity waves in a two-layer fluid with a uniform current*
- Comprehensive analysis on the sediment siltation in the upper reach of the deepwater navigation channel in the Yangtze Estuary*
