A Multiscale Progressive Failure Modeling Methodology for Composites That Includes Fiber Strength Stochastics
2014-04-17TrentonRicksThomasLacyJrBrettBednarcykStevenArnoldandJohnHutchins
Trenton M.Ricks,Thomas E.Lacy,Jr.,2,Brett A.Bednarcyk,Steven M.Arnoldand John W.Hutchins
1 Introduction
As a result of recent increases in computational capabilities,numerous models have been developed to simulate material behavior across multiple length scales[Sullivan and Arnold(2011)].While most material models are deterministic in character,real materials exhibit statistical variations in properties and features over a range of different length scales.When performing multiscale analyses,a number of challenges arise when accounting for statistically varying material characteristics[Graham-Brady,Arwade,Corr,Gutierrez,Breysse,Grigoriu,and Zabaras(2006);Sriramula and Chryssanthopoulos(2009)].For instance,how does statistical variability at one length scale affect the predicted material response over a hierarchy of scales including the macroscale[Graham-Brady,Arwade,Corr,Gutierrez,Breysse,Grigoriu,and Zabaras(2006)]?To answer this question,multiscale modeling strategies have been developed to account for variations in properties and morphologies at different scales(cf.,[Sriramula and Chryssanthopoulos(2009)]for a summary of different multiscale methods for fiber-reinforced polymer matrix composites).
Many researchers have recognized the need to include a distribution of fiber segment strengths in analytical/numerical models rather than using a single deterministic value in order to better estimate the composite strength and characterize the failure behavior.Early models of unidirectional composites developed by Rosen(1964)and Zweben(1968) first considered a distribution of fl aws along the fiber length.The Equal(or Global)Load Sharing model of Rosen(1964)assumes that upon the failure of an individual fiber,the load is equally distributed to intact fibers.In contrast,the Local Load Sharing model developed by Zweben(1968)assumes that a greater fraction of the load is redistributed to intact fibers near the fiber break.Various other models have since been developed to predict the strength of unidirectional composites based upon a distribution of fiber strengths[Harlow and Phoenix(1978);Oh(1979);Curtin(1991),(1993);Foster,Ibnabdeljalil,and Curtin(1998);Curtin(2000);Landis,Beyerlein,and McMeeking(2000);Bednarcyk and Arnold(2001);Okabe,Takeda,Kamoshida,Shimizu,and Curtin(2001);Okabe and Takeda(2002);Lekou and Philippidis(2008)].For example,Bednarcyk and Arnold(2001)developed the Evolving Compliant Interface model.This model was incorporated into the Micromechanics Analysis Code with Generalized Method of Cells(MAC/GMC)[Bednarcyk and Arnold(2002)]where the interface between fiber subcells in adjacent mating triply periodic repeating unit cells(RUCs)was given a fiber tensile strength consistent with fiber vendor data.This method was used to simulate the longitudinal failure of a unidirectional metal matrix composite at the microscale(i.e.,RUC behavior)and compared with the Curtin fiber breakage model[Curtin(1991),(1993)]that combined a statistical probability of fiber failure based upon a shear lag approach.However,these models have not been generally applied within a multiscale analysis framework.
Various techniques have been proposed in order to characterize the effects of microscale material uncertainty on the macroscale response.The Multiscale Stochastic Finite Element Method(MSFEM)was developed to simulate random heterogeneous materials from the micro-to meso-to macroscales[Xu,Chen,and Shen(2009);Shen and Xu(2010)].Uncertainties can be introduced in the form of random coefficients in partial differential equations(e.g.,moduli)or boundary conditions(e.g.,load,displacement).A homogenization technique can be implemented at the microscale to account for different material phases[Shen and Xu(2010)].This method has yet to be extended to simulate the multiscale progressive failure of composite materials.A multilevel finite element(FE)method(i.e.,FE2)[Feyel and Chaboche(2000);Feyel(2003)]was also developed in which a combination of localization and homogenization techniques is employed between two or more length scales through a series of FE calculations.For example,macroscale integration point strains from a global FE model(e.g.,a coupon specimen or structure)can be mapped onto a microscale FE model containing representations of individual constituents.The ensuing microscale stress field can be used to predict evolution of structure within the RUC and homogenized.The RUC-averaged response can then beused toupdate the macroscale integration point stresses.Asimilar approach was adopted by Blassiau,Thionnet,and Bunsell(2006a),(2006b),(2008).Multiple FE models of individual RUCs were developed to characterize the interaction of a single broken fiber with varying numbers of unbroken fibers[Blassiau,Thionnet,and Bunsell(2006a),(2006b)].Multiscale FE simulations,which accounted for statistical variation in fiber strengths,were performed to predict the effect of local fiber breakage,stress redistribution in the vicinity of broken fibers,and interfacial debonding around fiber breaks on bulk damage accumulation and failure for unidirectional and fi lament wound carbon fiber composites with elastic or viscoelastic epoxy matrices[Blassiau,Thionnet,and Bunsell(2008)].
An alternative multiscale method has been implemented by Bednarcyk and Arnold(2007)where the reformulated generalized method of cells(GMC)[Pindera and Bednarcyk(1999)]was used to perform microscale calculations;the homogenized microscale material response was integrated into macroscale calculations performed using a hybrid FE approach.The reformulated GMC as implemented within the ABAQUS Standard or Explicit FE solver(2013)is referred to herein as FEAMAC(cf.,Fig.1).Since the RUC-averaged response obtained using the GMC is more computationally efficient than traditional FE approaches[Pindera and Bednarcyk(1999)],this multiscale approach is considered to be more computationally efficient than FE2.Bednarcyk and Arnold(2007),(2011)demonstrated the feasibility of using FEAMAC to simulate the progressive multiscale failure of composite materials.A traditional maximum stress failure criterion for fiber failure and the Curtin fiber breakage model were each implemented within RUCs at the microscale and used to simulate progressive failure of a metal matrix composite(MMC)tensile dogbone specimen at the macroscale using global-to-local-to-global analyses.In the current study,MAC/GMC and FEAMAC are used to investigate the effect of statistical variations in fiber strengths on failure progression within RUCs at the microscale and subsequent macroscale failure.Future work will investigate the effects of statistical variations in constituent moduli,strengths,volume fractions,and orientations on local and global composite failures.
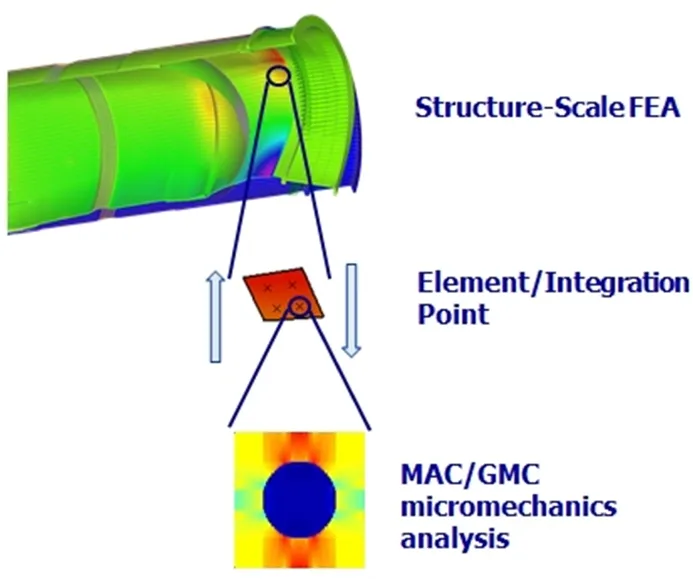
Figure 1:Schematic showing the coupling of MAC/GMC with ABAQUS via FEAMAC.
When performing multiscale analyses involving damage and failure of fibrous composites,the stochastic variations in fiber strengths are commonly characterized using a Weibull cumulative distribution function(CDF)[Weibull(1951)],although other distribution functions(e.g.,sigmoidal functions[Baxevanakis,Jeulin,and Valentin(1993)])may also be used.The classic two-parameter Weibull CDF,however,does not account for the effect of fiber segment length on the measured strengths and,as a consequence,has been shown to yield inaccurate strength predictions[Curtin(2000)].Early modi fi cations to the classic two-parameter Weibull CDF to incorporate the effect of fiber segment lengths also led to inaccurate pre-dictions in the strength distribution of fiber segment strengths particularly at shorter segment lengths(cf.,[Hitchon and Phillips(1979)]).Accordingly,a modified two-parameter Weibull CDF was proposed by Watson and Smith(1985)to better account for the effect of fiber segment length on the probability of failure,i.e.,

wherePfrepresents the cumulative probability of failure at a given axial stress,σ.
The Weibull scale(σ0)and shape(β )parameters may be determined from measured fiber strength data.L0represents the reference fiber length(i.e.,the length at which σ0and β were determined)andLrepresents the characteristic fiber length of interest.The unitless fiber strength parameter α can be determined from experimental strength data in which the tested fiber lengths are varied(e.g.,0≤α≤1).For example,Beyerlein and Phoenix(1996)determined this value to be equal to 0.6 for an AS4 carbon fiber.If α=0,then it is easily seen that Eq.1 reduces to the classic two-parameter Weibull CDF.A number of researchers have used the modified two-parameter Weibull CDF(Eq.1)to characterize the effect of fiber segment length on failure for a wide variety of composites with silicon carbide mono fi laments as well as carbon,glass,and fl ax fibers[Padgett,Durham,and Mason(1995);Beyerlein and Phoenix(1996);Foster,Ibnabdeljalil,and Curtin(1998);Curtin(2000);Landis,Beyerlein,and McMeeking(2000);Andersons,Joffe,Hojo,and Ochiai(2002);Okabe and Takeda(2002);Andersons,Spamins,Joffe,and Wallstrom(2005);Naito,Yang,Tanaka,and Kagawa(2012)].As will be shown in this study,accounting for the effect of fiber lengths on the probability of failure is of critical importance in multiscale progressive failure analyses of continuous fiberreinforced composites.In order to simulate progressive failure within RUCs at the microscale,the modified two-parameter Weibull CDF(Eq.1)was implemented within the framework of MAC/GMC[Bednarcyk and Arnold(2002)].
MAC/GMC provides a computationally efficient means of modeling composites based on Aboudi’s method of cells micromechanics theories[Aboudi(1991);Paley and Aboudi(1992);Aboudi(1995),(1996);Pindera and Bednarcyk(1999);Aboudi(2004);Aboudi,Arnold,and Bednarcyk(2012)].Using the method of cells,a doubly or triply periodic RUC is discretized into an arbitrary number of subcells.Each subcell is then assigned material properties and a constitutive law to describe the local material behavior.Continuity of displacements and tractions are then enforced along the subcell boundaries in an average sense,and all field quantities are evaluated at the subcell centroids.An illustration of this scheme for a unidirectional composite is shown in Fig.2.Using this model,a doubly-periodic RUC may be defined in thex2−x3plane and is discretized into an arbitrary number of subcells along thex2-direction(height)and thex3-direction(width),respectively,while the fibers extend in thex1-direction(length).If a triply periodic RUC is selected,the RUC can be discretized along thex1-direction as well.
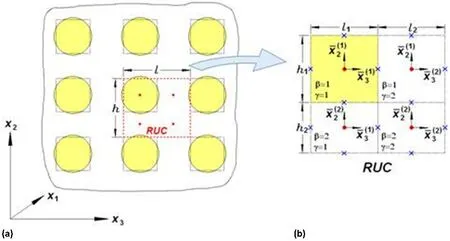
Figure 2:a)Representation of a unidirectional composite with fibers aligned in the x1-direction and b)RUC representation of the unidirectional composite.Figure from Aboudi,Arnold,and Bednarcyk(2012).
When performing global analyses using FEs,geometric symmetries(e.g.,one-half,one-quarter,one-eighth symmetry)are often exploited to reduce the number of model degrees-of-freedom and decrease the computational time.In fact,such symmetry assumptions were employed by Bednarcyk and Arnold(2007),(2011)and Blassiau,Thionnet,and Bunsell(2008).However,it will be shown that use of geometric symmetries is inappropriate in global(structural)progressive failure analyses when the actual spatial distribution of fiber strengths displays no such symmetries.This issue has not received much attention in the literature.One central goal of this work is to present a method for systematically assigning an experimentally determined spatial distribution of fiber strengths to individual fibers within RUCs.These RUCs can then be analyzed separately or implemented within a multiscale framework(e.g.,FEAMAC).
The first part of this study analyzes the effect that a stochastic distribution of fiber strengths has on the RUC-averaged stress-strain response and failure using MAC/GMC.While this initial micromechanics-based study provides insight into local pointwise material behavior,the true stochastic nature of the problem is only revealed when integrated multiscale micromechanical/FE analyses are performed.
This is demonstrated herein using an MMC dogbone specimen as the representative structure.
2 Material System
The effect of a statistical variationin fiber strengths on the failure behavior of a 25%fiber volume fraction SCS-6/TIMETAL 21S MMC at 650˚C was analyzed in this study.The SCS-6 fiber is a high-stiffness,high-strength silicon carbide monofilament with a diameter of approximately 142 µm.In a previous work[Bednarcyk and Arnold(2011)],a two-parameter Weibull probability density function(PDF)was fi t to room temperature fiber strength data(σ0=4198.9 MPa,β =10).These Weibull parameters were determined based on mono fi lament tensile tests at a fiber length ofL0=25.4 mm[Bednarcyk and Arnold(2011)].Additionally,the Weibull scale factor(σ0)was reduced by 5.3%for simulations performed at 650˚C to account for the fiber strength dependence on temperature[Mall,Fecke,and Foringer(1998);Bednarcyk and Arnold(2007),(2011)].In the current study,the SCS-6 fiber was assumed to be linearly elastic and isotropic.TIMETAL 21S is a metastable beta strip titanium alloy possessing a high strength and good creep and oxidation resistance.The titanium matrix was considered to be viscoplastic and was simulated using the Generalized Viscoplasticity with Potential Structures(GVIPS)constitutive model[Arnold and Saleeb(1994);Arnold,Saleeb,and Castelli(1996)].Table 1 contains a summary of the thermoelastic material properties for both the SCS-6 fiber and the TIMETAL 21S matrix[Bednarcyk and Arnold(2011)].The viscoplastic material properties employed in this study can be found in Arnold,Saleeb,and Castelli(1996)and Bednarcyk and Arnold(2011).
3 RUC Analyses
A parametric study was performed using MAC/GMC to assess the effect of variable fiber strengths on microscale composite failure at 650˚C.Such information is crucial for predicting progressive composite failure at the macroscale(structural level).Five different doubly-periodic RUCs were analyzed in this study:single-,four-,nine-,25-,and 49- fiber RUCs.These RUCs are comprised of 2x2,4x4,6x6,10x10,and 14x14 subcells,respectively,while maintaining a constant fiber volume fraction of 25%.Figure 3 shows the single- fiber and 25- fiber doubly-periodic RUCs considered in this study.Note that a 25- fiber RUC can be subdivided into 25 individual single- fiber RUCs.The MMC material system considered in this work was specifically fabricated to provide uniform fiber volume fractions throughout the composite and a square arrangement of fibers[Bowman(1999)].Hence,these RUC architectures are representative of the as-fabricated material.For each
individual fiber subcell in the RUC,a fiber tensile strength value obtained from an experimentally determined Weibull CDF was assigned.Essentially,a random number was generated(i.e.,[0-1])and used to solve Eq.1 for the fiber strength,σ.These strength values were then assigned to the individual fibers contained within the RUCs in the microscale analyses.To assess the effect of fiber length on the predicted RUC response,MAC/GMC analyses were performed where the fiber length-dependent strength was obtained from Eq.1.For example,for the single- fiber RUC,an individual fiber tensile strength was selected using the modifi ed Weibull CDF(Eq.1)and assigned to the fiber.Similarly,four,nine,25,and 49 fiber tensile strengths were selected using the CDF and assigned to the four-,nine-,25-,and 49- fiber RUCs,respectively.
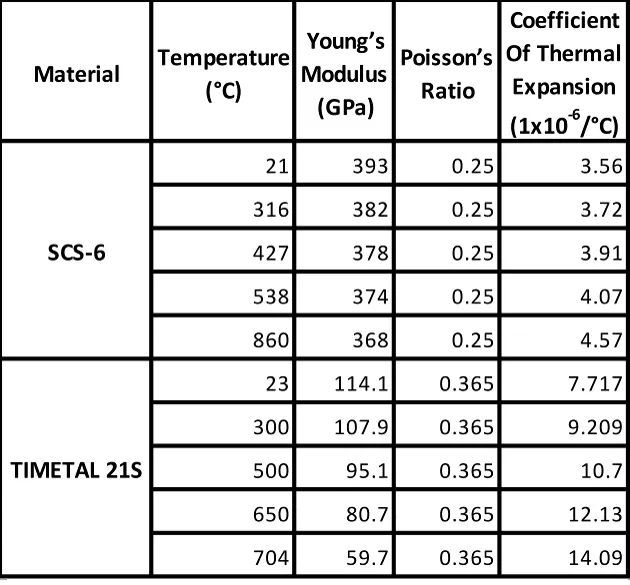
Table 1:Material properties for SCS-6 and TIMETAL 21S.
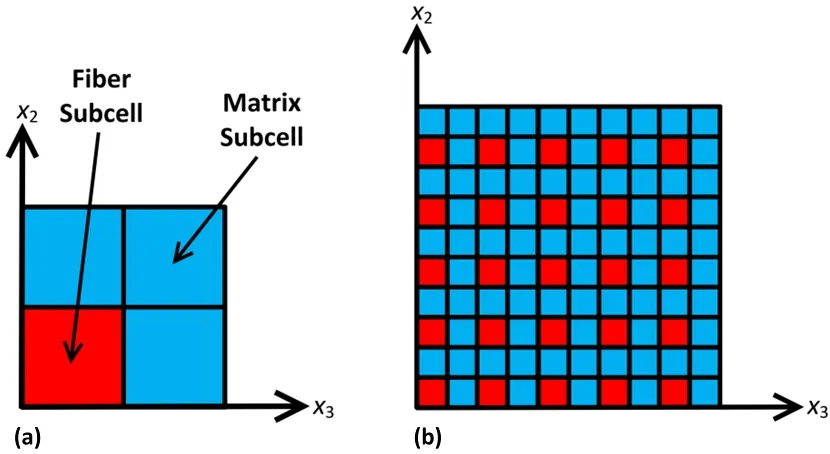
Figure 3:Microstructural representation of a unidirectional SiC/Ti composite for a)a single- fiber RUC and b)a 25- fiber RUC.
In these MAC/GMC analyses,the modified Weibull parameters α=1,L=0.64mm,andL0=25.4 mm(L/L0=0.025)were chosen.This value ofLcorresponds to one half of a key macroscale fiber segment length as will be discussed later.Simulations were also performed where α=0 in order to bound the effect of fiber length on the fiber strength distribution.Figure 4 contains plots of the associated PDFs and CDFs for Eq.1 for the case where 0≤α≤1.Since the fiber segment length is much smaller than the reference length(i.e.,L/L0=0.025),the length-dependent strength distribution is shifted to higher stresses as α increases.The modified Weibull CDF(Eq.1)is based on “weakest link”theory;a distribution of shorter fibers will typically have higher strengths than an analogous distribution of longer fibers due to the decreased likelihood of severe fl aws.Additionally,forL/L0≤1,the mean fiber strength increases and there is more scatter in the strength distribution as α is increased(cf.,Fig.4).This underscores the importance of accounting for fiber lengths in an appropriate manner.
Similar to the work in Bednarcyk and Arnold(2011),residual stresses in the fiber and matrix were accounted for by simulating a 16 hour stress-free cooldown from the heat treatment temperature to room temperature,followed by a stress-free temperature rise to 650˚C over five minutes.A uniform axial strain in thex1-direction(cf.,Fig.2)was then applied at a rate of 1x10⁻⁴/s.The maximum stress failure criterion was used to dictate axial fiber failures within an RUC where individual fiber strength values were obtained for each fiber in the RUC by generating a random number to represent a probability of fiber failure,which correlates to a given strength value via Eq.1.While the matrix was permitted to yield in accordance with the GVIPS model,ultimate failure(fracture)of the matrix was not considered in the analyses.Five hundred microscale simulations(i.e.,using MAC/GMC)were performed for each of the five RUC architectures to estimate the RUC-averaged mean tensile strengths associated with the stochastic distribution of fiber strengths.As previously mentioned,two possible values of α in Eq.1were considered(i.e.,0,1)in order to bound the effect of fiber segment length on the RUC-averaged tensile strength.This resulted in a total of 5000 distinct microscale simulations performed in this study.Unbiased estimates for the mean and variance of the RUC-averaged tensile strengths were calculated based on a random sampling methodology[M-cKay and Beckman(1979)].An estimate of the standard deviation was obtained by taking the square root of the variance estimate for a given response.Future studies will investigate the use of more complex sampling techniques(e.g.,Latin Hypercube[Helton and Davis(2003)]),particularly if additional material parameters(e.g., fiber volume fraction, fiber/matrix moduli)are allowed to vary.
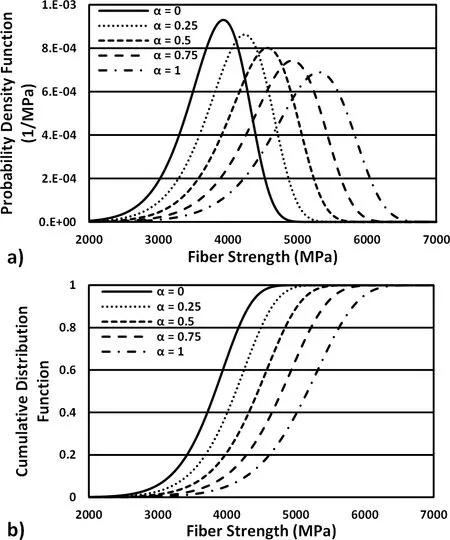
Figure 4:modified Weibull a)PDF and b)CDF as a function of the fiber strength parameter α.
Figure 5 shows a plot of the RUC-averaged composite tensile strengths resulting from a statistical distribution of individual fiber strengths in RUCs with one,four,nine,25,and 49 simulated fibers,respectively,where two different fiber length dependent strength distributions were employed in the microscale simulations(i.e.,α=0;α=1,L/L0=0.025).As would be expected,the simulations that ac-
count for the effect of fiber length on composite strength(α=1)yield a higher mean RUC-averaged strength and more variation in the calculated strengths than simulations where α=0(i.e.,no fiber length dependence).For both cases,when a single- fiber RUC was simulated,a higher mean RUC-averaged strength results.As the number of simulated fibers contained in an RUC was increased,however,the composite strength decreased.Similarly,the variability in the RUC-averaged strength decreased as the number of fibers within the RUC was increased.For the single- fiber RUC,the RUC-averaged strength became highly dependent on the selected fiber strength.This resulted in a higher mean strength value and more variation among the individual RUC-averaged strengths.As the number of simulated fibers was increased,the RUC-averaged strengths became less dependent on the individual fiber strengths.Essentially,the load carried by one fiber at failure was redistributed to the remaining fibers.As the number of simulated fibers was increased,the likelihood of encountering a weaker fiber increased leading to a decrease in the mean RUC-averaged strength.Additionally,if the number of fibers is large,the distributions of fiber strengths within given RUCs become more similar,resulting in less variation in predicted ultimate strengths.For fiber strength distributions where α =0 and α =1,as the number of simulated fibers exceeded 25,the mean value and variation in the RUC-averaged strength asymptotically approached those of the representative volume element(RVE)averaged response.While the use of a 25- fiber RUC led to approximately the same RUC-averaged strength as for a 49- fiber RUC,roughly one-half the computational time was needed.This savings in computational time becomes crucial when performing global-to-local-to-global multiscale simulations.In order to assess the effect of the number of simulations on the calculated mean RUC-averaged strength,an additional 5000 progressive failure simulations were performed for a single- fiber RUC with α=1.The estimated mean fiber strength and associated standard deviation differed by less than 1%from the values obtained using 500 simulations.Hence,a relatively small number of simulations(i.e.,500 per RUC architecture)was sufficient in providing a reasonable approximation of the mean and variance for each RUC.Of course,if additional material parameters(e.g., fiber volume fraction, fiber/matrix moduli)are varied,a larger number of simulations would be needed as well as a more efficient sampling methodology;this will be the topic of future studies.
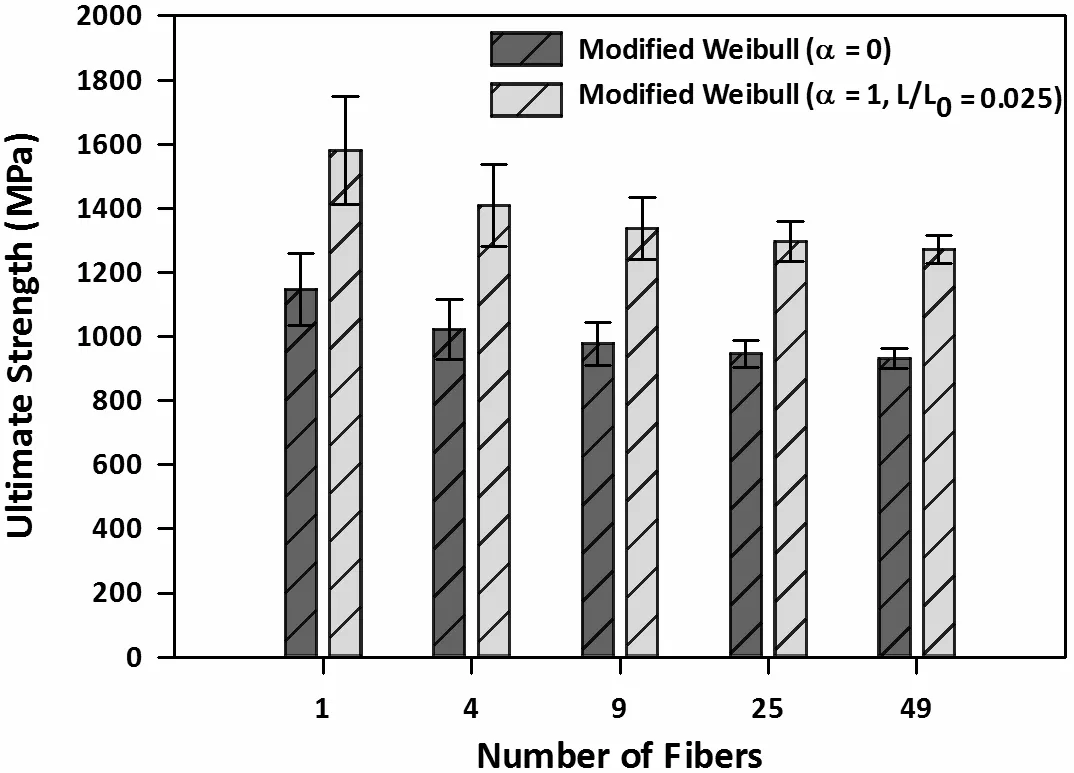
Figure 5:Mean RUC-averaged ultimate strength compared against the number of fibers(at a constant fiber volume fraction)after 500 simulation runs per RUC where the error bars correspond to±one standard deviation from the mean ultimate strength.Eq.1 was used to generate the fiber strength values for α=0 and α=1(L/L0=0.025).
Figures 6a-e contain ten typical(out of 500)RUC-averaged uniaxial stress-strain curves in thex1-( fiber)direction for the single- fiber,four- fiber,nine- fiber,25- fiber,and 49- fiber RUCs,respectively.Similar results were obtained for simulations that accounted for the effect of fiber length on composite strength(α=1).For all of the RUC architectures,the RUC-averaged stress-strain response increased monotonically up until the onset of fiber failure.For RUCs containing only one fiber,once the fiber failed,the RUC-averaged axial stress-strain response displayed a discrete sudden load drop and the remaining stress was carried by the matrix(cf.,Fig.6a).The strain at failure,of course,was a strong function of the assumed fiber strength.A comparison of Fig.6a-e suggests that as the number of fibers is increased,a gradual softening behavior is observed.Furthermore,the difference in the global strain between the first and last fiber failures for a given analysis increased as the number of simulated fibers increased.This makes sense because an increase in the number of fibers raises the probability of encountering both weaker and stronger fibers.Additionally,the variation in the RUC-averaged stress-strain response diminished as the number of fibers increased since the local RUC fiber strength distribution better approximated that for the actual Weibull distribution.By adding more simulated fibers,a more gradual,continuum-like local stress-strain response was observed as each fiber failure occurred over a smaller fraction of the RUC volume.Clearly,understanding the progressive failure behavior associated with a statistical fiber strength distribution at the microscale is crucial to establishing and accurately capturing length scale effects in a robust,computationally efficient multiscale modeling methodology.Because of the computational efficiency of the MAC/GMC code,parametric studies can be performed quickly to assess the in fl uence of RUC architecture and variations in material parameters on the RUC-averaged response.These results can then be used to guide the implementation of such lower length scale calculations within a multiscale analysis framework.
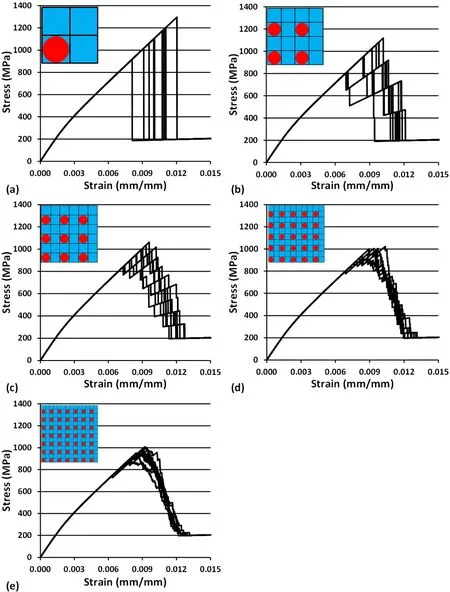
Figure 6:A random sampling of ten stress-strain curves from a batch of 500 simulations for a)single- fiber b)four- fiber c)nine- fiber d)25- fiber and e)49- fiber RUCs using Eq.1 for the α=0 case.
4 Coupled FE/Micromechanics Analyses
While the preceding parametric study investigated the effect of RUC architecture and fiber strength distributions on the RUC-averagedlocalfailure,the ultimate goal of this work is to use RUC deformation and damage evolution at a given integration point within an FE analysis(i.e.,FEAMAC/ABAQUS)to performglobalprogressive failure analyses of a 25% fiber volume fraction SCS-6/TIMETAL 21S dogbone specimen under a monotonic tensile load at 650˚C.Figure 7 contains a schematic of the NASA GRC dogbone specimen[Worthem(1994)].Such specimens were specifically designed to reduce the magnitude of the stress concentration associated with a reduction in cross-sectional area commonly observed in dogbone tensile test specimens.Two FE models were constructed using relatively coarse(2400 elements)or fine(19,200 elements)meshes comprised of eight-noded linear isoparametric brick elements with eight integration points per element.Initial analyses showed that the use of higher-order quadratic elements had a negligible impact on the predicted stress-strain response and failure for this problem.Since FEAMAC assigns an RUC to each FE,MAC/GMC is called over 150,000 timesper time stepfor the fine FE mesh.Hence,the computational efficiency of the GMC[Pindera and Bednarcyk(1999)]is a crucial element in the multiscale FE analyses performed here and is essential to the analysis of more complex structures.
Although an RUC can be used to approximate the RVE-averaged response,an RUC aloneis notnecessarily an RVE.An individual RUC with distinct constituent morphologies and properties can be regarded as an RVE subvolume(sub-RVE).This notion is similar to that developed by Lacy,McDowell,and Talreja(1999),who related the homogenized response over distinct RVE-subvolumes of varying sizes to the RVE-averaged(continuum)material behavior.In the current study,the homogenized material responses at multiple adjacent FE integration points(i.e.,RUCs)can be used to replicate the RVE-averaged behavior.
Similar to the previous local RUC analyses using MAC/GMC,thermal residual stresses in the tensile dog bone specimen were determined from FEAMAC/ABAQUS analyses involving a 16 hour assumed stress-free cooldown from the heat treatment temperature to room temperature.This was followed by a stress-free temperature rise to 650˚C over five minutes.Multiscale progressive failure analyses of the dog bone specimen(cf.Fig.7)were then performed with a constant temperature distribution at 650˚C.The surface nodes corresponding to the machine grips were fixed at one end of the specimen while the surface nodes in the grip region at the opposite end of the specimen were given a longitudinal tensile displacement consistent with an initial elastic strain rate of 1x10⁻⁴/s in the gage section.
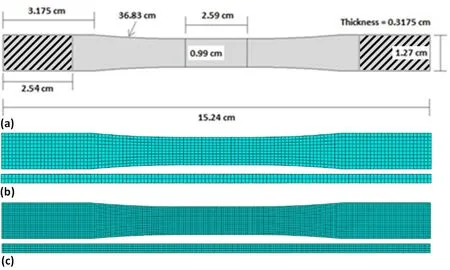
Figure 7:NASA GRC MMC tensile dog bone specimen:a)Specimen geometry with top and side views of the b)coarse 2400 FE mesh and c) fine 19,200 FE mesh.
The coarse(2400 element)FE mesh was initially used to study the effect of RUC architecture and fiber strength parameter(α)on the global composite stress-strain response and failure behavior.In each simulation,RUCs containing single- fiber or four- fiber RUCs were generated(i.e.,only one RUC geometry per simulation).As an aside,special care should be taken to ensure that the actual material volume associated with an RUC does not exceed that of the FEs used in the analysis,i.e.,the RUC-averaged continuum response would occur over a domain larger than the typical element size.Recall in the previous local MAC/GMC analyses,large variations in the RUC-averaged composite strength were observed for both the singleand four- fiber RUCs.Such variability in local properties will manifest itself at the macroscale in multiscale progressive failure analyses.One crucial consideration is to retain a sufficient level of model discretization at each simulation scale to provide accurate results without excessive computational costs.Ninety-six distinct RUCs,each with a different set of individual fiber strength values based upon the modified Weibull CDF(Eq.1),were randomly assigned in equal numbers to individual FEs throughout the coarse FE mesh.In the absence of experimental data to determine α for this material system,the fiber strength parameter was varied between 0≤α≤1 in increments of 0.25.The characteristic lengthL=0.64 mm(L/L0=0.025)corresponded to one-half of the typical FE length in the axial direction for the coarse mesh.Since two FE integration points are present in the length direction,the element half-length(L)was chosen as a length scaling parameter in order to validate the methodology for different FE meshes.Essentially,the length of the simulated fiber segment used to de fine the continuum-averaged FE properties should not exceed the associated FE dimensions.Figure 8 contains an overview schematic of the methodology used in assigning local fiber properties to individual RUCs and then distributing RUCs throughout the FE mesh.This process was performed ten times for each RUC resulting in a total of 100 multiscale FE simulations using the coarse mesh.
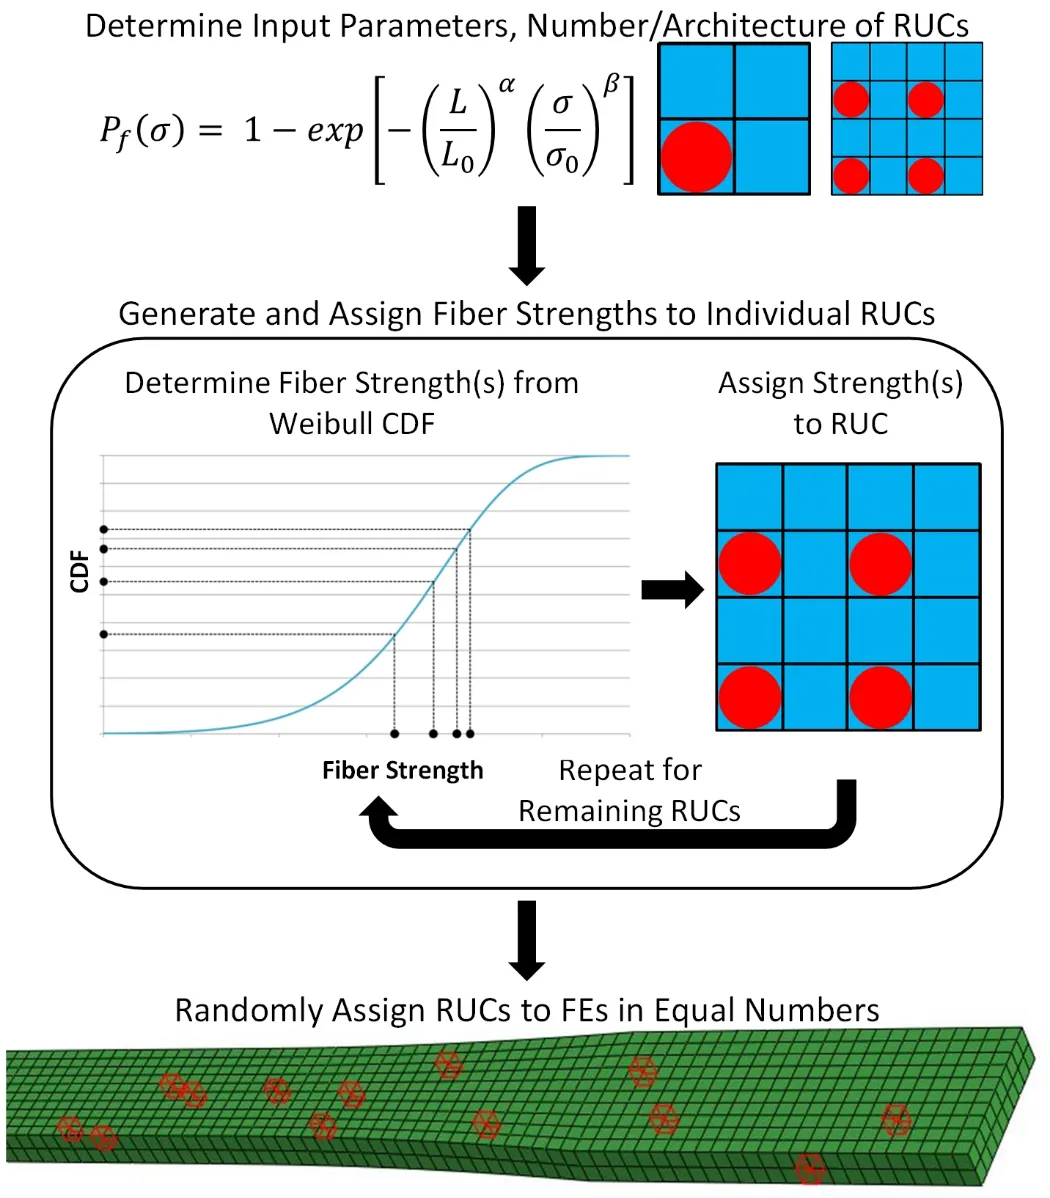
Figure 8:Fiber strength distribution scheme for multiscale analyses.First,the input parameters for the strength distribution and the number/architecture of the RUC are determined.Then the fiber strengths are generated by using a random number generator and solving Eq.1 for the stress,σ.These strengths are then assigned to individual fiber subcells within an RUC,and the process is repeated until all RUCs have been defined.Finally,the RUCs are randomly assigned in equal numbers to FEs within the ABAQUS model.
In order to assess the effect of macroscale FE model symmetry on the global composite stress-strain response and failure behavior,a 300 element one-eighth symmetry FE mesh was generated that maintains the same mesh density as the 2400 FE coarse mesh.Twelve distinct four- fiber RUCs(i.e.,the same FE to RUC ratio as the coarse FE mesh)were distributed throughout this model in the same manner as previously described.The fiber strength parameter,α,was similarly allowed to vary between 0 and 1 in increments of 0.25,and ten simulations were performed for each value of α resulting in a total of 50 additional simulations.The individual strength predictions from each group of ten analyses were averaged together to obtain the macroscale composite strength.
Figure 9 shows the average macroscale composite ultimate strength as a function of the fiber strength parameter for multiscale analyses performed using single- fiber and four- fiber RUCs within the coarse FE mesh and four- fiber RUCs within the one-eighth symmetry FE mesh.As α was increased,the predicted ultimate strength increased proportionally(cf.,Fig.9).This was due to the increasingly pronounced effect of fiber length on strength as α→1(cf.,Fig.4a).In contrast to thelocalMAC/GMC calculations(cf.,Fig.5),the use of a four- fiber RUC within the coarse global FE mesh led to higher ultimate strengths than for a single- fiber RUC for all values of α.In the multiscale failure analyses without global symmetry,as the far- field global strain was increased,local fiber failures initiated in a distributed fashion throughout the specimen in lower length scale RUCs surrounding FE integration points.This process led to failure localization within individual RUCs as well as throughout the global FE mesh,culminating in ultimate specimen failure.If single- fiber RUCs are employed in multiscale analyses,some load shedding within an element and between elements is possible once initial fiber failure occurs.However,after the single fiber fails,the load is rapidly shed to neighboring elements,increasing the likelihood of global damage localization which leads to a reduction in the predicted composite ultimate strength.While the calculated variation in strength values was less than 5%regardless of α,the variation in the composite strengths was less for multiscale calculations performed using a four- fiber RUC than those for the single- fiber RUC.The experimental ultimate strength for this specimen is 973 MPa[Bowman(1999)];this suggests that the actual fiber strength parameter is likely less than unity(α<1).Of course,further testing is required to fully establish an appropriate α value.
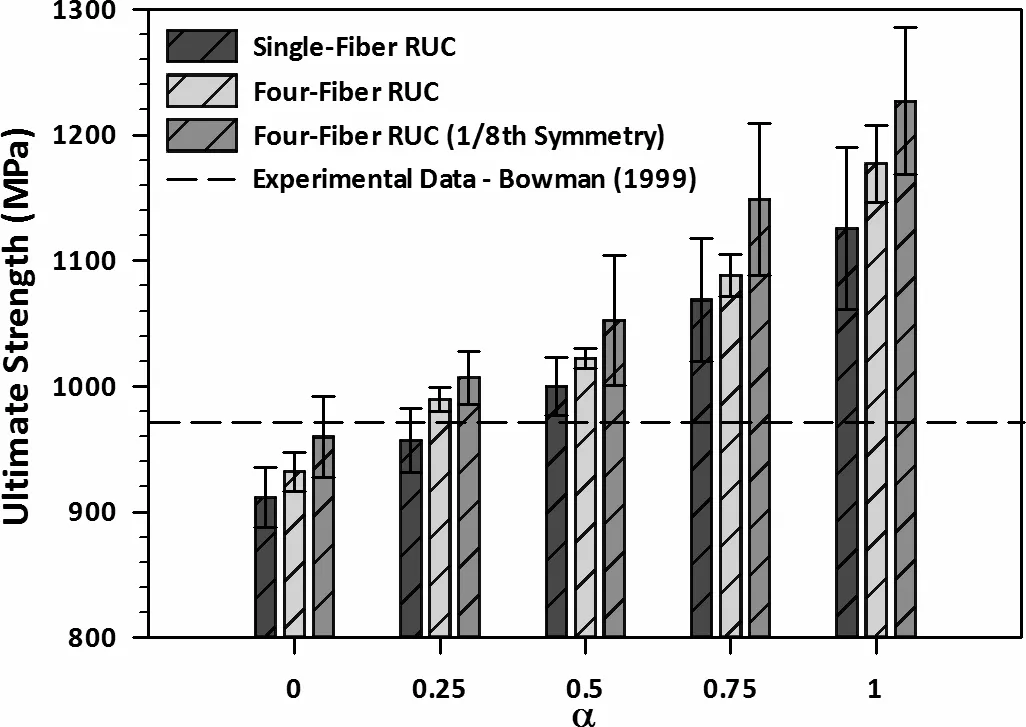
Figure 9:Average macroscale composite ultimate strength as a function of fiber strength parameter(0≤α≤1)over ten ABAQUS/FEAMAC simulations using single- fiber and four- fiber RUCs with the coarse FE mesh and four- fiber RUCs with a one-eighth symmetry coarse mesh.The error bars denote±one standard deviation from the mean.Note that the experimental ultimate strength was 973MPa[Bowman(1999)].
When performing multiscale progressive failure analyses,the use of global symmetry boundary conditions can profoundly impact the calculated global composite stress-strain response and failure behavior.The use of such boundary conditions is questionable when the distribution of constituent morphologies and properties display no such symmetries.To illustrate this point,the use of a one-eighth symmetry coarse FE model led to higher calculated mean ultimate strengths than those obtained using the same FE mesh density where the entire dogbone specimen was simulated(cf.,Fig.9).This increase in mean strength was also somewhat independent of the number of fibers in the RUC.Simulations performed using one-eighth symmetry boundary conditions led to fiber failures that occurred in a symmetric fashion across all symmetry planes.Hence,local bending due to an asymmetric distribution of fiber failures was not permitted.Such eccentric deformation can lead to an elevated local stress state.This serves to lower the ultimate composite strength,which explains why the one-eighth symmetry model yields higher ultimate strengths than the model that does not employ geometric symmetries.Additionally,more variability in the calculated ultimate strengths was observed for the one-eighth symmetry model.Hence,global FE symmetry models can lead to erroneous strength predictions in multiscale progressive failure analyses and should only be used with much caution.For these reasons,use of symmetry boundary conditions in combination with stochastic variations in material properties isnotrecommended.In the following discussion,only results obtained from full geometry models are presented.
The variability in predicted macroscale composite strength can also be seen in the global FE stress-strain responses.For example,Figs.10a and 10b contain plots of the predicted gage section stress-strain curves for α=0.5 from multiscale analyses of the full dogbone specimen performed using both single- fiber and four- fiber RUCs,respectively.Here,the macroscale(continuum-averaged)response was determined from the family of elements comprising the gage section of the specimen.The measured response from Bowman(1999)is also included in the figure.Both sets of calculations reasonably matched the observed specimen behavior,but the variability in predicted strengths was lower for simulations performed using a fourfiber RUC(cf.,Fig.10b)than for a single- fiber RUC(cf.,Fig.10a).As the total number of simulated fibers within a RUC increased,the homogenized composite strength was less dependent on the strengths of individual fibers.The variability in predicted strengths,therefore,decreased with increasing numbers of fibers within the RUC(cf.,Figs.9,10).

Figure 10:Gage section stress-strain response of a longitudinally reinforced SCS-6/TIMETAL 21S MMC for simulations using a)single- fiber RUC and b)fourfiber RUC.The coarse FE mesh was used and RUC fiber subcell strengths were assigned using α=0.5.Results are compared against gage section experimental data obtained from Bowman(1999).
Accounting for the distribution of constituent morphologies and properties across relevant length scales is crucial for predicting progressive damage accumulation and failure behavior of composite materials using multiscale analyses.For example,Fig.11 shows the distribution of failed elements after damage localization has occurred for a series of multiscale FE simulations with different microscale distributions of fiber strengths(including one using one-eighth symmetry boundary conditions).Images of three fractured test specimens are also shown in Fig.11e.A progressive failure analysis was performed where a Bowman(1999)constantfiber strength value was used in each single- fiber RUC throughout the full dogbone specimen mesh(Fig.11a).For this case,although noa priorigeometric symmetries were imposed,a symmetric distribution of local failures occurred.These failures emanated from regions with aslight stress concentrationdue to a decrease in specimen cross-section.These results were consistent with those obtained by Bednarcyk and Arnold(2007),(2011).Multiscale analyses were also performed using a one-eighth symmetry model,where a statistical distribution of microscale fiber strengths was employed within four- fiber RUCs.Multiple failures initiated atpoints of local material weaknessthat varied from simulation to simulation.Damage progression consisted of a series of distributed fiber failures that were mirrored about the eight planes of model symmetry;failed elements from three representative analyses are shown in Figure 11b.In contrast,Figs.11c-d show the distribution of failed elements for each of three multiscale analyses of the full dogbone specimen employing single- fiber and four- fiber RUCs,respectively,where a statistical distribution of fiber strengths was employed.Here, fiber failure localization was distributed throughout the gage section(cf.,Figs.11c and 11d)consistent with the experimentally observed fracture behavior(cf.,Fig.11e).Note that damage/failure was much more widespread for the four- fiber RUC simulations(cf.,Fig.11d)than for the single- fiber RUC simulations(cf.,Fig.11c).Using a single- fiber RUC,the rapid onset of localized failures also led to fewer total fiber failures across the model compared to simulations using four- fiber RUCs.These results demonstrate that the use of global symmetry boundary conditions is inappropriate for progressive failure analyses when the actual spatial distribution of fiber strengths display no such symmetries.Such global symmetry models can lead to higher strength predictions as well as unrealistic failure patterns.How this result impacts findings of Blassiau,Thionnet,and Bunsell(2008)is unclear.
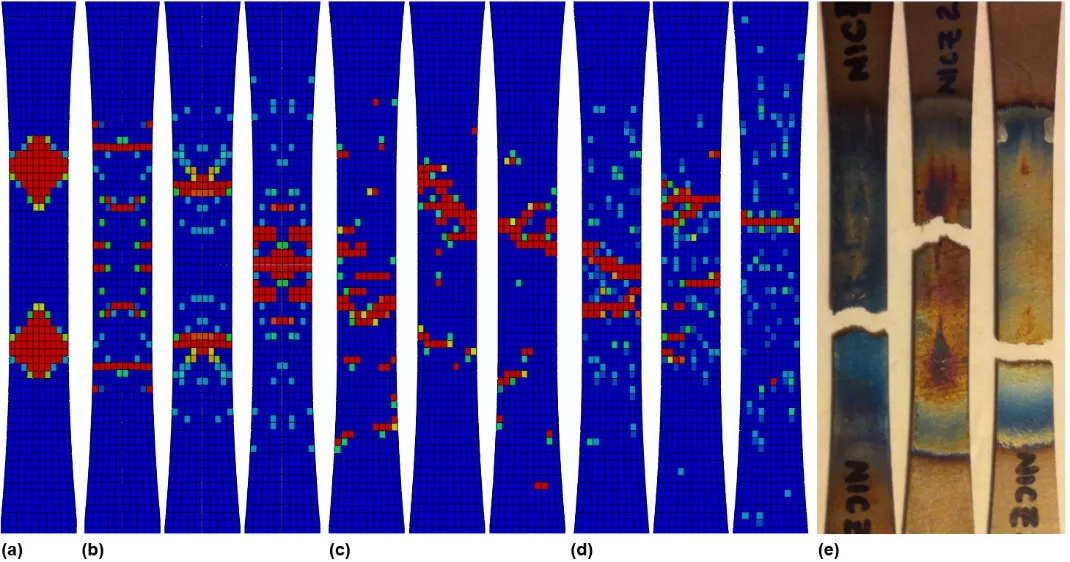
Figure 11:Distribution of fiber failures obtained using a coarse FE model(α=0.5)a)Full dogbone specimen employing a single- fiber RUC with a constant fiber strength.b)One-eighth symmetry dogbone specimens employing four- fiber RUCs with a distribution of fiber strengths.c)Full dogbone specimens employing singlefiber RUCs with a distribution of fiber strengths.d)Full dogbone specimens employing four- fiber RUCs with a distribution of fiber strengths;blue represents no failure and red indicates complete fiber subcell failure for a given element.e)Experimentally observed failure behavior.
For illustration purposes,ten additional multiscale progressive failure analyses using a coarse FE mesh were performed in which a distribution of fiber strengths(α=0.5)were employed within 25- fiber RUCs.This RUC was used since it led to RUC-averaged ultimate strengths that were somewhat independent of the number of simulated fibers(cf.,Fig.5).Predictions of the macroscale composite stress-strain response and ultimate strength from these analyses were compared to a similar analysis where the local fiber strength was held constant throughout the mesh(cf.,Fig.11a).In the constant strength analysis,a fiber strength corresponding to the mean value from the Weibull fiber strength distribution was used.The predicted macroscale composite strength obtained using a constant local fiber strength was markedly different from those from analyses where a spatial distribution of local fiber strengths was simulated.Figure12 contains the predicted uniaxial stress-strain responses obtained using a constant local fiber strength and statistically varying local fiber strength models.As can be seen from the figure,use of a constant local fiber strength led to a roughly 25.5%higher estimate of the macroscale composite strength than the mean strength from the locally varying fiber strength simulations.Moreover,the constant local fiber strength simulation resulted in a series of element failures emanating from mild stress concentrations in the transition region between the grips and gage section(cf.,Fig.11a).These results were inconsistent with experimental observations where the actual specimens tended to fail within the gage section(cf.,Fig.11e).In contrast,the predicted failure loca-tions obtained using spatially varying local fiber strengths predominately occurred within the gage section.These results underscore the importance of accounting for spatial variations in the distributions of fiber strengths when performing multiscale analyses.
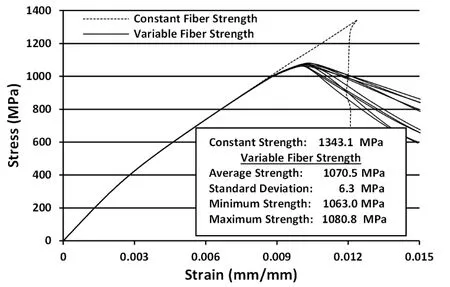
Figure 12:Gage section stress-strain response of a longitudinally reinforced SCS-6/TIMETAL 21S MMC for simulations using 25- fiber RUCs with the coarse FE mesh and α=0.5.
5 Local/Global Discretization Considerations
The preceding multiscale calculations investigated the effect of variations in the local distribution of fiber strengths on global MMC composite failure based upon a fixed level of macroscale discretization,i.e.,a relatively coarse FE mesh was used to simulate the global response.One key element in the development of robust,computationally-efficient multiscale materials models is to assess the appropriate level of model discretization at each relevant length scale that leads to tractable yet accurate macroscale solutions.To illustrate this point,consider an arbitrary SCS-6/TIMETAL 21S MMC subvolume containing 16 uniformly distributed aligned fibers.The continuum-level material response of this subvolume may be determined from multiscale models that employ different levels of discretization at the macroscale and microscale,respectively.For example,using eight-noded linear isoparametric elements(each with eight integration points),the 16- fiber subvolume could be idealized usingoneFE to simulate the global response and afour- fiber RUCat each integration point to simulate the local axial response using MAC/GMC(cf.,Fig.13).Alternatively,the material subvolume could be idealized usingeightFEs at the macroscale and asingle- fiberRUC surrounding each FE integration point(cf.,Fig.13).Of course,the latter multiscale discretization results in an eight-fold increase in the number of FEs,and a corresponding increase in model degrees-offreedom at the macroscale.Both multiscale discretizations were used to perform multiscale progressive failure analyses of the NASA SCS-6/TIMETAL 21S dogbone specimen,where relatively coarse(2400 element)and fine(19,200 element)global FE models(cf.,Fig.7)were used in conjunction with four-and single- fiber RUCs,respectively.The FE to RUC ratio was held constant for each of these simulations;96 RUCs were used for the coarse FE mesh while 768 RUCs were used for the fine FE mesh.

Figure 13:Comparison of mesh discretization at different scales where a constant simulation volume is maintained.The first case combines a coarse(2400 FE)mesh with a four- fiber RUC while the second case combines a fine(19,200 FE)mesh(i.e.,double the mesh density)with a single- fiber RUC.
Analyses were performed using each discretization where the local fiber strengths were assigned to individual subcells in the same manner as before using the modified Weibull CDF(Eq.1)with the fiber strength parameter α=0.5.The characteristic fiber length(L)in Eq.1 corresponded to half of the average FE dimension in the axial direction for the coarse(L=0.64 mm)and fine(L=0.32 mm)meshes,respectively.Note that as the characteristic length(L)was reduced for the fine FE mesh,and the mean fiber strength and variation in the associated distribution of fiber strengths increased slightly(cf.,Fig.14).Ten multiscale simulations were performed for each multiscale discretization/local fiber strength parameter combination,and the average macroscale ultimate composite strength was determined for each case.
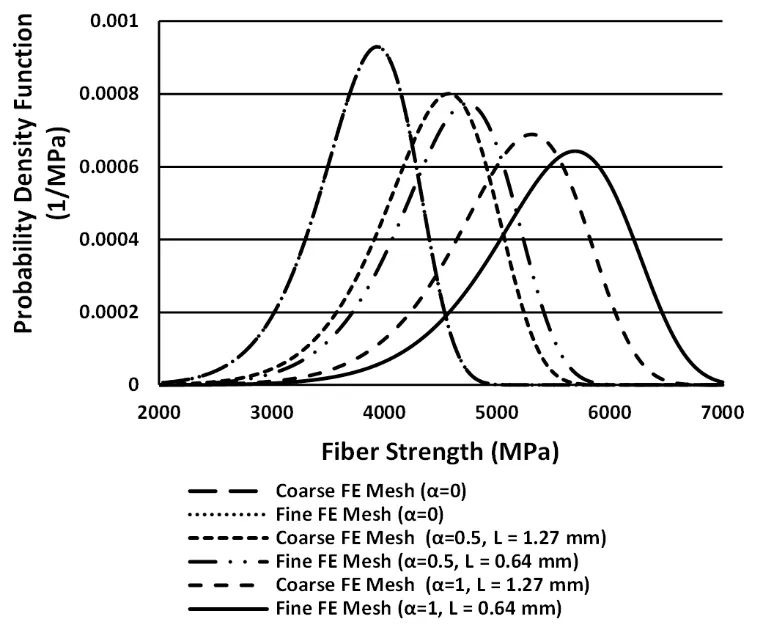
Figure 14:modified Weibull PDFs that illustrate the effect of the length scale(L/L0)for both the coarse and fine FE meshes.Note that for the α=0 case,the fiber strength distribution no longer depends on length,but when α=0.5 and 1,the length scale has a noticeable effect on the strength distribution.
Figure 15 contains plots of themacroscalestress-strain responses from each of ten representative multiscale analyses performed using the coarse mesh/four- fiber RUC and fine mesh/single- fiber RUC discretizations.The analyses performed using the fine mesh/single- fiber RUC yielded an average ultimate composite strength of 1059.9 MPa(standard deviation,5.3 MPa).The coarse mesh/four- fiber RUC analyses produced an average ultimate composite strength of 1022.3 MPa(standard deviation,8.0 MPa).
Figure 16 shows the distribution of FEs with failed fibers from three separate analyses obtained using the fine mesh/single- fiber RUC discretization for α=0.5.The distribution of failure locations is similar to that found using a coarse mesh/fourfiber RUC discretization(cf.,Fig.11d).These results suggest that both multiscale discretizations lead to similar estimates of the macroscale composite material behavior.The solution time for the fine mesh/single- fiber RUC analyses,however,was roughlynine timesgreater than for the coarse mesh/four- fiber RUC analyses without a signi fi cant difference in calculated results.
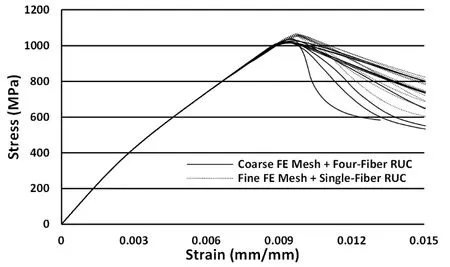
Figure 15:Gage section stress-strain response of a longitudinally reinforced SCS-6/TIMETAL 21S MMC for multiscale simulations(α=0.5)using the coarse FE mesh with a four- fiber RUC and the fine FE mesh with a single- fiber RUC.
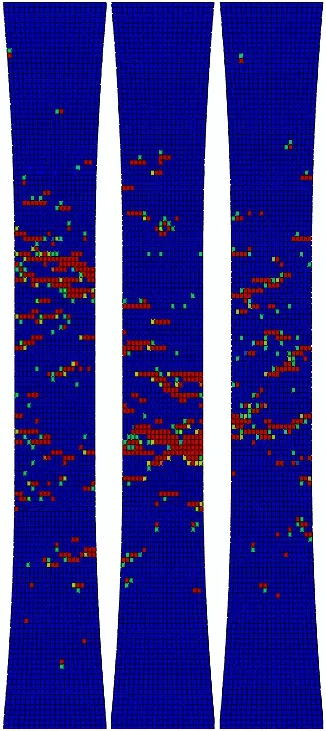
Figure 16:Distribution of fiber failures within the fine mesh after the onset of localization for three single- fiber RUC distributed fiber strength simulations(α=0.5)where blue represents no failure and red indicates complete fiber subcell failure for a given element.Each illustration denotes the outer layer of elements in a separate simulation.
Clearly,the model discretization at a specific length scale can have a profound effect on the computational costs associated with multiscale simulations.Since the solution algorithm implemented in the GMC is substantially more efficient than that for traditional FE analyses[Pindera and Bednarcyk(1999)],use of a more highly re fined microscale model in combination with a coarser global FE mesh led to more computationally effective solutions for this problem.For similar reasons,coupled MAC/GMC-FE multiscale analyses may be much more computationally efficient for a given problem than analogous multiscale analyses that are purely FE based(i.e.,FE2[Feyel and Chaboche(2000);Feyel(2003)]).In general,the optimal discretization at each relevant length scale is likely to be problem dependent.For instance,problems with a global stress gradient(e.g.,open-hole composites or full scale structures),may require a different discretization than that used here.These sorts of issues must be addressed in order to fully exploit the bene fi ts of multiscale analyses.
6 Summary and Conclusions
A parametric study investigating the effect of a statistical fiber strength distribution and repeating unit cell(RUC)architecture on the predicted composite ultimate strength was performed using the computationally efficient code MAC/GMC for a SCS-6/TIMETAL 21S material system.Progressive failure at an elevated temperature of 650˚C was simulated at the microscale by assigning strengths to individual fibers within an RUC based upon a modified Weibull cumulative distribution function(CDF),which accounts for the effect of fiber length on the probability of failure.By increasing the number of fibers in the RUC,a more gradual,continuum-like stress-strain behavior was observed.
Global multiscale progressive failure analyses of a 25% fiber volume fraction SCS-6/TIMETAL 21S tensile dogbone specimen at 650˚C were performed by implementing a modified Weibull CDF of fiber strengths within FEAMAC/ABAQUS.Fiber strengths were appropriately assigned to individual fibers within RUCs corresponding to specific finite elements(FEs)in order to assess the effect of a spatial distribution of local fiber strengths on the predicted macroscale composite stress strain response and failure.The composite ultimate strengths and distribution of failure locations(predominately within the gage section)reasonably matched the experimentally observed failure behavior.Moreover,these analyses suggest that the use of models that exploit global geometric symmetries biases the character-is tics of failure and are thus inappropriate for cases where the actual distribution of local fiber strengths displays no such symmetries.This issue has not received much attention in the literature.Additionally,the discretization at a specific length scale can have a profound effect on the computational costs associated with multiscale simulations.Multiscale analyses were performed using coarse FE mesh/four- fiber RUC and fine FE mesh/single- fiber RUC discretizations.Both multiscale discretizations led to similar estimates of the macroscale composite material behavior and failure.The solution time for the fine mesh/single- fiber RUC analyses,however,was roughlyninetimes greater than for the coarse mesh/four- fiber RUC analyses.Clearly,the model discretization at a specific length scale can have a profound effect on the computational costs associated with multiscale simulations.Understanding these issues is crucial to the development of robust multiscale material models that yield accurate yet tractable results.
Acknowledgement:This was work performed as part of a NASA Graduate Student Researchers Program fellowship.Trenton M.Ricks and Thomas E.Lacy,Jr.would like thank Dr.Mark Kankam,the University Affairs Of fi cer for the NASA Glenn Research Center,for his support throughout the duration of the fellowship.
ABAQUS Uni fi ed FEA,(2013):December 29,2013.
Aboudi,J.(1991):Mechanics of Composite Materials:A Uni fi ed Micromechanical Approach,Elsevier.
Aboudi,J.(1995):Micromechanical Analysis of Thermo-Inelastic Multiphase Short-Fiber Composites.Compos.Eng.,vol.5,no.7,pp.839-850.
Aboudi,J.(1996):Micromechanical Analysis of Composites by the Method of Cells-Update.App.Mech.Rev.,vol.49,no.10S,pp.S83-S91.
Aboudi,J.(2004):The Generalized Method of Cells and High-Fidelity Generalized Method of Cells Micromechanical Models-A Review.Mech.Adv.Mat.Struct.,vol.11,no.4-5,pp.329-366.
Aboudi,J.;Arnold,S.M.;Bednarcyk,B.A.(2012):Micromechanics of Composite Materials:A Generalized Multiscale Analysis Approach,Butterworth-Heinemann.
Andersons,J.;Joffe,R.;Hojo,M.;Ochiai,S.(2002):Glass Fibre Strength Distribution Determined by Common Experimental Methods.Compos.Sci.Tech.,vol.62,no.1,pp.131-145.
Andersons,J.;Spamins,E.;Joffe,R.;Wallstrom,L.(2005):Strength Distribution of Elementary Flax Fibres.Compos.Sci.Tech.,vol.65,no.3-4,pp.693-702.
Arnold,S.M.Saleeb,A.F.(1994):On the Thermodynamic Framework of Generalized Coupled Thermoelastic-Viscoplastic-Damage Modeling.Int.J.Plast.,vol.10,no.3,pp.263-278.
Arnold,S.M.;Saleeb,A.F.;Castelli,M.G.(1996):A Fully Associative,Nonisothermal,Non-Linear Kinematic,Uni fi ed Viscoplastic Model for Titanium Based Matrices.Life Prediction Methodology for Titanium Matrix Composites.Johnson,W.S.,Larsen,J.M.,and Cox,B.N.American Society for Testing and Materials.
Baxevanakis,C.;Jeulin,D.;Valentin,D.(1993):Fracture Statistics of Single-Fibre Composite Specimens.Compos.Sci.Tech.,vol.48,no.1-4,pp.47-56.
Bednarcyk,B.A.Arnold,S.M.(2001):Micromechanics-Based Deformation and Failure Prediction for Longitudinally Reinforced Titanium Composites.Compos.Sci.Tech.,vol.61,no.5,pp.705-729.
Bednarcyk,B.A.Arnold,S.M.(2002):MAC/GMC 4.0 User’s Manual-Keywords Manual.NASA/TM 2002-212077/VOL2.
Bednarcyk,B.A.Arnold,S.M.(2007):A Framework for Performing Multiscale Stochastic Progressive Failure Analysis of Composite Structures.NASA/TM2007-214694.
Bednarcyk,B.A.Arnold,S.M.(2011):A Multiscale,Nonlinear,Modeling Framework Enabling the Design and Analysis of Composite Materials and Structures.Models,Databases,and Simulation Tools Needed for the Realization of Integrated Computational Materials Engineering.Arnold,S.M.and Wong,T.ASM International.
Beyerlein,I.J.Phoenix,S.L.(1996):Statistics for the Strength and Size Effects of Microcomposites with Four Carbon Fibers in Epoxy Resin.Compos.Sci.Tech.,vol.56,no.1,pp.75-92.
Blassiau,S.;Thionnet,A.;Bunsell,A.R.(2006a):Micromechanisms of Load Transfer in a Unidirectional Carbon Fibre-Reinforced Epoxy Composite Due to Fiber Failures.Part 1:Micromechanisms and 3D Analysis of Load Transfer:The Elastic Case.Compos.Struct.,vol.74,no.3,pp.303-318.
Blassiau,S.;Thionnet,A.;Bunsell,A.R.(2006b):Micromechanisms of Load Transfer in a Unidirectional Carbon Fibre-Reinforced Epoxy Composite Due to Fiber Failures.Part 2:In fl uence of Viscoelastic and Plastic Matrices on the Mechanisms of Load Transfer.Compos.Struct.,vol.74,no.3,pp.319-331.
Blassiau,S.;Thionnet,A.;Bunsell,A.R.(2008):Micromechanisms of Load Transfer in a Unidirectional Carbon Fibre-Reinforced Epoxy Composite Due to Fiber Failures.Part 3:Multiscale Reconstruction of Composite Behavior.Com-pos.Struct.,vol.83,no.3,pp.312-323.
Bowman,C.L.:(1999):Experimentation and Analysis of Mechanical Behavior Modi fi cation of Titanium Matrix Composites Through Controlled Fiber Placement,Case Western University,Department of Materials Science and Engineering.
Curtin,W.A.(1991):Theory of Mechanical Properties of Ceramic-Matrix Composites.J.Am.Cer.Soc.,vol.74,no.11,pp.2837-2845.
Curtin,W.A.(1993):Ultimate Strengths of Fibre-Reinforced Ceramics and Metals.Compos.,vol.24,no.2,pp.98-102.
Curtin,W.A.(2000):Tensile Strength of Fibre-Reinforced Composites III.Beyond the Traditional Weibull Model for Fiber Strengths.J.Compos.Mat.,vol.34,no.15,pp.1301-1332.
Feyel,F.Chaboche,J.-L.(2000):FE2Multiscale Approach for Modelling the Elastoviscoplastic Behavior of Long Fibre SiC/Ti Composite Materials.Comp.Meth.Appl.Mech.Eng.,vol.183,no.3-4,pp.309-330.
Feyel,F.(2003):A Multilevel Finite Element Method(FE2)to Describe the Response of Highly Non-Linear Structures Using Generalized Continua.Comp.Meth.Appl.Mech.Eng.,vol.192,no.28-30,pp.3233-3244.
Foster,G.;Ibnabdeljalil,M.;Curtin,W.A.(1998):Tensile Strength of Titanium Matrix Composites:Direct Numerical Simulations and Analytic Models.Int.J.Sol.Struct.,vol.35,no.19,pp.2523-2536.
Graham-Brady,L.L.;Arwade,S.R.;Corr,D.J.;Gutierrez,M.A.;Breysse,D.;Grigoriu,M.;Zabaras,N.(2006):Probability and Materials:From Nano-to Macro-Scale:A Summary.Prob.Eng.Mech.,vol.21,no.3,pp.193-199.
Harlow,D.G.Phoenix,S.L.(1978):The Chain-of-Bundles Probability Model for the Strength of Fibrous Materials I:Analysis and Conjectures.J.Compos.Mat.,vol.12,no.2,pp.195-214.
Helton,J.C.Davis,F.J.(2003):Latin Hypercube Sampling and the Propagation of Uncertainty in Analyses of Complex Systems.Rel.Eng.Sys.Saf.,vol.81,no.1,pp.23-69.
Hitchon,J.W.Phillips,D.C.(1979):The Dependence of the Strength of Carbon Fibres on Length.Fib.Sci.Tech.,vol.12,no.3,pp.217-233.
Lacy,T.E.;McDowell,D.L.;Talreja,R.(1999):Gradient Concepts for Evolution of Damage.Mech.Mat.,vol.31,no.12,pp.831-860.
Landis,C.M.;Beyerlein,I.J.;McMeeking,R.M.(2000):Micromechanical Simulation of the Failure of Fiber Reinforced Composites.J.Mech.Phys.Sol.,vol.48,no.3,pp.621-648.
Lekou,D.J.Philippidis,T.P.(2008):Mechanical Property Variability in FRP Laminates and Its Effect on Failure Prediction.Compos.B,vol.39,no.7-8,pp.1247-1256.
Mall,S.;Fecke,T.;Foringer,M.A.(1998):Titanium Matrix Composites:Mechanical Behavior,Technomic Publishing Co.
McKay,M.D.Beckman,R.J.(1979):A Comparison of Three Methods for Selecting Values of Input Variables in the Analysis of Ouput from a Computer Code.Technom.,vol.21,no.2,pp.239-245.
Naito,K.;Yang,J.M.;Tanaka,Y.;Kagawa,Y.(2012):The Effect of Gauge Length on Tensile Strength and Weibull Modulus of Polyacrylonitrile(PAN)and Pitch-Based Carbon Fibers.J.Mat.Sci.,vol.47,no.2,pp.632-642.
Oh,K.P.(1979):A Monte Carlo Study of the Strength of Unidirectional Fiber-Reinforced Composites.J.Compos.Mat.,vol.13,no.4,pp.311-328.
Okabe,T.;Takeda,N.;Kamoshida,Y.;Shimizu,M.;Curtin,W.A.(2001):A 3D Shear-Lag Model Considering Micro-Damage and Statistical Strength Prediction of Unidirectional Fiber-Reinforced Composites.Compos.Sci.Tech.,vol.61,no.12,pp.1773-1787.
Okabe,T.Takeda,N.(2002):Size Effect on Tensile Strength of Unidirectional CFRP Composites-Experiment and Simulation.Compos.Sci.Tech.,vol.62,no.15,pp.2053-2064.
Padgett,W.;Durham,S.;Mason,A.(1995):Weibull Analysis of the Strength of Carbon Fibers Using Linear and Power Law Models for Length Effect.J.Compos.Mat.,vol.29,no.14,pp.1873-1884.
Paley,M.Aboudi,J.(1992):Micromechanical Analysis of Composites by the Generalized Cells Model.Mech.Mat.,vol.14,no.2,pp.127-139.
Pindera,M.J.Bednarcyk,B.A.(1999):An efficient Implementation of the Generalized Method of Cells for Unidirectional,Multi-Phased Composites with Complex Microstructures.Compos.B,vol.30,no.1,pp.87-105.
Rosen,B.W.(1964):Tensile Failure of Fibrous Composites.AIAA J.,vol.2,no.11,pp.1985-1991.
Shen,L.Xu,X.F.(2010):Multiscale Stochastic Finite Element Modeling of Random Elastic Heterogeneous Materials.Comput.Mech.,vol.45,no.6,pp.607-621.
Sriramula,S.Chryssanthopoulos,M.K.(2009):Quantification of Uncertainty Modeling in Stochastic Analysis of FRP Composites.Compos.A,vol.40,no.11,pp.1673-1684.
Sullivan,R.W.Arnold,S.M.(2011):An Annotative Review of Multiscale Mod-eling and its Application to Scales Inherent in the Field of ICME,Models,Databases,and Simulation Tools Needed for the Realization of Integrated Computational Materials Engineering.Arnold,S.M.and Wong,T.ASM International.
Watson,A.Smith,R.(1985):An Examination of Statistical Theories for Fibrous Materials in the Light of Experimental Data.J.Mat.Sci.,vol.20,no.9,pp.3260-3270.
Weibull,W.(1951):A Statistical Distribution Function of Wide Applicability.J.Appl.Mech.,vol.18,no.pp.293-297.
Worthem,D.W.(1994):Flat Tensile Specimen Design for Advanced Composites.NASA Contractor Report 185261.
Xu,X.F.;Chen,X.;Shen,L.(2009):A Green-Function-Based Multiscale Method for Uncertainty Quantification of Finite Body Random Heterogeneous Materials.Comput.Struct.,vol.87,no.21-22,pp.1416-1426.
Zweben,C.(1968):Tensile Failure of Fiber Composites.AIAA J.,vol.6,no.12,pp.2325-2331.
杂志排行
Computers Materials&Continua的其它文章
- Surface/interface Energy Effect on Electromechanical Responses Around a Nanosized Elliptical Inclusion under Far- field Loading at an Arbitrary Angle
- Graded Dielectric Inhomogeneous Planar Layer Radome for Aerospace Applications
- On the Homogenization Analysis of Electromagnetic Properties for Irregular Honeycombs
