ANN Model to Predict Fracture Characteristics of High Strength and Ultra High Strength Concrete Beams
2014-04-14YuvarajRamachandraMurthyNageshIyerSekarandPijushSamui
Yuvaraj P,A Ramachandra Murthy,Nagesh R Iyer,S.K.Sekar and Pijush Samui
1 Introduction
Concrete has been one of the most commonly used construction materials in the world.One of the major problems civil engineers face today is concerned with preservation,maintenance and retrofitting of structures.The historical development of concrete material may be marked and divided into several stages.The first is the traditional normal strength concrete followed by high strength concrete,high performance concrete and reactive powder concrete/Ultra high strength concrete(UHSC).Since UHSC is a relatively new material,the fracture behaviour of this material is not well understood[Richard and Cheyrezy(1994,1995);Mingzhe et al.(2010);Goltermann et al.(1997)].Concrete is a quasi-brittle material,which means its fracture process zone(FPZ)size is not small compared with the typical specimen or structural dimension.Classical linear elastic fracture mechanics(LEFM)approach is unable to predict the progressive failure of concrete specimens due to the presence of large FPZ of variable size ahead of the crack tip and the cohesive stress transferred within FPZ of the quasi-brittle materials like concrete[Bazant(2000)].The LEFM based modeling approach assumes that once a crack propagates by a distance,this part of the material loses its load carrying capacity suddenly and completely.The complex nonlinear phenomena that take place in FPZ can be idealized and approximated using nonlinear fracture approaches to predict the localized physical behaviour in the vicinity of a crack and at the crack tip.Nonlinear fracture mechanics based approach recognizes that FPZ exists in front of the crack tip,in which the material can still carry loadings by mechanisms such as aggregate interlocking,surface friction and material bonding.As the crack propagates and opens,the material in FPZ softens with gradual energy dissipation,which can be accurately modeled by the fictitious crack model.The crack propagation direction is assumed to be perpendicular to the direction of the maximum stress at the cohesive crack tip.The cohesive crack model is one of such simplified nonlinear fracture models that can simulate satisfactorily the behaviour of concrete fracture.Inspired by the early stage of development of the fracture models[Barenblatt(1959);Dugdale(1960);Hillerborg et al.(1976)]initially applied cohesive crack method(or fictitious crack model)as a suitable nonlinear model for mode I fracture to simulate the softening damage of concrete structures.
An artificial neural network(ANN)is a mathematical model developed from the inspiration of biological neural networks.ANN consists of group of artificial neurons interconnected to each other,and it processes information using a connectionist approach to computation.ANN model for predicting fracture toughness and tensile strength was successfully demonstrated by Mohammed and Sudhakar(2002).Ince(2004)predicted facture parameters of concrete by artificial neural networks and compared the results of two-parameter model(TPM)and ANN.ANN was proven to predict the evaluation of parameters affecting failure load and displacement of RC buildings[Hakan Arslan(2009)].Back propagation training method was found to be appropriate when non-linear variables are involved[Rafat et al.(2011)].Dayal and Choudhury(2011)discussed the aspects of smart crack detection methodologies in various structures using ANN,fuzzy logic neural network,fuzzy system,hybrid neuro genetic algorithm and artificial intelligence.In estimation of the seismic-induced demands on column splices,neural network models were used to predict the response behaviour satisfactorily[Bulent Akbas et al.(2011)].This paper presents the details of characterization and casting of high strength and ultra high strength concrete beams,formation of ANN model to evaluate fracture characteristics and failure load has been described.
2 Experimental Investigations
Three different mixes designated as HSC,HSC1 and UHSC are characterized and their mix proportions have been derived by using appropriate method and several trials.For HSC,the ingredient materials are Portland cement,coarse aggregate,fine aggregate and water,whereas for HSC1,the materials are Portland cement,silica fume,quartz sand,high range water reducer,water and steel fibers.Further,for UHSC,the materials are Portland cement,silica fume,quartz sand,quartz powder,high range water reducer,water and steel fibers.The main difference between HSC1 and UHSC is the absence of quartz powder in the case of HSC1 mix.Bureau of Indian Standard code(IS:10262-2009)has been used for HSC mix design,whereas HSC1 and UHSC mixes have been designed based on the limited literature available and several trials.Several trials have been attempted before arriving at a final mix design.The final mix proportions and ratio obtained are given in Tables 1 and 2.
2.1Specimen Preparation
Preparation,demoulding and curing of HSC specimens is as usual,whereas the procedure for specimen preparation for HSC1 and UHSC is outlined below.
•A Hobart mixer machine(15 kg capacity)or Eirich type mixer(150 liter capacity)is used to mix the concrete mixtures.
•Well mixed dry binder powder is then slowly poured in to the bowl while the mixer is rotating at a slow speed.
•The speed of the mixer is increased and the mixing process is continued for about two to three minutes.
•Water is then added.
•Additional mixing is performed at this speed until a uniform mixture is achieved.
•Fibers are added after mixing all the ingredients such as cement,quartz sand,quartz powder and silica fume with water and superplasticizer.
•Fresh mixture is poured in to the moulds using a steel scoop.
•Compaction is done by placing the filled moulds on a laboratory table vibrator for about 2 minutes.
•The specimens are demoulded after a lapse of 24 hours.
•Immediately after demoulding,the specimens are fully immersed in potable water at room temperature for 2 days.After 2 days of normal water curing,the specimens are placed in a autoclave and maintained at 90˚C for 2 days.Further,the specimens are placed in oven and maintained at 200˚C for 1 day followed by autoclave curing.
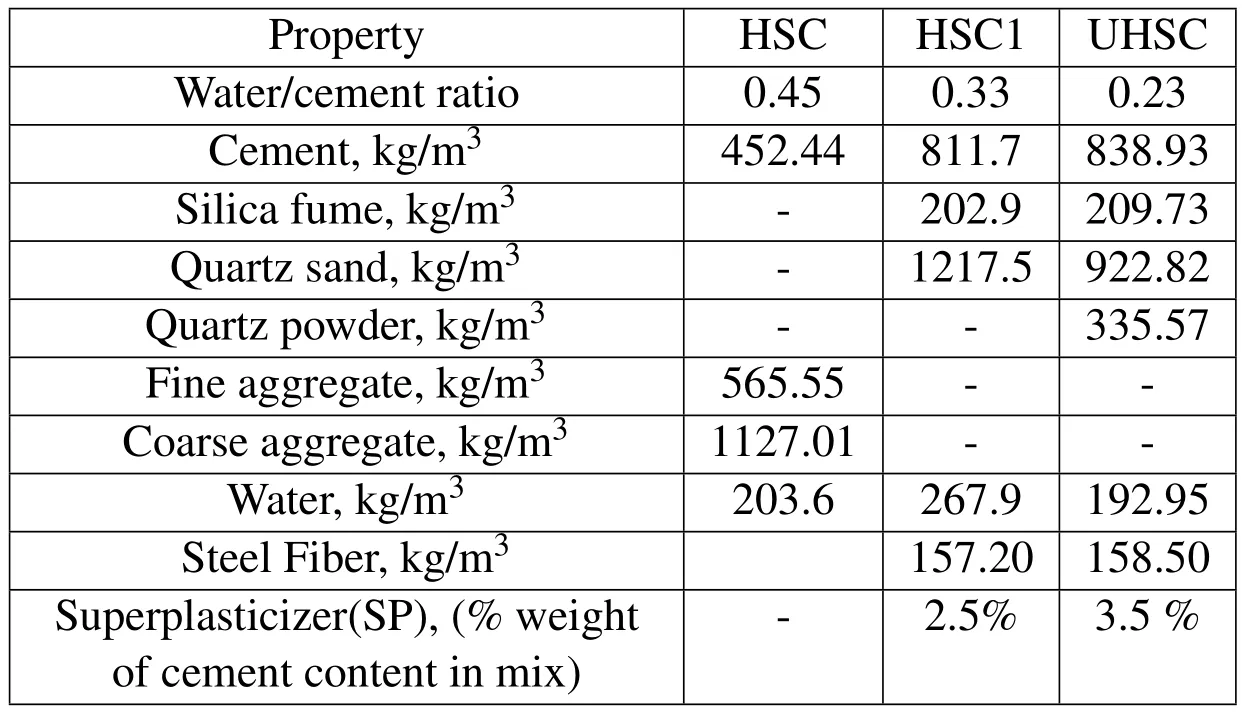
Table 1:Mix Proportions for HSC,HSC1 and UHSC.

Table 2:Mix of HSC,HSC1 and UHSC.
Mechanical Properties
Various mechanical properties such as compressive strength,spilt tensile strength of HSC,HSC1 and UHSCmix at 28 days are shown in Table 3.From Table 3,it can be observed that the split tensile strength for the case of HSC is 4.0 MPa.It is about 7%of compressive strength.In the case of HSC1,the split tensile strength is about 18%of compressive strength.The increase in strength is large compared to HSC.The increase in strength may be due to various sizes of ingredients and steel fibres.Further,it can be observed from Table 3 that UHSC has high compressive strength and tensile strength.The high strengths can be attributed to the contribution at different scales viz.,at the meso scale due to the fibers and at the micro scale due to the close packing of grains,which is on account of good grading of the particles.

Table 3:Mechnanical properties of HSC,HSC1 and UHSC.
Casting of Beams
Different beams,namely,small,medium and large size with various notch depths have been cast to study the fracture behaviour.The experimental setup consists of MTS 2500 kN capacity servo hydraulic UTM with online data acquisition system.All the specimens have been tested under displacement control at a rate of 0.02 mm/min.The mid-span downward displacement is measured using linear variable displacement transducer(LVDT),placed at center of the specimen under bottom of the beam.A clip gauge is used to measure the crack mouth opening displacement(CMOD).The data acquisition records load,CMOD,mid-span displacement and time.Appropriate load cells have been used for testing.
3 Fracture Characteristics
Fracture characteristics such as fracture energy(GF)based on work-of fracture,fracture toughness(KIC)and CTODc-Crack tip opening displacement for HSC,HSC1 and UHSC specimen have been estimated based on the experimental observations.Brief description on the evaluation of GF,KICand CTODChas been outlined below.
3.1Fracture energy(G F)
In general,concrete structures contain voids and flaws.These flaws grow and propagate leading to failure.The fracture energy is one of the important parameterin the analysis of cracked concrete structures.Fracture energy,GFis an important fracture mechanic parameter to describe the resisting properties of concrete fracture.In fact the fracture energy can be seen as a measure for the ductility of concrete and it is considered as a material parameter.The fracture energy,GFis defined as the amount of energy necessary to create a crack of unit surface area projected in a plane parallel to the crack direction.
The area under the load-displacement plot is considered as the work of fracture(WF)and is defined as

where“w”is the crack mouth opening displacement,WFis the work of fracture,P is the applied load.
According to RILEM method of Hillerborg,the fracture energy GFis the average energy given by dividing the total work of fracture by the projected fracture area(RILEM 1985,Karihaloo 1995).In case of a specimen of depth d and initial crack length a0,the fracture energy is given by

d=Depth of the beam,a0=Initial crack length,t=Thickness of the beam,WF=Area below the measured total load-displacement plot
3.2Fracture toughness(K IC)and CTOD c-Crack tip opening displacement
Critical stress intensity factor(KIC)and critical crack tip opening displacement CTODchave been derived from Jenq and Shah effective elastic crack model called the two parameter fracture model(TPFM)(Jenq and Shah 1985).The details are given below:
The TPFM requires at least one cycle to obtain the loading(Ci)and unloading(Cu)compliances,and also the peak load(Pc).The self-weight(P0)of the specimen is also included.The critical effective elastic crack length(ac)at the peak load is calculated from the modulus of elasticity obtained with the loading and unloading compliance,E1and E2,respectively.
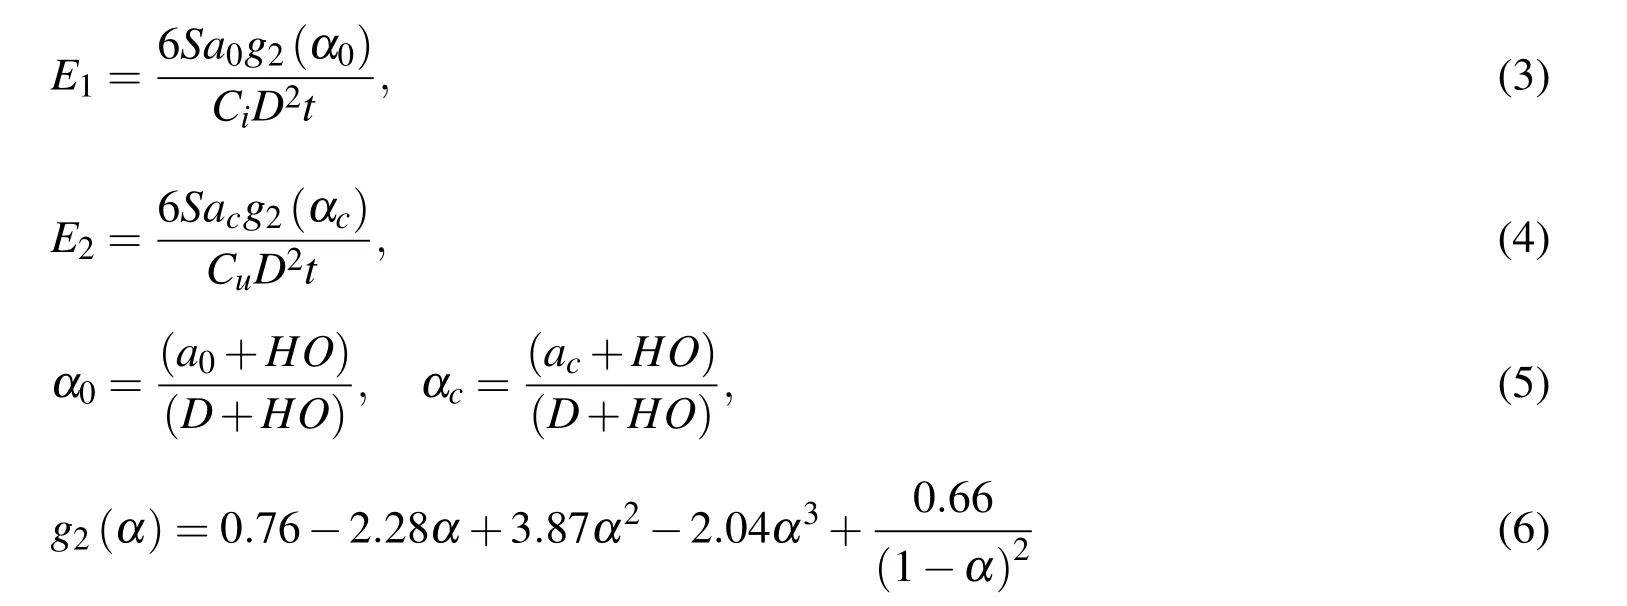
where,ao=initial crack depth,D=depth of the beam
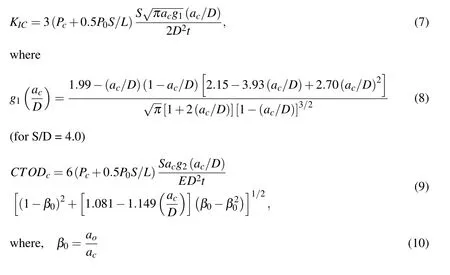
By equating E1and E2,the critical effective elastic crack length accan be obtained.Using the following LEFM relationship,KICand CTODc can be calculated given the geometric function(g1)for the TPB specimen.
4 Artificial Neural Network
ANNs learn through the example problems rather than programming.Although detailed methodology of ANN has been reported in literature[Kamarthi and Pittner(1999);Mohammed and Sudhakar(2002,Ince 2004)],a brief description towards development of model is described below.
4.1Feed Forward-Back Propagation Neural Networks
In Feed-Forward Networks(FFNs),the signals from the input neurons to the output neurons flow only in one direction.There is no feedback(loops)i.e.the output of any layer does not affect that same layer.Feed-forward ANNs are straight forward networks that associate inputs with outputs.They are extensively used in pattern recognition.This type of organisation is also referred to as top-down.The information distribution is parallel for all the nodes of the succeeding layer.Figure.1 describes the FFNs,typical three-layer feed-forward multi-layer perceptron network architecture with i,j,and o neurons in the input,hidden,and output layers respectively.firepresents the activation function,‘w’stands for the weights,Xirepresents the input variables and Ykstands for the output variables(André Bianconi et al.2010).
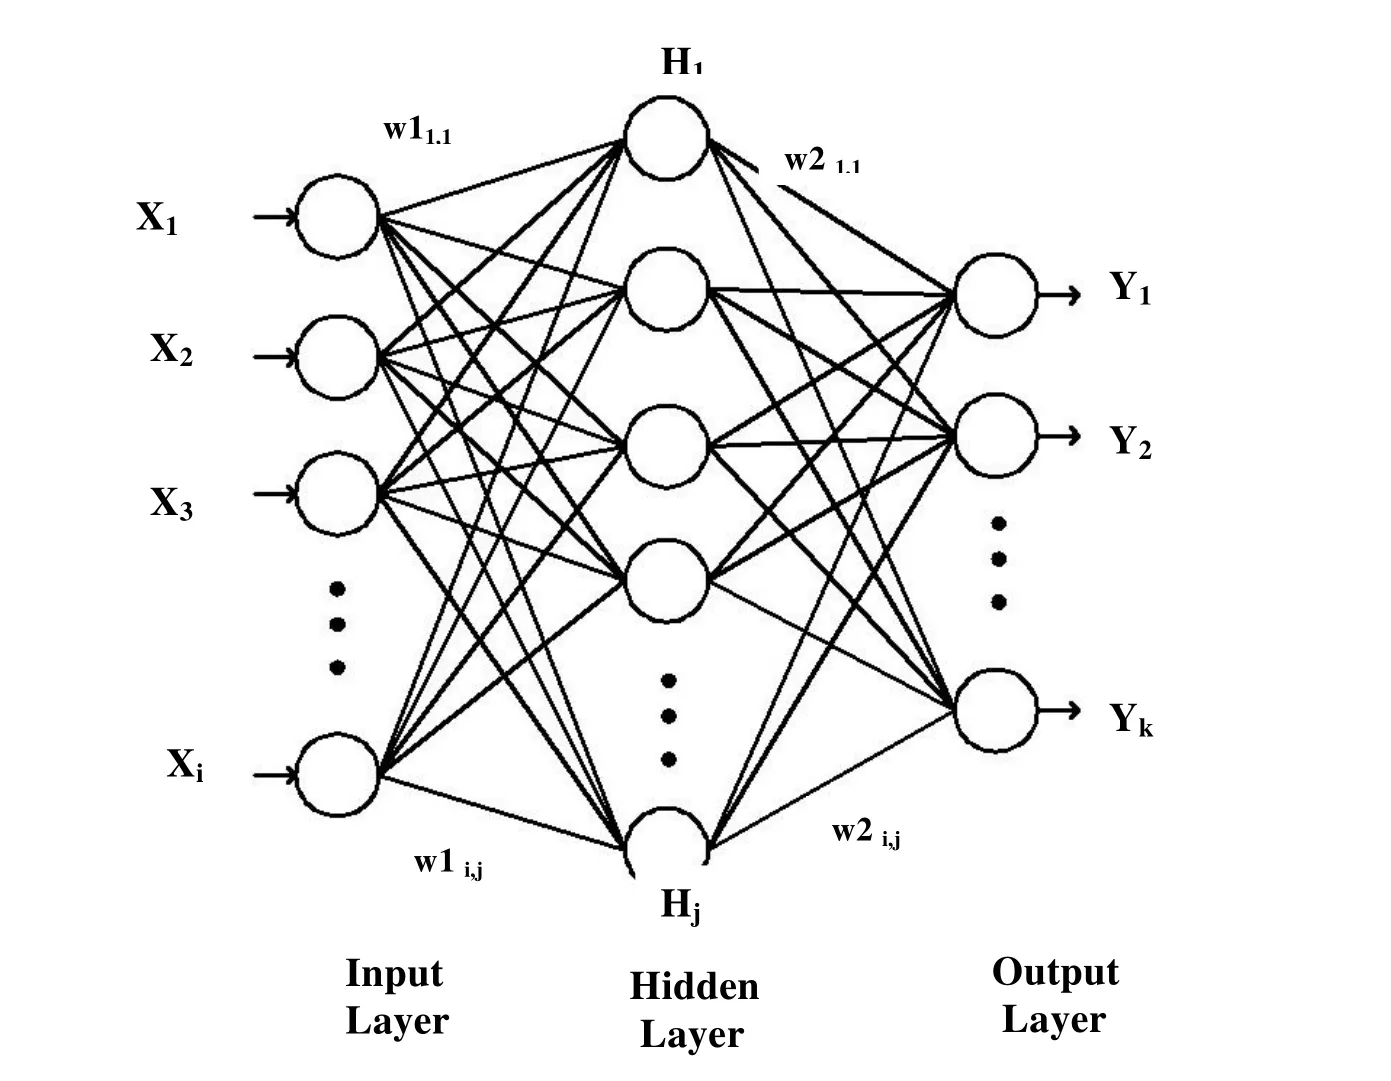
Figure 1:Typical Feed forward network.
Back-propagation neural networks are adopted in the present study,as they have a high capability of data mapping[Hecht-Nielsen(1990)].Back-propagation neural networks were applied to a wide range of areas including classification,estimation,prediction,and functions synthesis and they are currently the most widely used neural network.
The back-propagation learning is based on the gradient descent along the error surface[Gallant(1988);Kamarthi and Pittner(1999);Haykin(2001)].The weight adjustment is proportional to the negative gradient of the error with respect to the weight.In mathematical representation

where,wkis an individual weight at epoch k;ηis the learning rate.
And the direction vectordkis negative of the gradient of the output error function‘E’and is given by the equation 12

4.2Transfer Function
Depending upon the type of input data and the output required,there are five types of activation functions used to transform input signal into output viz.,linear function,threshold function,sigmoid function,hyperbolic tangent function and radial basis function(Roshan 2007).The sigmoid transfer functions are used in this work.Figure.2 shows the log and tan sigmoidal functions used for squashing the weights between the layers
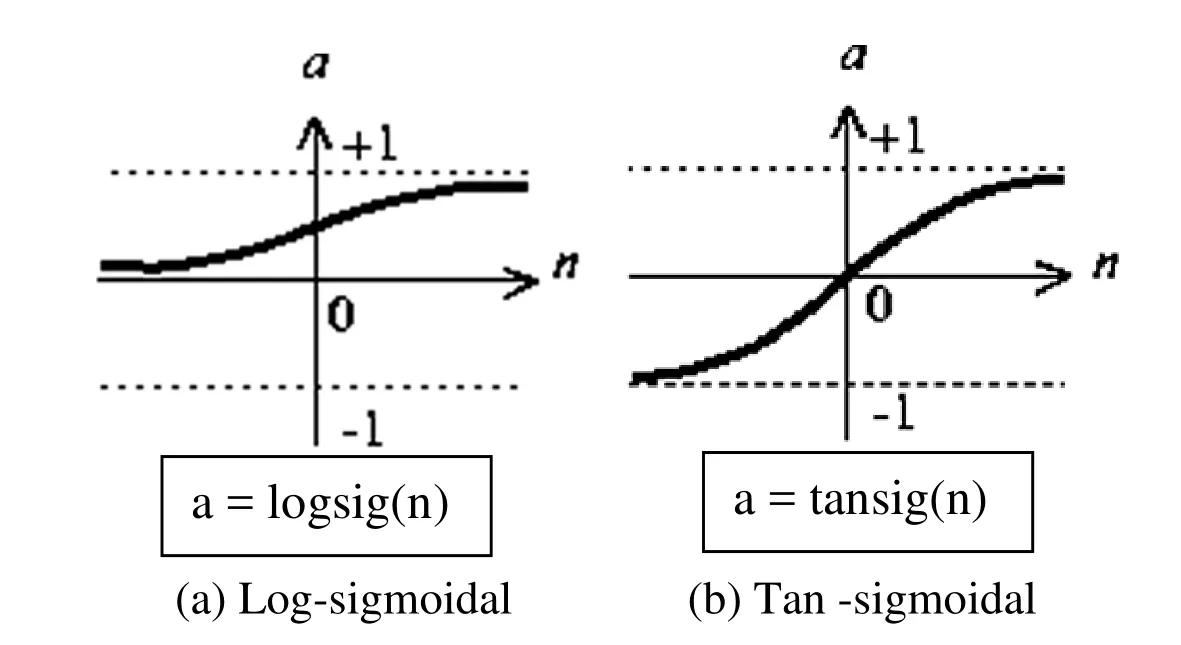
Figure 2:Transfer Functions.
To construct a neural network that performs some definite task,one must choose how the units are connected to one another and must set the weights on the connections appropriately.The connections conclude whether it is possible for one unit to influence another.The weights specify the strength of the influence.
5 ANN based analysis
The purpose of this investigation is to check the applicability of the ANN–based methodology to predict the failure load(Pmax)and fracture characteristics(GF,KICand CTODC)of High strength and Ultra high strength concrete beams.MATLAB software is used in developing the ANN robust models.
5.1Input and Output
The following parameters are considered as the input parameters for the ANN model.Length(L)of the beam,since the width of the beam is same for all the tested beams the cross section area(A),notch depth(a0),water-cement ratio(w/c),compressive strength(fck),split tensile strength(σt),and modulus of elasticity(E).These seven parameters are used as input terminals in the input layer.The outputs of the ANN is fracture energy(GF),critical stress intensity factor(KIC),critical crack tip opening displacement(CTODc)and failure load(Pmax).Totally 87 data sets obtained from the results of three-point bending test HSC,HSC1 and UHSC beams are used in development and validation of the ANN model.
5.2Architecture on ANN
Back–propagation ANN architecture is used in the present study.The input layer is used as described in previous section.The first hidden layer consists of four neurons and the second hidden layer consists of three neurons.Thus four individual models are developed for four outputs(GF,KIC,CTODCand Pmax).In the present study,four layers have been used that includes one input layer,two hidden layers and one output layer.Sigmoidal transfer functions are generally used in civil engineering problems and hence,the transfer functions ‘tansig’is used in between the input and first hidden layers;‘logsig’is used in between the first hidden layer and second hidden layer; ‘logsig’is again used in between second hidden layer and output layer.The transfer functions and the number of nodes in all the layers remain same for all the four models.The algorithm of the transfer functions used in MATLAB for tan and log sigmoidal functions are shown in equations 3 and 4 respectively[Demuth et al.(2006);Mark et al.(2011)]


5.3Training of ANN
About 70%of the total data sets are presented to the ANN for training and remaining data sets are used for the validation of the trained model.Thus,61 data sets are used for training and 26 for testing.The architecture of the ANN is described in Figure.3.The data that form an input vector have different quantitative limits and hence normalization of the data is required before presenting the input patterns to the ANN.Thus,equation 15 is used for the linear normalization of the data to the data values between 0 and 1.

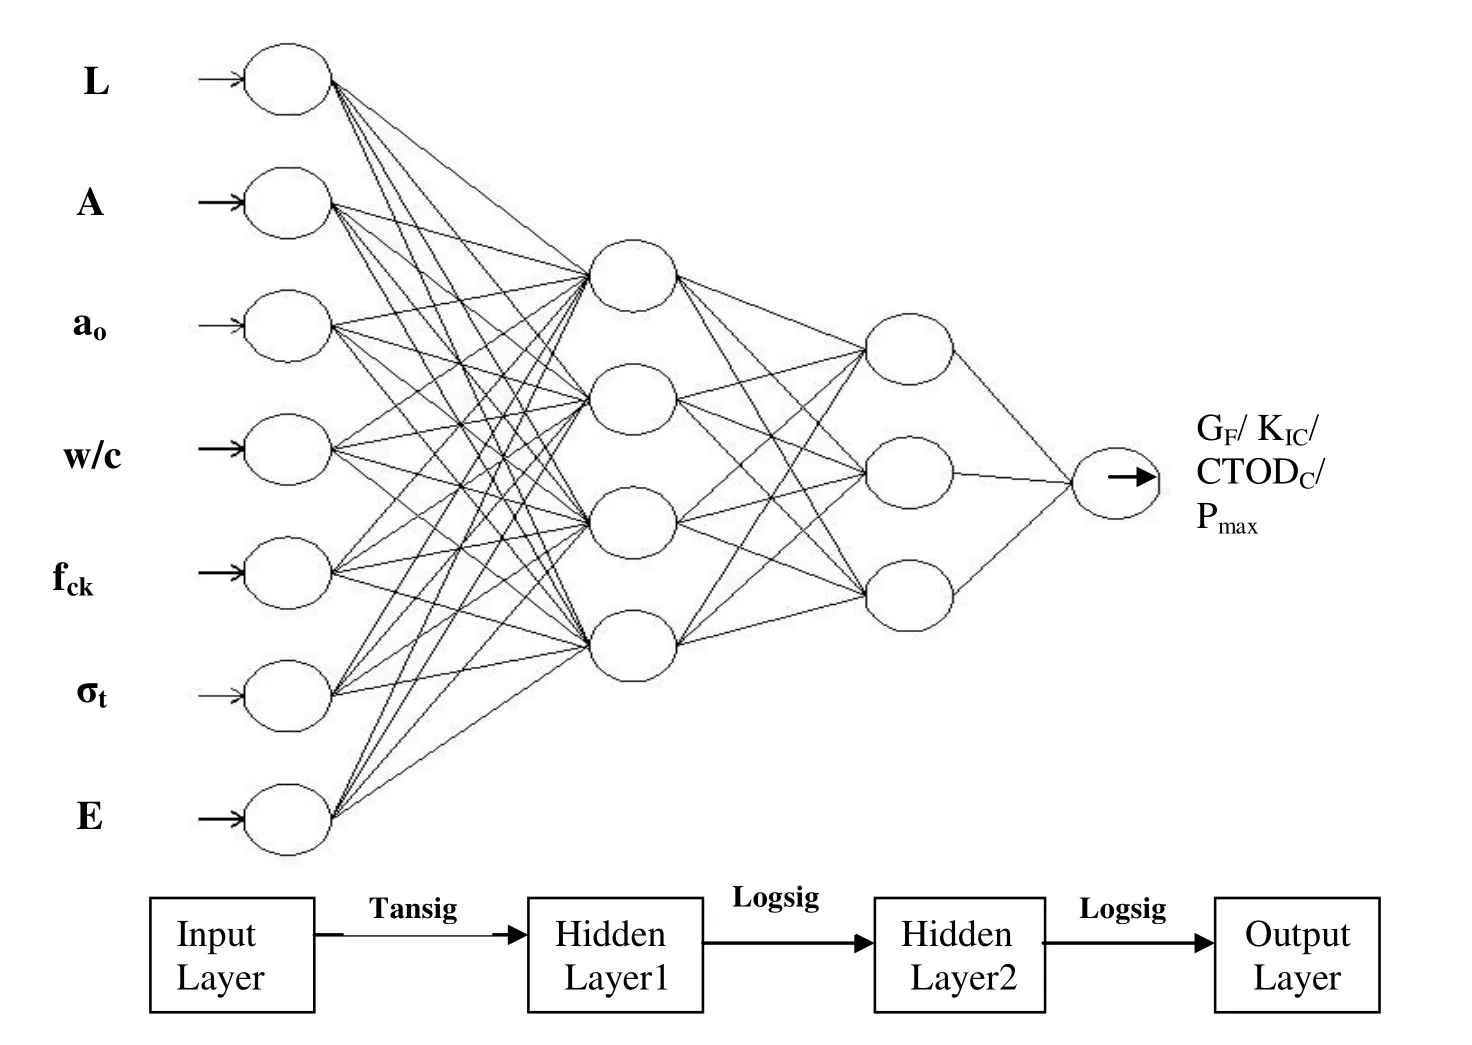
Figure 3:Typical Architecture of ANN.
The training phase of the ANN converged at about 1000 iterations or epochs for Pmaxand GF;800 epochs in case of KICand CTODC.The variation of the mean square error aginst the number of iterations for the fracture characteristics training models are shown in Figures.4 to 7.
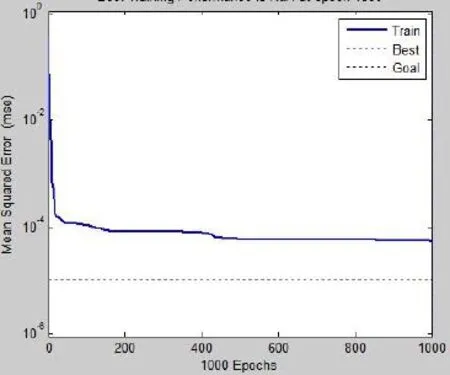
Figure 4:Training performance for P max.
From Figures 4 to 7 it can be noted that the ANNs prediction is very good and it is able to establish the relationship between the input parameters and the output parameters(GF,Pmax,KIC,CTODc).
5.4Testing of ANN
On successful completion of ANN training with 61 dataset,the model is verified with remaining 26 dataset.The results are presented in Tables 2 and 3.The output vector obtained from the ANN model is a normalized data and hence,the normalized data is reverted to its actual value by using equation 16.

where,xniis the normalized result obtained after the test for the ith component.xaiis the actual result obtained for ith componenet,andxmiaxandxmiinare the maximum and minimum values of all the compoents of the corresponding input vector before the normalization.
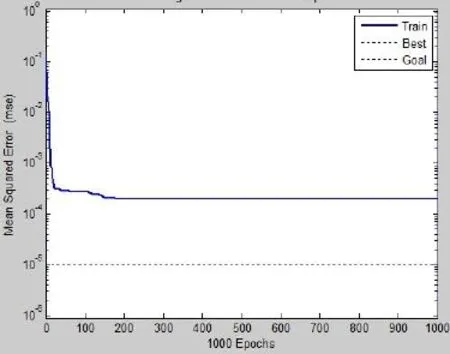
Figure 5:Training performance for G F.
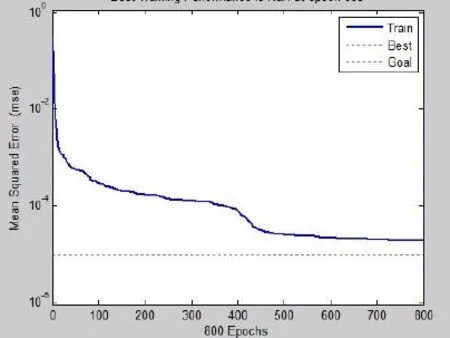
Figure 6:Training performance forK IC.
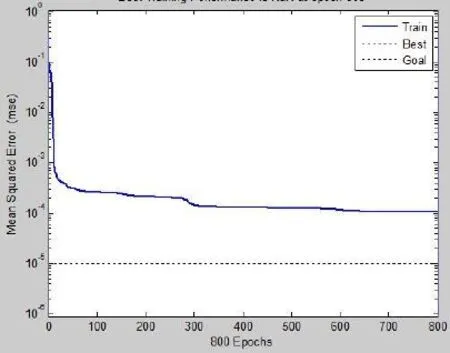
Figure 7:Training performance for CTOD C.
Note:
L-length,A-c/s area,a0-Notch depth,w/c-Water-cement ratio,fck-compressive strength,σt-Split tensile strength,E-modulus of elasticity,Pmax-Failure load,GF-Fracture energy,KIC-critical stress intensity factor,CTODC-Critical crack tip opening displacement.
The average percentage error in the prediction of testing dataset is found to be-0.47%,-0.41%,14.94%&-2.73%for Pmax,GF,KIC and CTODC respectively.The negative value indicate the under prediction and the positive values indicate over prediction.The value of coefficient of correlation(R)is determined by using the following formula

Where Eaiand Epiare the actual and predicted values,respectively,E aandE pare mean of actual and predicted E values corresponding to n patterns.
Figures.8 to 11 show the comparison of predicted and the corresponding experimental values of Pmax,GF,KICand CTODC.It can be observed that the predicted values of failure load,facture energy,stress intensity factor and critical crack tip opening displacement are in good agreement with those of the experimental values.The result is converged at 1000 epochs in all cases with error value of 5.44e-5,1.98e-4,1.90e-5 and 1.05e-4 for Pmax,GF,KICand CTODCrespectively.The coefficient of determination,R2is 0.99908 for Pmax,0.99676 for GF,0.99539 for KICand 0.99503 for CTODC
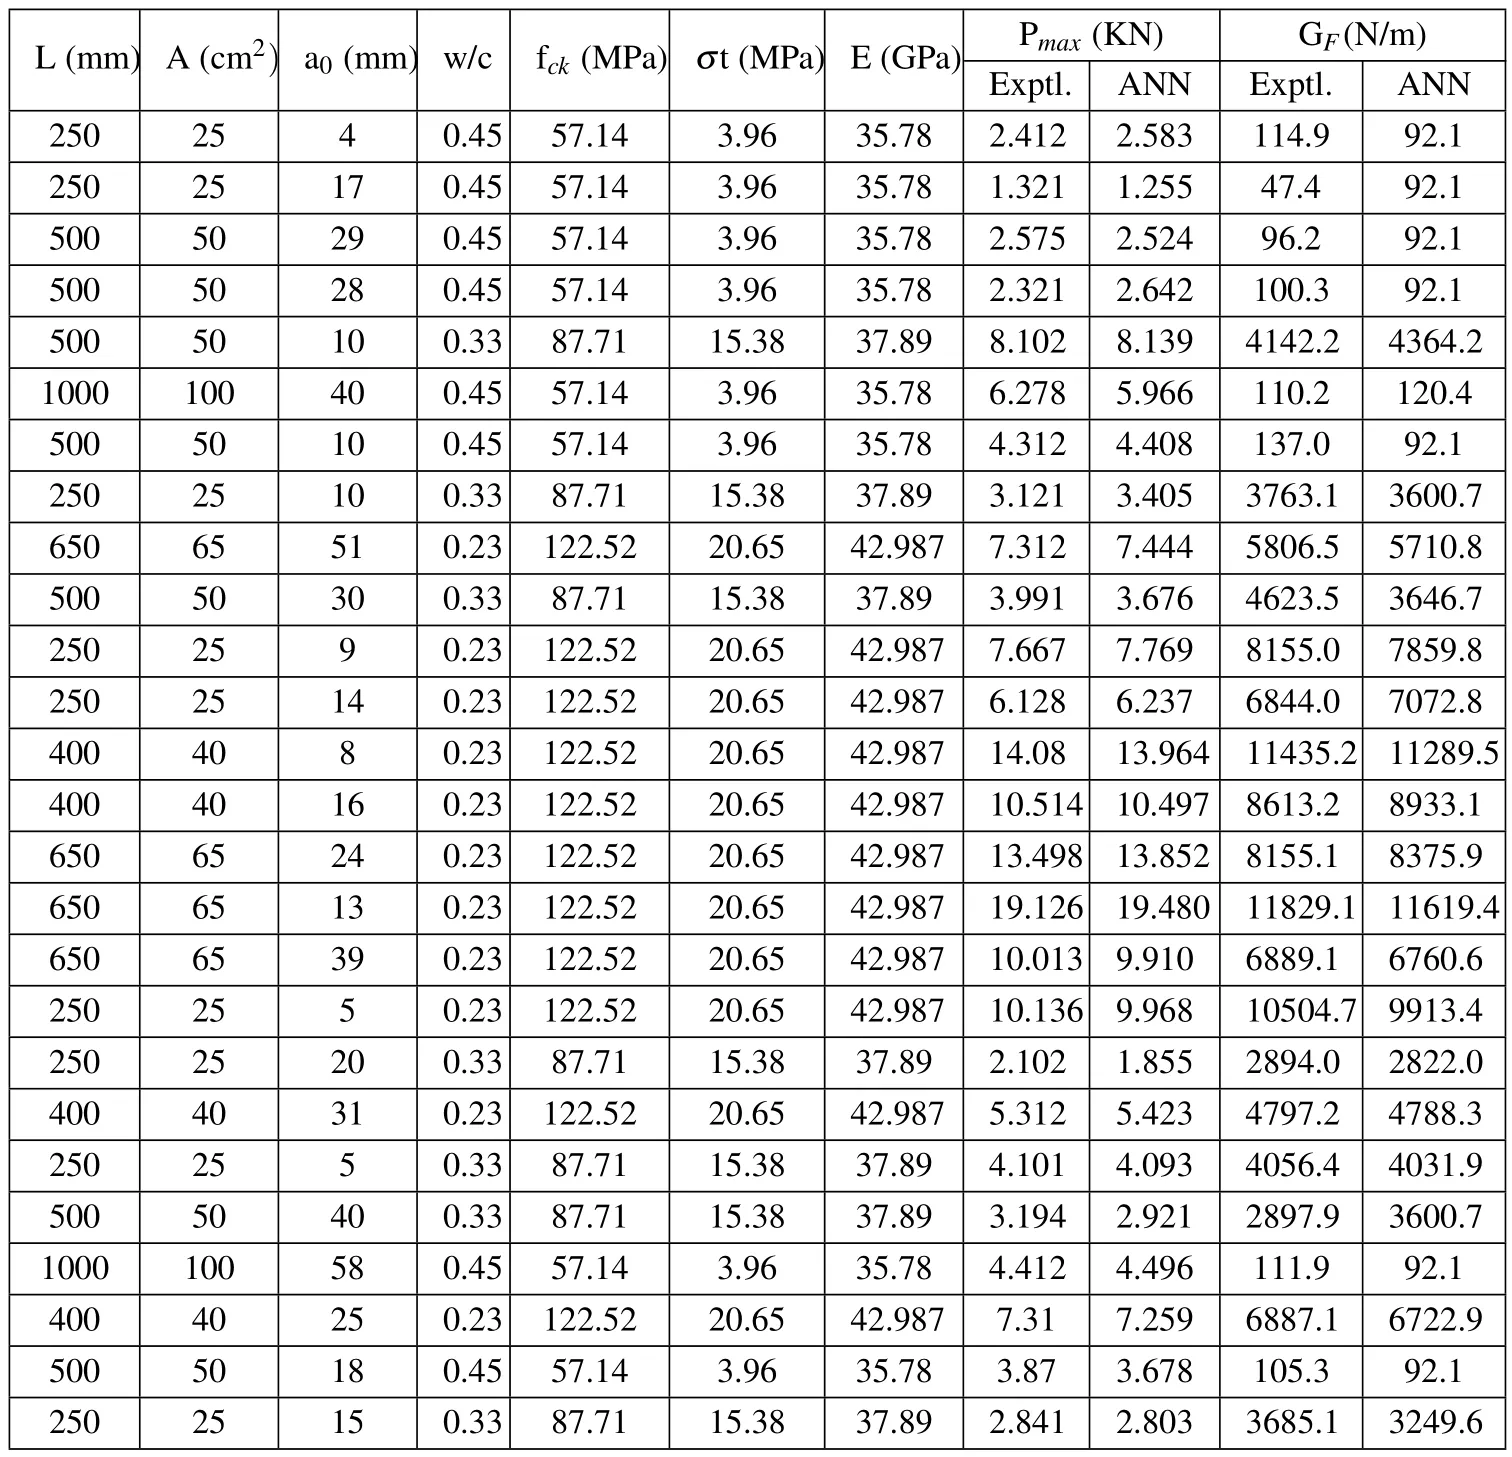
Table 4:Test results of ANN model(P max&G F).
6 Summary and Conclusion
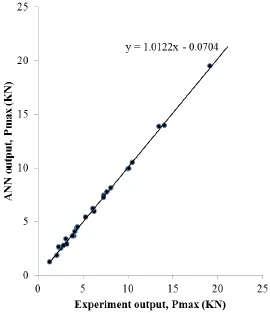
Figure 8:Predicted Vs experimental failure load(P max);R2=0.99908.
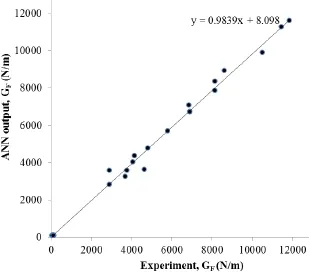
Figure 9:Predicted Vs experimental fracture energy(G F);R2=0.99676.
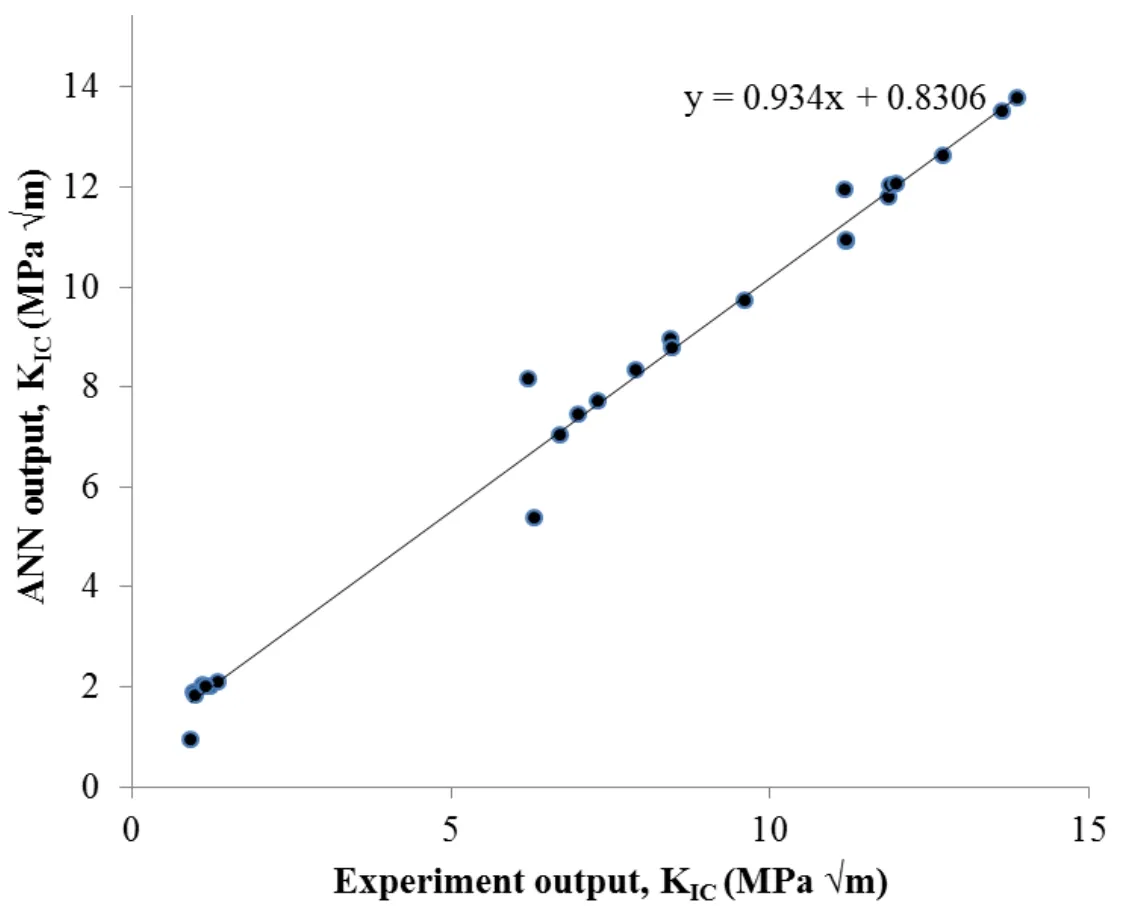
Figure 10:Predicted Vs experimental critical stress intensity factor(K IC);R2=0.99503.
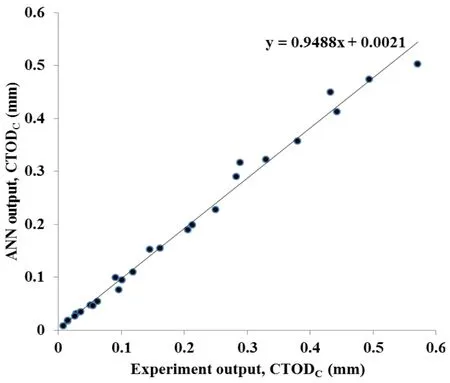
Figure 11:Predicted Vs experimental Critical crack tip opening displacement(CTOD C);R2=0.99503.
Fracture mechanics based Artificial Neural Network(ANN)model has been developed to predict the fracture characteristics of HSC and UHSC.Fracture character-istics include fracture energy(Gf),critical stress intensity factor(KIC)and critical crack tip opening displacement(CTODc).Failure load of the beam(Pmax)is also predicated by using ANN model.Characterization of mix of high strength and ultra strength concrete has been described.An overview of experimental details of beams tested under static loading has been shown and methodologies for evaluation of fracture energy,critical stress intensity factor and critical crack tip opening displacement have been outlined.
Towards development of ANN model,back-propagation training technique has been employed for updating the weights of each layer based on the error in the network output.The ANN architecture consists of one input,one output and two hid-den layers.The sigmoidal transfer functions are used for squashing the weights between the layers.Levenberg-Marquardt algorithm has been used for feed-forward back-propagation.Four ANN models have been developed using MATLAB software for training and prediction of the three fracture parameters and failure load.ANN has been trained with about 70%of the total 87 data sets and tested with about 30%of the total data sets.It is observed that the predicted values of failure load,facture energy,critical stress intensity factor and critical crack tip opening displacement are in good agreement with those of the experimental values.
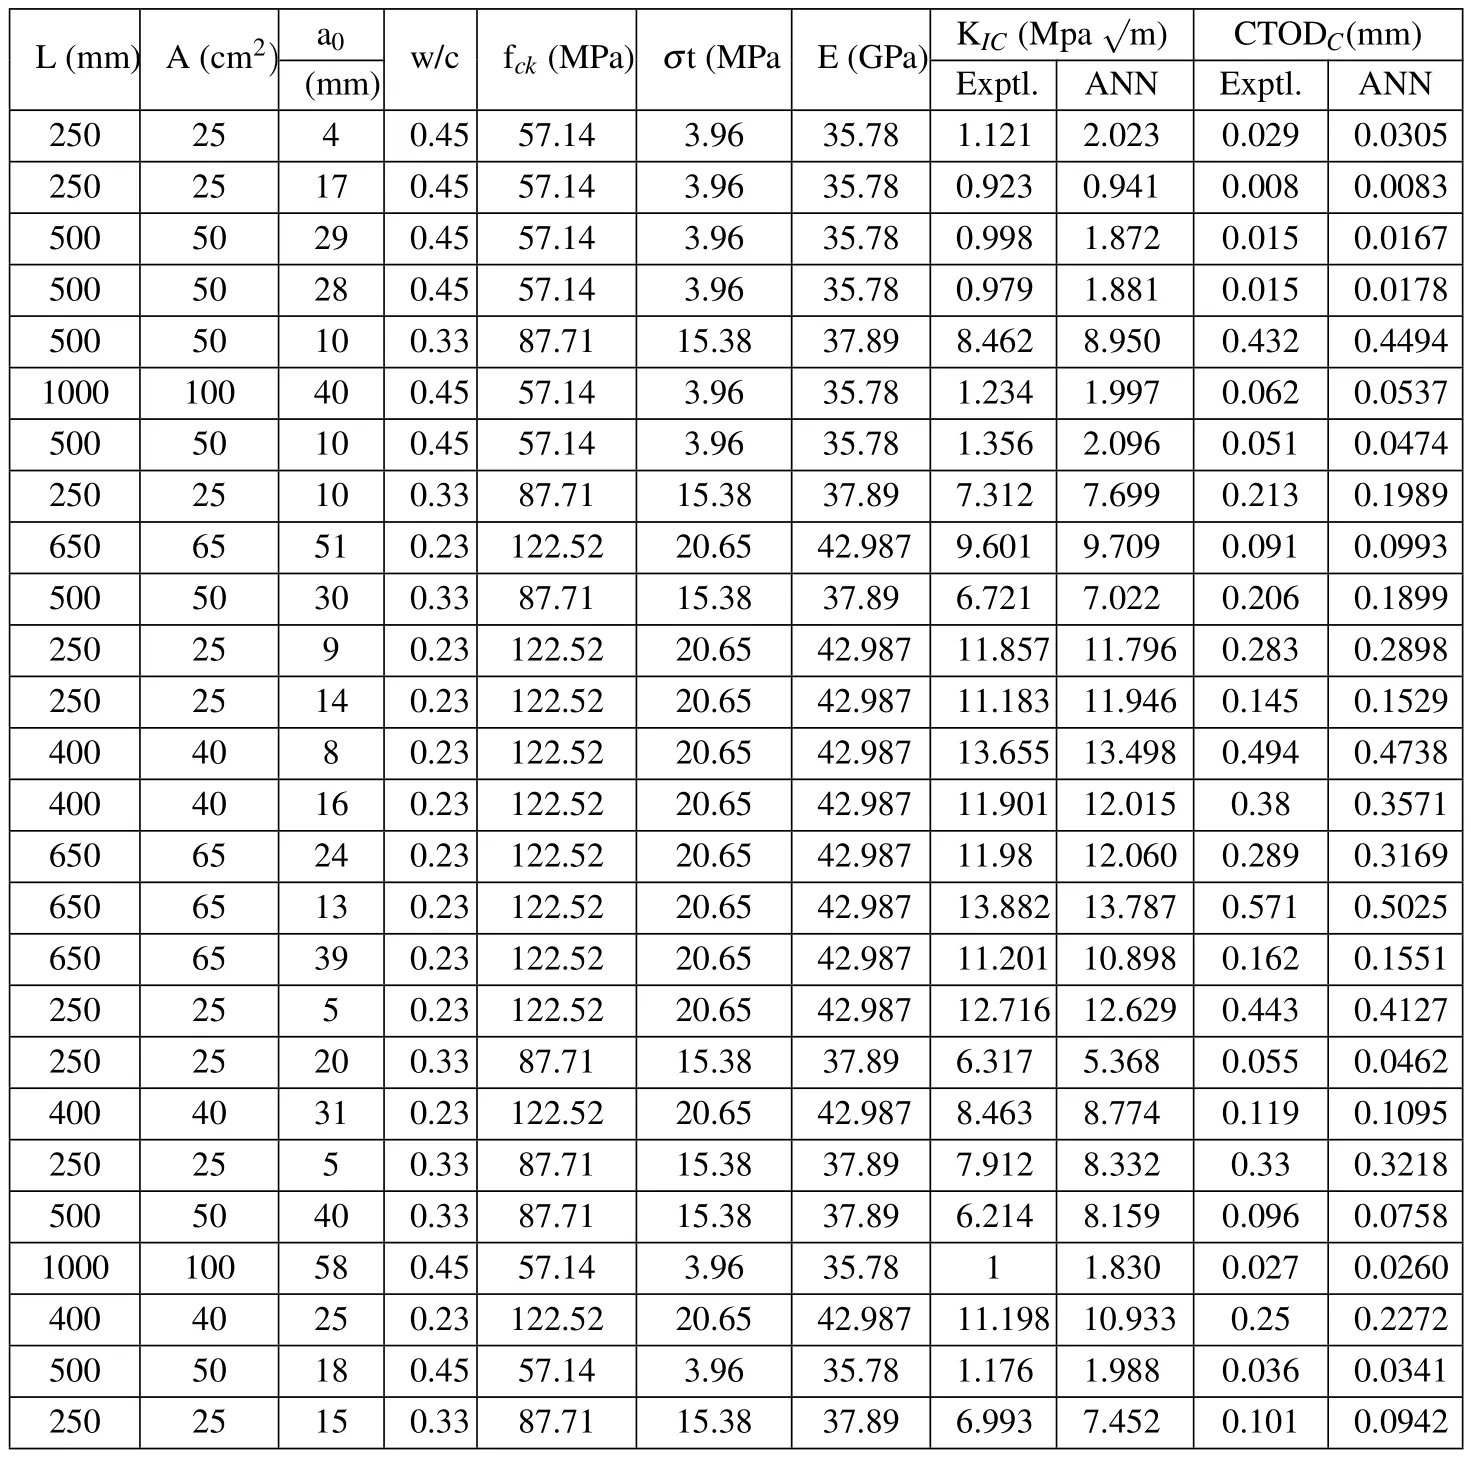
Table 5:Test results of ANN(K IC&CTOD C).
Acknowledgement:We acknowledge with thanks the valuable technical suggestions and support provided by our colleagues,Dr.G.S.Palani,Mr S.Maheshwaran,Ms.Smitha Gopinath,V.Ramesh Kumar,Scientists and B.Bhuvaneshwari,Quick Hire Fellow during the course of this investigation.The help and support provided by the staff of Advanced Materials Laboratory,CSIR-SERC to carry out the experiments is greatly acknowledged.This paper is being published with the permission of the Director,SERC,Chennai,India.
Akbas,B.;Shen,J.;Sabol,T.A.(2011):Estimation of seismic-induced demands on column splices with a neural network model.Applied Soft Computing,vol.11,pp.4820–4829.
Bianconi,A.;Von Zuben,C.J.;Serapião,A.B.D.S.;Govone,J.S.(2010):Artificial neural networks:A novel approach to analysing the nutritional ecology of a blowfly species,Chrysomya megacephala.Journal of insect science.,vol.10,article 58 ISSN:pp.1536-2442.
Barenblatt,G.I.(1959):The formation of equilibrium cracks during brittle fracture:general ideas and hypotheses,axially symmetric cracks.Appl Math Mech,vol.23,pp.622–36.
Bazant,Z.P.(2000):Size effect.Int J Solid Struct,vol.3,pp.69–80.
Dayal,R.P.;Sasanka,C.(2011):Analysis of smart crack detection methodologies in various structures.Journal of Engineering and Technology Research,vol.3,no.5,pp.139-147.
Demuth,H.;Beale,M.;Hagan,M.(2006):Neural network toolbox User’s guide.Version 5,Natick,Massachusetts.
Dugdale,D.S.(1960):Yielding of steel sheets containing slits.J Mech Phys Solids,vol.8,pp.100–104.
Gallant,S.I.(1988):Connectionist Expert Systems.Journal of Associative Com-putational Machinery,vol.31,pp.152-169.
Goltermann,P.;Johansen,V.;Palbol,L.(1997):Packing of Aggregates:An Alternate Tool to Determine the Optimal Aggregate Mix.ACI Material Journal,pp.435-443.
Hakan Arslan,M.(2009):Application of ANN to evaluate effective parameters affecting failure load and displacement of RC buildings.Nat.Hazards Earth Syst.Sci.,vol.9,pp.967–977.
Haykin,S.(2001):Neural Networks:A Comprehensive Foundation,second ed.Pearson Education Inc.,New Delhi,India.
Hecht-Nielsen,R.(1990):Neurocomputing.Addison-Wesely Publishing Company.
Hillerborg,A.;Modeer,M.;Petersson,P.E.(1976):Analysis of crack formation and crack growth in concrete by means of fracture mechanics and finite elements.Cement and Concrete Research,vol.6,pp.773–782.
Ince,R.(2004):Prediction of fracture parameters of concrete by Artificial Neural Networks.Engineering Fracture Mechanics,vol.71,pp.2143–2159.
IS:10262-2009:Recommended guidelines for concrete mix proportioning.,Bureau of Indian Standards,New Delhi,India.
Jenq,Y.S.;Shah,S.P.(1985):A two parameter fracture model for concrete.Journal of Engineering Mechanics,vol.111,no.4,pp.1227-1241.
Kamarthi,S.V.;Pittner,S.(1999):Accelerating neural network training using weight extrapolation.Neural Networks,vol.12,pp.1285-1299.
Karihaloo,B.L.;Nallathambi,P.(1989):An improved effective crack model for the determination of fracture toughness of concrete.Cement Concrete Research,vol.19,pp.603-610.
Karihaloo,B.L.(1995):Fracture Mechanics and structural Concrete.Longman Scientific&Technical,U.K,
Mark Hudson Beale;Martin T.Hagan;Howard B.Demuth.(2011):Neural network toolbox User’s guide.Version R2011b,Natick,Massachusetts.
Mohammed E.Haque;Sudhakar K.V.(2002):ANN back-propagation prediction model for fracture toughness in microalloy steel.International Journal of Fatigue,vol.24,pp.1003–1010.
Pawar,R.(2007):Predicting Bid Prices In Construction Projects Using Non-Parametric Statistical Models.Master of Science in civil engineering thesis,A&M university,Texas.
Richard,P.;Cheyrezy,M.H.(1994):Reactive powder concretes with high duc-tility and 200–800 MPa compressive strength.ACI Special Publication,144-24(1),pp.144:507–18.
Richard,P.;Cheyrezy,M.H.(1995):Composition of reactive powder concretes.Cement&Concrete Research,vol.25,no.7,pp.1501-1511.
RILEMTechnical Committee 89-FMT,(1990):Determination of fracture parameters(KIscand CTODc)of plain concrete using tree-point bend tests,proposed RILEM draft recommendations.Mater Struct„vol.23,no.138,pp.457–60.
Siddique,R.;Aggarwal,P.;Aggarwal,Y.(2011):Prediction of compressive strength of self-compacting concrete containing bottom ash using artificial neural networks.Advances in Engineering Software,vol.42,pp.780–786.
Yu,Z.;Sun,M.;Zheng,S.;Liang,L.(2010):Fatigue Properties of RPC under Cyclic Loads of Single-stage and Multi-level Amplitude.Journal of Wuhan University of Technology-Material Science Ed,pp.167-173.
