The Study of the Operating Performance of Marine Industry in the Blue Economic Zone:An Empirical Analysis Based on DEA and Tobit Model
2014-04-10ShengXUZheZHANGDengkuiSI
Sheng XU,Zhe ZHANG,Dengkui SI
School of Economics,Ocean University of China,Qingdao 266100,China
1 Introduction
Since the implementation of China's marine development strategy,the position and role of marine industry have been increasingly prominent in the marine economy,gradually attracting people's attention.However,relative to developed countries,China's marine economy started late,and the development is not yet ripe.With the continuous development of the marine industry,the carbon emissions have become increasingly prominent.
The study of the carbon emission performance of marine industry,will not only help to grasp the level of carbon emission of marine industry on the whole,but also help to use the great marine carbon sink capacity and the comparative advantages in carbon sequestration and carbon storage,and adopt advanced technology to reduce the carbon emission of marine industry to achieve low-carbon marine economy,thus promoting the ecological and sustainable low-carbon development of marine industry.
Therefore,it is necessary to study the characteristics of China's marine industry and operating efficiency of marine industry,and determine the resource utilization effect and overall operating status of marine industry and the sea-related enterprises,in order to provide theoretical basis and data support for the relevant decision makers to develop the strategies to improve the efficiency of enterprises.
In recent years,the domestic scholars' study on the industry performance has been gradually increased,which can be summarized in the following three aspects:
(i)The factors influencing the carbon emission performance of industries are studied.Zha Jianping(2012)built the static panel data model,to carry out the empirical analysis of the factors influencing the carbon emission performance,and it was found from the results that the level of industrial development,scale structure,ownership structure and energy structure had a significant impact on the carbon emission performance[1].
Zhong Yunyun(2012)used the linear data transfer function method to analyze the factors influencing the carbon emission performance of total factor,and the study found that the industrial structure and energy structure had a great impact on the carbon emission performance[2].
(ii)The carbon emission performance is evaluated.Hua Jian(2013)used the linear data transfer function method to evaluate the inter-provincial carbon emission performance in China,and the study found that the there were significant regional imbalances in the development of carbon emission performance[3].
Xu Sheng(2013)used DEA method to study the development performance of the blue economic zone in Shandong Peninsula,and found that the accumulation of physical capital and improvement of efficiency controlled the direction of performance,and human capital and technological progress were the main reason for the differences in the performance[4].
(iii)The dynamic changes in the carbon emission performance are studied.In the analysis framework of total factor,Zha Jianping(2012)used environmental technologies to analyze the dynamic changes in the carbon emission performance of industry of each region in the period 2003-2009,and it was found that the carbon emission performance showed a rising trend,but the overall level was low and there was imbalance in the regional development[5].
Zhang Liguo(2013)built the measure function of carbon emission performance of the logistics industry,to carry out dynamic study of the carbon emission performance of30 regions in China in the period 2003-2009,and found that the carbon emission performance of China's logistics industry fell by 0.45%,due to decline in both the technical efficiency and technological progress[6].
The Chinese scholars have used different methods from different angles to carry out in-depth research of the industrial performance,laying foundation for the sustainable development of China's industrial economy.
However,the scholars mainly put the focus of research on industry,but ignore the status of China's marine industry in the economic development.
Therefore,with China's marine industry as the research object,this paper uses data envelopment analysis(DEA)for the first time to analyze the level of the carbon emission performance of marine industry in the blue economic zone from the perspective of input and output;on this basis,uses Tobit model to analyze the factors influencing the operating performance of marine industry,in order to help to promote the sustainable development of marine industry.
2 Methods
2.1 Data envelopment analysis(DEA)Data envelopment analysis(DEA)is a nonparametric method in operations research and economics for the estimation of production frontiers.It is used to empirically measure productive efficiency of decision making units(or DMUs).
Although DEA has a strong link to production theory in economics,the tool is also used for benchmarking in operations management,where a set of measures is selected to benchmark the performance of manufacturing and service operations.In the circumstance of benchmarking,the efficient DMUs,as defined by DEA,may not necessarily form a"production frontier",but rather lead to a"best-practice frontier".
DEA is referred to as"balanced benchmarking"by Sherman and Zhu(2013).Non-parametric approaches have the benefit of not assuming a particular functional form or shape for the frontier,however they do not provide a general relationship(equation)relating output and input.There are also parametric approaches which are used for the estimation of production frontiers.
These require that the shape of the frontier be guessed beforehand by specifying a particular function relating output to input.One can also combine the relative strengths from each of these approaches in a hybrid method where the frontier units are first identified by DEA and then a smooth surface is fitted to these.This allows a best-practice relationship between multiple outputs and multiple inputs to be estimated.
The framework has been adapted from multi-input,multi-output production functions and applied in many industries.DEA develops a function whose form is determined by the most efficient producers.This method differs from the Ordinary Least Squares(OLS)statistical technique that bases comparisons relative to an average producer.
Despite the openness and externality of marine economy,the object of this study is the carbon emission performance of marine industry in the blue economic zone,with certain closeness in terms of region or research subject,so DEA method is of some applicability to the study of carbon emission performance of marine industry.
Based on the use of panel data,DEA-Malmquist index is built using the distance function,to calculate the total factor productivity index.Malmquist index is widely used in the input-output analysis.Since Malmquist index can be decomposed into efficiency index and technological progress index,this article attempts to adopt Malmquist index to evaluate the dynamic changes in the carbon emission efficiency of marine industry in the blue economic zone,in order to obtain the actual application results.
In DEA theory,technological growth index=pure technological growth index×returns to scale and technological growth index=efficiency improvement index×technological progress index,and efficiency improvement index×technological progress index is just the composite index in the data envelopment analysis(DEA)analysis.
2.2 Tobit modelThe Tobit model is a statistical model proposed by James Tobin(1958)to describe the relationship between a non-negative dependent variable yi and an independent variable(or vector)xi.The term Tobit was derived from Tobin's name by truncating and adding-it by analogy with the probit model.
It is also known as sample selection model,or limited dependent variable model.The feature of this model is that the model consists of two parts:one is the selection equation model of constraints;the other is the continuous variable equation model when meeting the constraints.
The restricted continuous variable equation model often stirs the research interest,but the dependent variables are restricted by some constraints,so ignoring certain immeasurable factors will make the restricted dependent variable model generate sample selection bias.
(i)The form of model.Consider the following latent dependent variable regression model:

where σ is the proportion coefficient;y*is the latent variable.
The relationship between the observed data y and latent variable y*is as follows:

In other words,all negative values ofis defined as0,so it can be said that these data are left censored at 0;all unobserved negative values ofare not simply removed from the sample.This model is called standard censored regression model,also known as Tobit model.
(ii)The maximum likelihood estimation of censored regression model.The maximum likelihood method can be used to esti-mate the parameter of censored regression model,and the log-likelihood function is as follows:

By calculating the maximum of formula(3),we can get the estimates of parametersβandσ.Here f and F are the density function and distribution function of u,respectively.
In particular,for the Tobit model,let u-N(0,1),then the log-likelihood function is as follows:

Formula(4)is composed of two parts.The first part corresponds to the unrestricted observed value,identical to the classical regression expression;the second part corresponds to the restricted observed value.
Therefore,the likelihood function is the mixture of discrete and continuous distribution.By maximizing the likelihood function,we can get the maximum likelihood estimation of parameters.
3 Empirical analysis
3.1 The operating efficiency of marine industryIn order to study the all sidedness of the operating efficiency of marine industry,this paper selects12marine-related industries as the research object,specifically including marine fishery,offshore oil and gas industry,marine mining industry,marine salt industry,ocean shipping industry,marine chemical industry,marine bio-pharmaceutical industry,marine engineering construction,marine power industry,seawater use industry,marine transportation and marine tourism.
In the indicator selection,this paper selects the total output value of various industries and industrial added value as the output indicators;the input indicators include the labor,capital,energy consumption and CO2 emissions for each industry(labor represented by the number of employees in each marine industry;capital represented by the average value of the fixed assets at the beginning and end of the year;energy consumption represented by the total energy consumed by various marine industries).
In order to eliminate the impact of price changes and other external factors on the study,this paper converts the value indicator values into the prices in 2000.
In order to analyze the trends and changes of carbon emissions,since the cities in the blue economic zone do not collect statistics concerning the total energy consumption,the energy consumption of each city can be calculated by multiplying the per capita energy consumption in Shandong Statistical Yearbook and the total population of the cities in the blue economic zone.
In the case of ignoring the changes in the energy structure of each city,the carbon dioxide is derived using the carbon dioxide emission standards of standard coal to convert.
The amount of standard coal used for various industries in various cities is likewise calculated by multiplying the per capita energy consumption in Shandong Province and the total population of the cities in the blue economic zone.
The data all use the time-series data in the period 2001-2012,and the data are from China Statistical Yearbook,China O-cean Yearbook,Qingdao Statistical Yearbook and Shandong Statistical Yearbook.
In order to grasp the overall level of the carbon emission performance of marine industry in the blue economic zone of Shandong Peninsula,this paper decomposes the efficiency of marine industry in the blue economic zone,to take the total output value of marine industry in the blue economic zone as the output indicator.
According to the principle of DEA-Malmquist index,the industry data are imported into DEAP2.1 software,and the level of carbon emission performance of various industries is derived after running.The index unit of technical efficiency,technological progress index and carbon emission performance is1,so the three can be placed in the same figure to compare,and the specific results are shown in Table 1 and Fig.1.

Table 1 The operating efficiency of various marine industries in the period 2002-2012
It could be found from Fig.1 that in the period 2001-2012,the overall efficiency of marine industry in the blue economic zone as a whole rose by 6.94%,the technological progress index rose by 3.12%,and the pure technical efficiency declined by 0.42%,indicating that the rise of the overall efficiency in the blue economic zone hinged on the technological progress;in the period 2008-2009,both the carbon emission technical efficiency and carbon emission performance index declined,due to the impact of the financial crisis on marine industry,so the carbon emission index showed a declining trend.
But from the comprehensive trend,the level of carbon emission performance in the blue economic zone showed a slow rising trend.

Fig.1 The overall carbon emission performance of marine industry and its decomposition in the period 2001-2012
Table 1 shows that the industries with high overall efficiency are mainly some industries characterized by the energy consumption,such as offshore oil and gas industry,marine transportation,and marine chemical industry.The tourism industry,bio-medicine and other industries show the characteristics of low carbon emission.
Meanwhile,through the horizontal comparison of carbon emission performance of various industries,it can be found that with the improvement of carbon emission performance,the growth rate of technological progress index is greater than the technical efficiency.
Thus,the reason for the high carbon emission performance mainly depends on the improvement of carbon emission technological progress index,that is,the technical factors play a major role in the carbon emission performance.This result is very consistent with the theoretical analysis.
In order to comprehensively analyze the economic efficiency of marine industry in the blue economic zone from the holistic angle,this paper takes into account the industry as a whole,and uses data envelopment analysis(DEA)to measure the operating efficiency of marine industry.The results are shown in Table 2.
3.2 Forecasting of the operating efficiency of marine industry in the blue economic zone Since the changes in the economy are affected by many factors,the predictive variables do not necessarily show a linear change.
This article uses the BP neural network model for the short term forecasting,in order to improve the sustainable development of the marine industry in the blue economic zone during the"Eleventh Five-Year Plan"period.
In the BPneural network model,the landslide of the time series is to establish the association between the data through the normalization of historical data,and use the gray fuzzy system and relational model for short-term non-linear forecasting,so as to effectively grasp the short-term trends of things.
In this model,in order to verify the accuracy of the simulation and forecasting,this article used the carbon emission performance of marine industry in the blue economic zone during the period 2002-2006 as the smooth base,for iterative simulation and forecasting.The results are shown in Table 3.
By comparing the actual and forecasting values of carbon emission performance in the blue economic zone,it can be found that the actual value of carbon emission performance was 0.96 in 2007,and the forecasting value of carbon emission performance was0.972 in 2007,with the forecasting error of only 1.3%;the forecasting error was0.8%,0.6%and 0.4%,respectively,during the period 2008-2011,indicating that over time,the forecasting error of smoothness index was constantly reduced,highlighting the high speed and high accuracy of the short-term forecasting based on BP neural network.

Table 2 The overall operating efficiency of marine industry

Table 3 The forecasting results of the carbon emission performance in the blue economic zone(2013-2015)
The actual and forecasting values of the carbon emission performance of marine industry in the blue economic zone during the period 2002-2015 can be shown in Fig.2.
From the forecasting values in Fig.2,it can be found that the carbon emission performance of marine industry in the blue economic zone during the period 2009-2015 is gradually increased,the forecasting value of technical efficiency rises slowly,and technological progress index is increased rapidly,indicating that the carbon emission performance hinges on the changes in the technological progress index.
At the same time,this trend also indicates that during the period 2013-2015,the development of marine industry in the blue economic zone will be significantly improved.

Fig.2 The forecasting of the carbon emission performance based on BP neural network model index landslide
The conclusion is in line with the strategy of the"Twelfth Five-Year Plan"on"improving the marine science and technology,and developing the marine economy",so it is necessary to effectively control the carbon emission of marine industry in the blue economic zone,to provide the basis for the realization of low-carbon marine industry.
3.3 The empirical analysis based on Tobit modelIn terms of the influence on the operating efficiency of marine industry in the blue economic zone,we believe that the regional economic strength,technological level,sustainable carrying capacity of the environment,level of human capital and social service building,influence the marine industry's economic efficiency.
So this article selects per capita GDP(denoted as AGDP)to measure the regional economic strength;uses the number of important technological achievements(denoted as CGS)to measure technological level;uses unit GDP energy consumption(NH)to measure the sustainable carrying capacity of the environment;selects the number of employees(denoted as CYRS)to measure the level of human capital;selects large-scale investment in fixed assets(GDTZ)to measure the level of social service building.
The specific indicators and data are shown in Table 4.
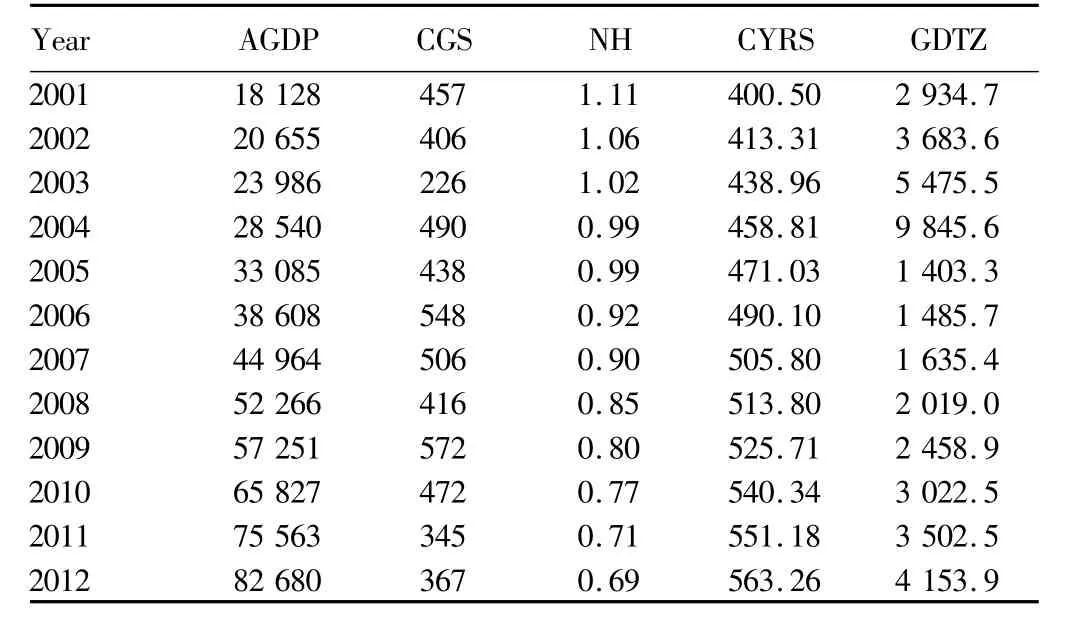
Table 4 The factors influencing the economic efficiency of the marine industry
The economic efficiency is calculated based on DEA,and the Tobit model is set as follows in accordance with the above five factors influencing the economic efficiency of the blue economic zone:

where E*represents the technical efficiency,technological progress index and overall efficiency using DEA method.
Based on the model set above,pure technical efficiency,technological progress index and overall efficiency are used respectively to perform the limit Tobit regression of the influencing factors.
The results are shown in Tables 5,6,7.

Table 5 Tobit regression results of the factors influencing the pure technical efficiency

Table6 Tobit regression results of the factors influencing the technological progress index

Table 7 Tobit regression results of the factors influencing the overall efficiency
From the Tobit regression of technical efficiency,technological progress index and overall efficiency on the influencing factors,we can draw the following results:
(i)For the level of regional economic development(AGDP),it has a significant positive effect on the technological progress index and overall efficiency.
The economic meaning is that the higher the level of econom-ic development,the higher the requirements on the technological progress index and overall efficiency;the higher the economic level,the better the overall efficiency.
It has a negative effect on the pure technical efficiency,indicating that in the blue economic zone,the level of technological development at the current stage is not enough to ensure significant economic improvement,and there is a need to further improve the economic level and technological level.
(ii)For the number of important technological achievements(CGS),this indicator has a significant positive effect on the pure technical efficiency,but has a negative effect on the technological progress index and overall efficiency.
The economic meaning is that the important scientific and technological achievements can significantly promote the improvement of technical efficiency.
Due to the impact of low conversion rate of scientific and technological achievements and other factors,the scientific and technological achievements are not really put into practice,thus failing to improve the technological progress index and overall efficiency.
(iii)In terms of the energy consumption per unit of GDP(NH),this indicator represents the sustainable environmental carrying capacity,and this indicator has a negative impact on the pure technical efficiency,indicating that the current sustainable environmental carrying capacity in the blue economic zone has not been improved in terms of the technical level,and this aspect is a relatively weak aspect of the blue economic zone.
The energy consumption per unit of GDP has a positive effect on the technological progress index and overall efficiency,mainly because with the dynamic changes in time,the environmental sustainability has increasingly high requirements on the technological progress and overall efficiency,and with the increasing pressure on the sustainable environmental carrying capacity,it is necessary to promote the sustainable development of the environment by improving the technological progress and overall efficiency.
(iv)In terms of the number of employees(CYRS),this indicator can measure the level of human capital to a certain extent.From the Tobit regression results,it can be found that the number of employees has a negative effect on the pure technical efficiency,but has a positive effect on the technological progress index and overall efficiency.
The economic meaning is that the substitution effect of the future technology on human capital is negative,and the technological improvement will be bound to result in a certain percentage of unemployment.
According to the study of Xu Sheng et al(2013),it was found that the current growth pattern of the blue economic zone in Shandong Peninsula was still the physical capital-driven pattern,and it still required more employees to achieve the scale effect on the technological progress,thereby having a significant positive effect on the technological progress and overall efficiency.
(v)In terms of the fixed production investment(GDTZ),this indicator can effectively measure the level of social infrastructure.From the Tobit regression results,the fixed production investment has a positive effect on the pure technical efficiency,technological progress index and overall efficiency,but from the coefficient,it can be found that this effect is small,and almost negligible,indicating that the current improvement of the pure technical efficiency,technological progress index and overall efficiency in the blue economic zone,does not depend on the condition of the infrastructure.
4 Conclusions
Using data envelopment analysis(DEA),this article measures the operating performance of marine industry in the blue economic zone.Using the BP neural network index landslide,this article predicts the changes in the carbon emission performance in the period 2013-2015,and using Tobit model,it analyzes the factors influencing the operating performance of marine industry.The conclusions can be summarized as follows:
(i)The industries with high carbon emission performance are mainly those industries with high energy consumption,high emission and high pollution.In terms of the blue economic zone,the industries with high carbon emission performance are the offshore oil and gas industry,marine transportation,marine shipping and marine chemical industry.This result is consistent with the theoretical analysis.
(ii)In the period 2002-2012,the carbon emission performance index of the blue economic zone showed a rising trend,and the main reason for this upward trend was the improvement of technological progress index,indicating that the blue economic zone made progress in the energy use efficiency and energy conservation in recent years,but the technological progress index rose slowly,and needed to be improved.
(iii)Through the nonlinear forecasting,during 2013-2015,the carbon emission performance in the blue economic zone will have an upward trend,but the technical efficiency index change will not be obvious in the short term,while the technological progress index change has an increasing trend,indicating that in order to achieve the carbon emission target of the Eleventh Five-Year Plan,it is necessary to develop science and technology,and the technological progress is an effective way to solve the short term carbon emission performance.
(iv)The level of economic development and the number of important technological achievements in the blue economic zone can significantly improve the pure technical efficiency;sustainable environmental carrying capacity and the number of employees are conducive to improving the technological progress index and overall efficiency;the level of social infrastructure has a positive effect on the overall efficiency,but the effect is not obvious;energy consumption per unit of GDP and the number of employees are not conducive to the improvement of the pure technical efficiency,which is mainly due to the current mode of economic development in the blue economic zone.
[1]ZHA JP,ZHENG HS,TANG FF.Empirical study on regional industrial carbon emissions performance and its factors in China[J].Soft Science,2012,26(4):1-6.(in Chinese).
[2]ZHONG YY,ZHONGWZ.China's regional total factor carbon emission performance and influencing factors analysis[J].Business Economics and Administration,2012(1):85-96.(in Chinese).
[3]HUA J,REN J,XU M.Evaluation of Chinese regional carbon dioxide emissions performance based on a three-stage DEA model[J].Resources Science,2013,35(7):1447-1454.(in Chinese).
[4]XU S,SIDK.Differences in economic growth and spatial effects in Shandong Peninsula blue economy—Based on DEA nonlinear estimation[J].East China Economic Management,2013,27(9):18-22.(in Chinese).
[5]ZHA JP,TANGFF.Research on static level,dynamic change and affecting factors of industrial carbon emissions performance—An empirical analysis based on Chinese provincial panel data[J].Journal of Shanxi Finance and Economics University,2012(3):71-80.(in Chinese).
[6]ZHANG LG,LID,ZHOUDQ.Dynamic carbon dioxide emissions performance and regional disparity of logistics industry in China—The empirical analysis based on provincial panel data[J].Systems Engineering,2013(4):95-102.(in Chinese).
杂志排行
Asian Agricultural Research的其它文章
- Research on Factors Influencing Fertilizer Application of Farmer Households in Anhui Province
- Study on Causes of Slow Progress in Promoting the Application of Food Traceability System in China
- Numerical Simulation and Moist Potential Vorticity Analysis of Torrential Rain in Jiangxi Province during June 2010
- Evaluation on Optimal Scale of Rural Fixed-asset Investment-Based on Microcosmic Perspective of Farmers' Income Increase
- The Estimation Methods for Agricultural Surplus Labor Based on Stochastic Frontier Production Function
- On the Poverty in the Rocky Desertification Areas of Southwest China Based on AHP:A Case Study of Liupanshui City in Guizhou Province