Remote Sensing Image Classification Based on Decision Tree in the Karst Rocky Desertification Areas:A Case Study of Kaizuo Township
2014-04-10ShuyongMAXingleiZHUYulunAN
Shuyong MA,Xinglei ZHU,Yulun AN
1.Qinghai Geological Bureau of Nuclear Industry,Xining810016,China.2.School of Geographic and Environmental Sciences,Guizhou Normal University,Guiyang 550001,China
Karst rocky desertification is a process of land degradation involving serious soil erosion,extensive exposure of basement rocks,drastic decrease in soil productivity,and the appearance of a desert-like landscape[1].The main methods for the remote sensing image classification in the rocky desertification areas are supervised classification and unsupervised classification.
However,the supervised classification and unsupervised classification simply use the brightness features of the pixel for image segmentation,with low classification accuracy;they often can not meet the needs of practical applications[2],and they are unable to automatically extract the rocky desertification information.
In recent years,with people's deeper understanding of remote sensing,some new classification methods continue to be put forward,such as texture analysis,band combination,neural networks,fuzzy classification,vegetation index and decision tree classification[2].A decision tree is a flowchart-like structure in which internal node represents test on an attribute,each branch represents outcome of test and each leafnode represents class label(decision taken after computing all attributes).A path from root to leaf represents classification rules.
In decision analysis a decision tree and the closely related influence diagram is used as a visual and analytical decision support tool,where the expected values(or expected utility)of competing alternatives are calculated.It is a decision support tool that uses a tree-like graph or model of decisions and their possible consequences,including chance event outcomes,resource costs,and utility.It isoneway to display an algorithm.The leaf node of decision tree corresponds to a category attribute value and different leaf nod es may correspond to the same category attribute value[3].
The decision tree method for remote sensing image classification,can easily integrate various kinds of knowledge outside the image,without need of any priori statistical assumption,so it has been widely used for remote sensing information extraction and image classification[2,4-8].
In this study,with Kaizuo Township in Chang shun County,Qiannan Prefecture of Guizhou Province as the objectof study,we use the decision tree classification method to classify the remote sensing images in the study area,in order to evaluate the overall classification accuracy and the automated extraction accuracy of rocky desertification information.
1 Overview of the study area
The geological and stratum structure is complex,and there outcropping rocks are carbonate rocks and non-carbonaceous rocks.It features a humid subtropical monsoon climate,and the rainfall is abund ant.There are various types of land resources,but the distribution is not even.The county is in the yellow soil zone.
Due to the differences in the rock,soil parent material,topography,hydrology conditions and the major soil forming process,some soil types are generated,such as yellow soil,lime-stone soil,purple soil and paddy soil.The major vegetation is subtropical evergreen broad-leaved forest,and because of the complex natural environment and diverse land types,there are many types of vegetation[9].
Kaizuo Township is in the northern partof the county,with a total area of69 km2(Fig.1).The terrain within the region can be roughly divided into three types:mountains in the eastern,western and middle parts and a small proportion of hills and plains are concentrated between the hills.The main land use types in the study area are wood l and,farmland,shrub,etc.The rocky desertification is mainly distributed in the southeast of the study area.
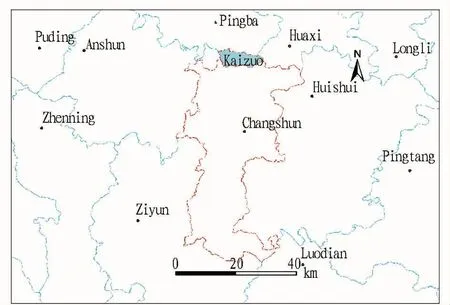
Fig.1 Location of the study area
2 Information and data preprocessing
The data used in this study include the ASTER image data in March 2005(Fig.2),1:50000 to pographicmap data in 1973,the vector file of Guizhou administrative division,and vector data and DEM data of Guizhou geological lithology.The software used includes ArcGIS9.2,ERDAS9.1 and ENVI4.3.
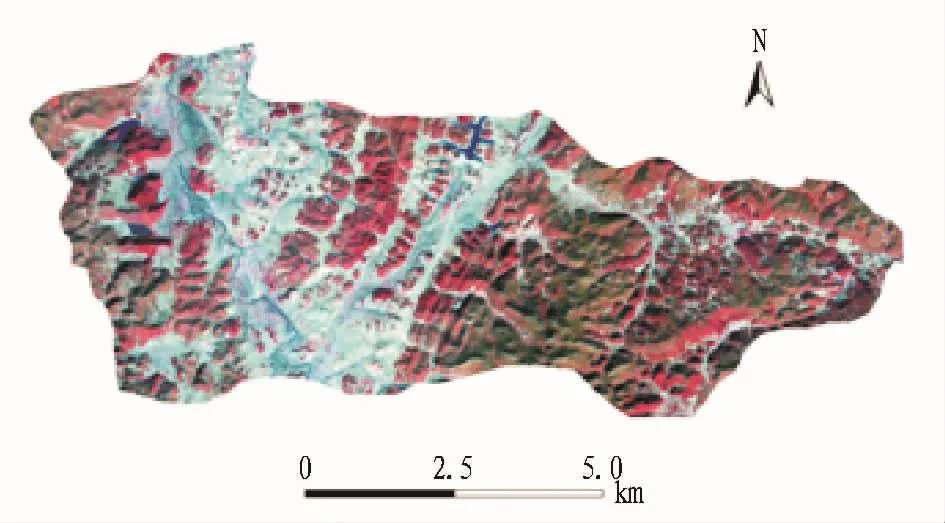
Fig.2 Pseudo-color image data of ASTER
Before remote sensing image classification,we usually perform feature selection and feature extraction.The classification is mainly based on spectral information of the image.
In terms of the band selection,the statistical characteristics analysis,principal component analysis and correlation analysis are used in principle,but in practice,people's visual effects are more important,which can help people to easily read and learn a variety of analytical results[10].
The resolution of green,red and near-infrared bands of ASTER data is15 m,and the three-band combination can better interpret vegetation,and classify vegetation.
In this study,the combination of these three bands is used,and the normalized difference vegetation index(NDVI)and ratio vegetation index(RVI)of image are estimated.1:50000 topographic map is scanned for geographic calibration.Based on this,the vector file of Guizhou administrative division is used to obtain the range of the study area,and then extract the remote sensing data within the study area.
(2)加强数据规范管理。开展财产行为税统一纳税申报表使用情况检查工作,对申报数据进行完整性、准确性、逻辑性审核,进一步提高申报数据质量,更好地满足财产行为税管理需求。
DEM data are from the free data of international scientific data mirror site of Computer Network Information Center.The resolution is 30 m,and the projection is UTM projection[11].The lithologic vector data are rasterized and the projection is defined and converted to UTM projection.
3 Building rules for the remote sensing image classification based on decision tree
According to the visual interpretation of remote sensing images and field surveys,the remote sensing images of the study area are divided into the following categories:woodland,shrub,rocky desertification land(including mild,medium,severe,extremely severe rocky desertification[12-13],as shown in Table 1),arable land(including paddy and upland without rocky desertification),construction land(including roads,settlements),and water body.
3.1 Distinguishing the vegetation coverage area and nonvegetation coverage areaSince the remote sensing images in the early spring,the vegetation coverage of the arable land area is relatively low,and NDVI is less than 0.NDVI of water body and construction land is less than 0.The shrub plant biomass is not high,and the NDVI is greater than 0.The woodland plant biomass is higher than the shrub plant biomass,and the NDVI is greater than 0.1.
The rocky desertification land is the shrubs,grassland or arable land mixed with bare rocks,and the NDVI is greater than 0 but less than 0.1.We classify the remote sensing image with NDVI less than 0 as the non-vegetation coverage area,and the remote sensing image with NDVI greater than 0 as the vegetation coverage area.
3.2 Classification of the non-vegetation coverage areaThe NDVI value of water body is less than-0.1,while the NDVI value of construction land and arable land is greater than-0.1.It is further divided with NDVI equal to 0.1 as the dividing point.If NDVI is less than-0.1,it is classified as water body,and if NDVI is greater than-0.1,it is classified as construction land and arable land.However,it can be seen from the result of the division that the dividing range of the water body is too large,and part of the cultivated land is divided into the water body.
The reason is that the excessive moisture of arable land leads to small differences bet ween the NDVI of cultivated land and water body.After comparing the gray values in B3 band(near-infrared band),the gray value of 30 in B3 band is taken as the dividing point for classification(<30,water body;>30,arable land).The construction land and arable land are divided based on the B1 band(green band)value of greater than 60,the B2 band(red band)gray value of less than 65,and the B3 band(near infrared band)gray value of less than 70.
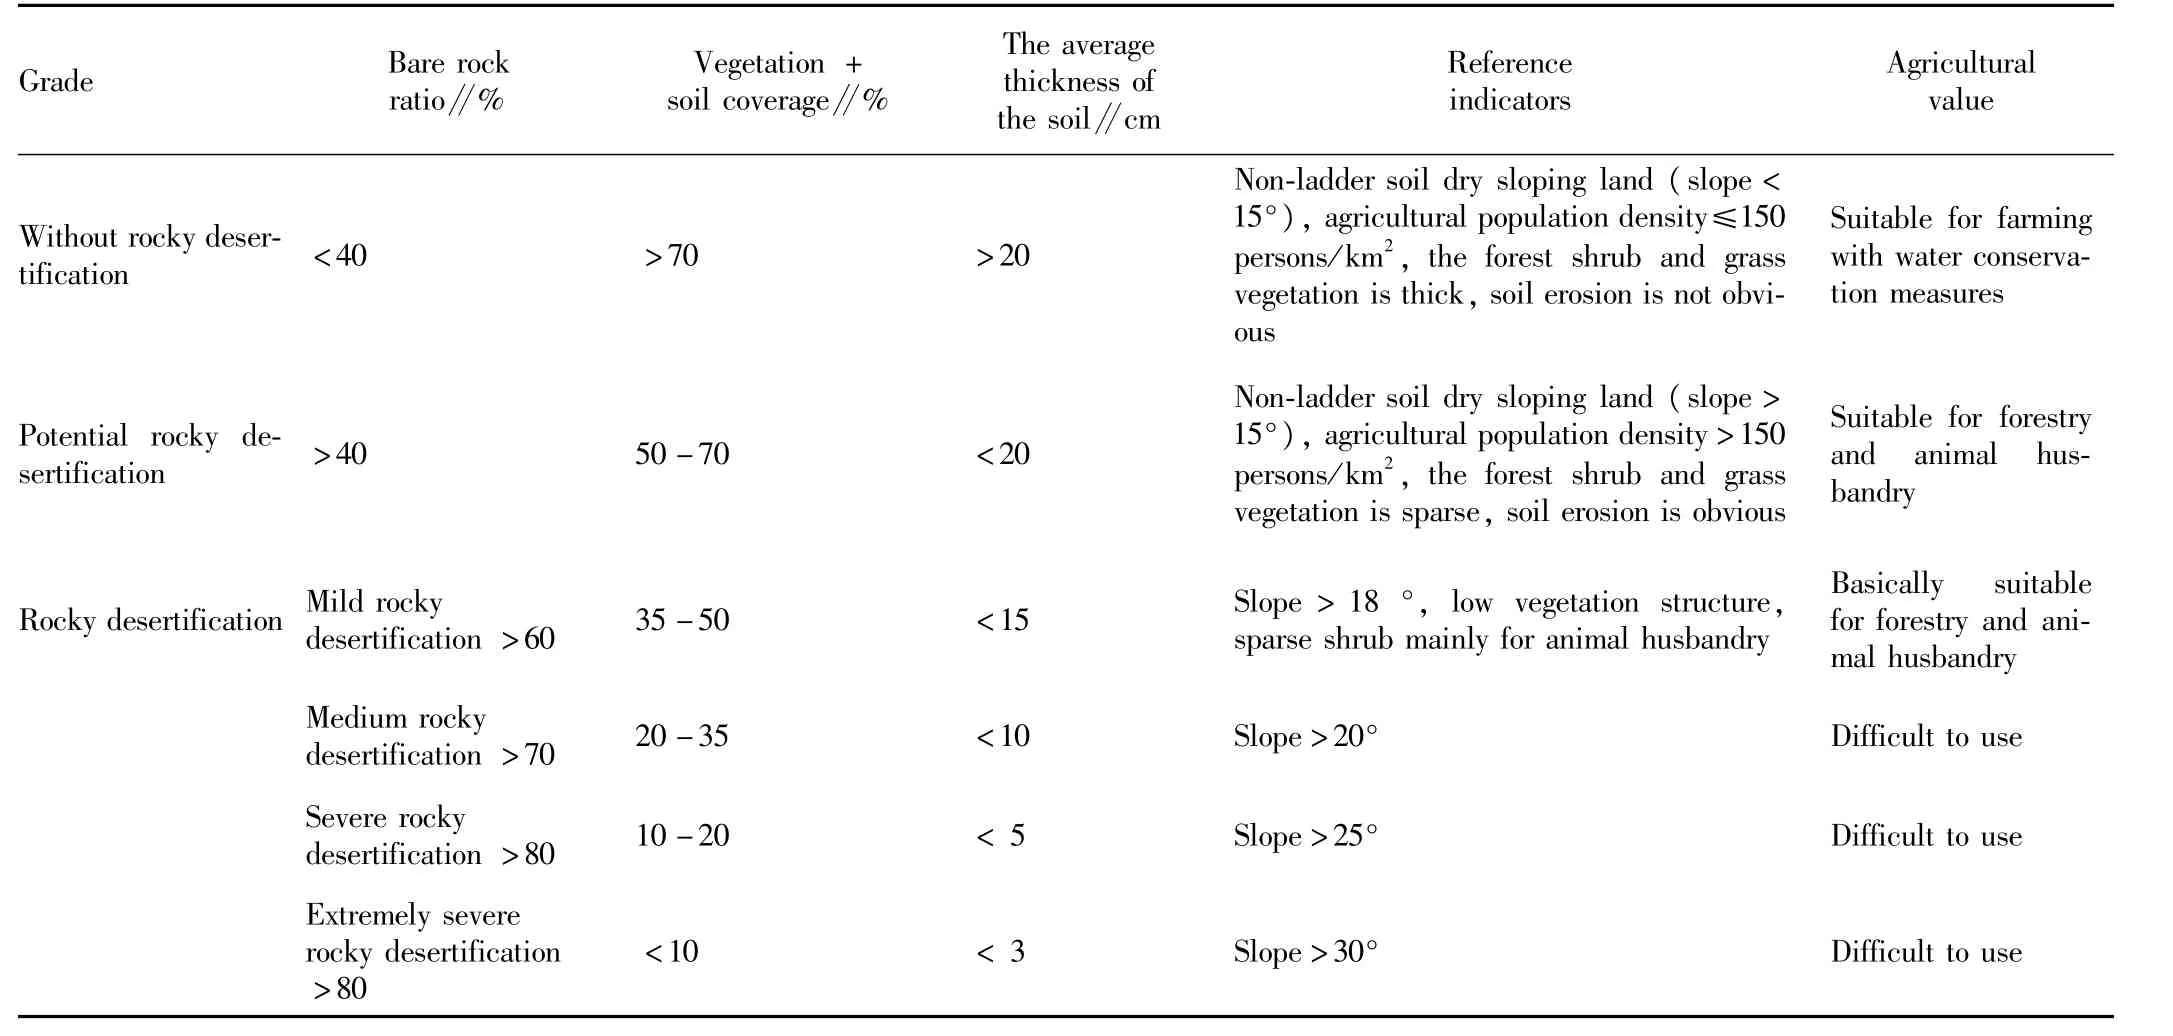
Table 1 The grade of karst rocky desertification and patch characteristics
But in the division results,the arable land contains some shrub information,which is due to the fact that its spectral feature is similar to that of arable land,and it is thus divided into arable land.According to the field survey,there is almost no arable land at the elevation of higher than 1450 m.Therefore,it is divided based on DEM of 1450 m combined with B3 band gray value of less than 30,to distinguish the shrub from the arable land.
In the dividing range of construction land,the spectral reflectance value of partof arable land is relatively high,slightly different from that of construction land,so it is divided into the construction land.With B3 band gray value of 50 as the dividing point,we can distinguish the arable land included in the construction land(<50,arable land;>50,construction land).
3.3 Classification of the vegetation coverage areaWith NDVI of greater than 0.1 as the dividing point,the woodland is marked off.The rocky desertification occurs mainly in the carbonate rock area.The lithology data are made into the raster format files,to get involved in the rocky desertification information extraction.
The value of the carbonate rock area is set to1,and based on the B3 band gray value of 45,the shrub and rocky desertification land are distinguished.
However,the dividing range of rocky desertification land contains the arable land information,and the rocky desertification mainly occurs in the regions with slope of greater than 18 degrees[12-13].According to field survey,the rocky desertification in this study area mainly occurs at the elevation of over1435m,and thus the rocky desertification land is marked off.
In order to get accurate rocky desertification information,we use ratio vegetation index RVI(B3/B2)of greater than 0.9 but less than 1.3,B2 band gray value of greater than 42 and DEM information to further divide and extract the rocky desertification information.The DN value statistics of typical object points are shown in Table 2.
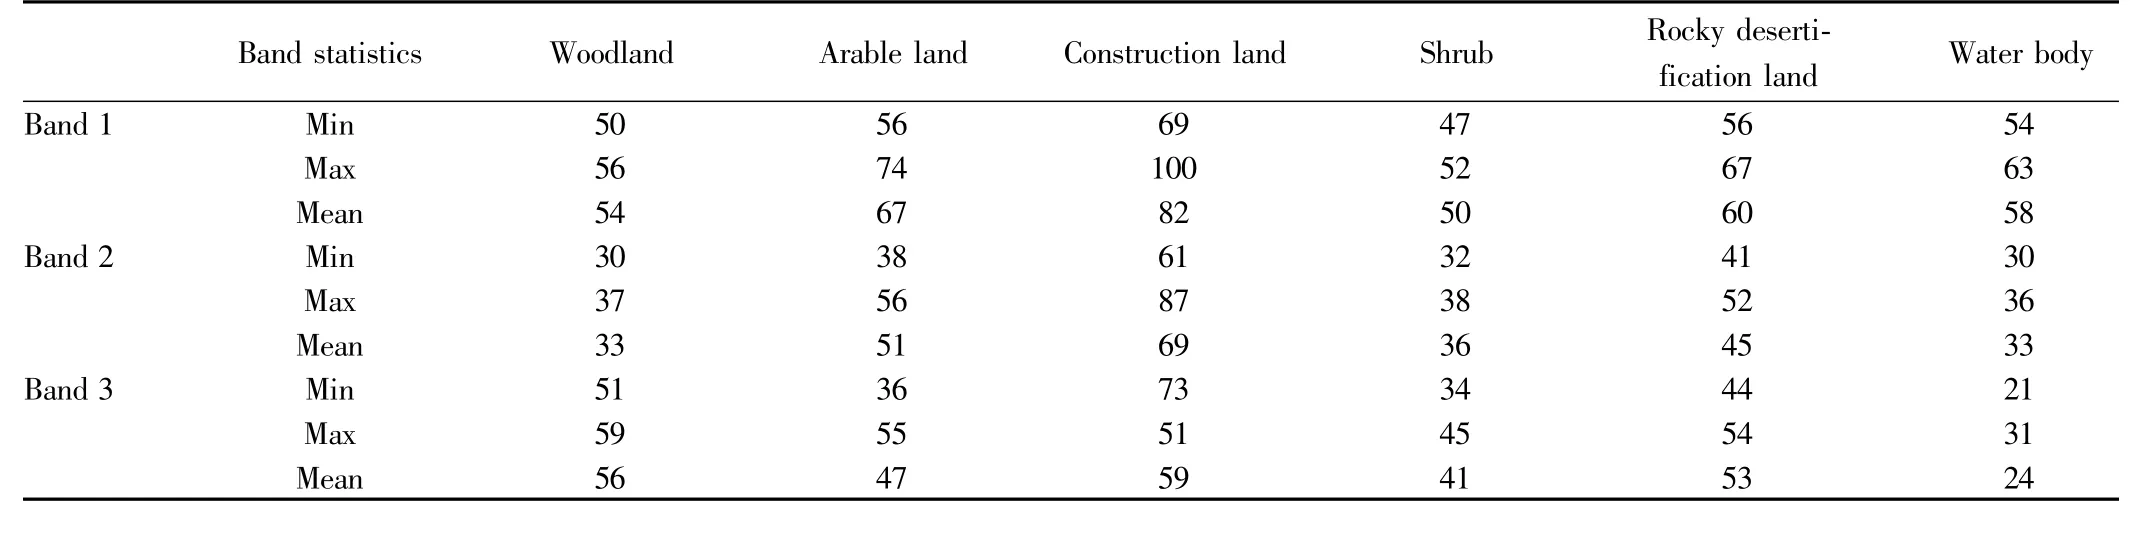
Table 2 The DN value statistics of typical object points
4 Decision tree building
According to the building rules for remote sensing image classification based on decision tree,the decision tree is built,as shown in Fig.3.
5 Image classification
The decision tree is built in the ENVI software,and by running the decision tree,we derive the final classification image data,as shown in Fig.4.
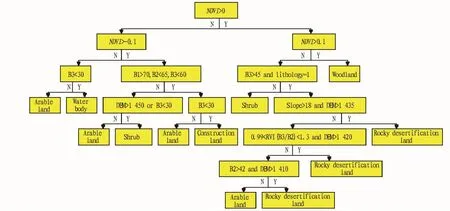
Fig.3 Decision tree
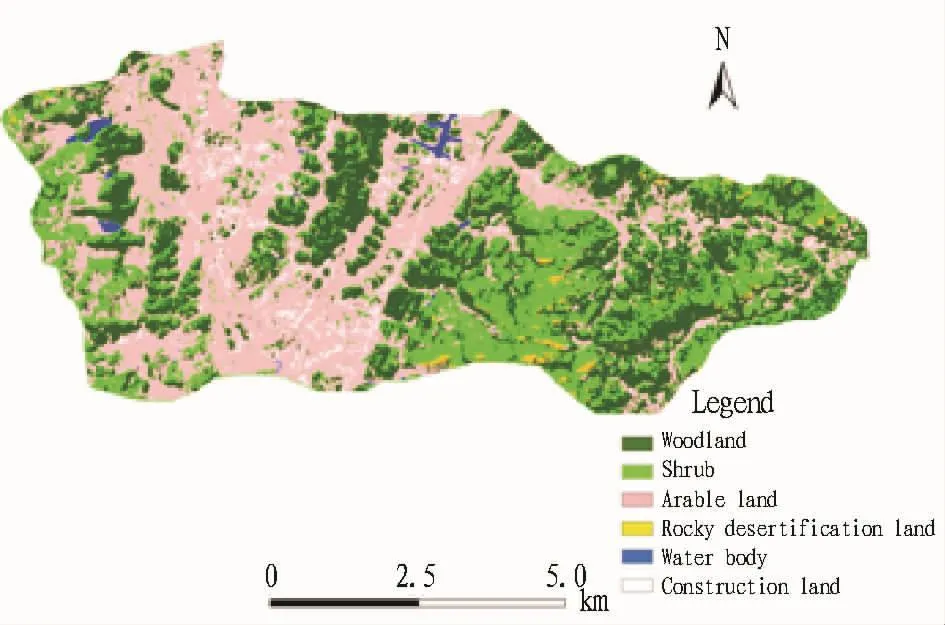
Fig.4 Classification results
6 Accuracy assessment
For the accuracy assessment,the confusion matrix is first built[12].According to the actual situation of the study area,the number of samples is determined according to the proportion of various types in the study area.The classification results obtained using the above decision tree method,are overlaid with the original image.Using visual interpretation and field verification,the confusion matrix is built(Table 3),and the relevant indicators are calculated for assessment.
By comparing the classification data of sample data and original image data,we calculate the error matrix,and derive the kappa coefficient which reflects the accuracy of classification.On thewhole,the overall classification accuracy is 89.3%,the kappa coefficient is 0.87,and the classification effect is good.The extraction accuracy of rocky desertification data is 74.1%,and the classification effect is good.
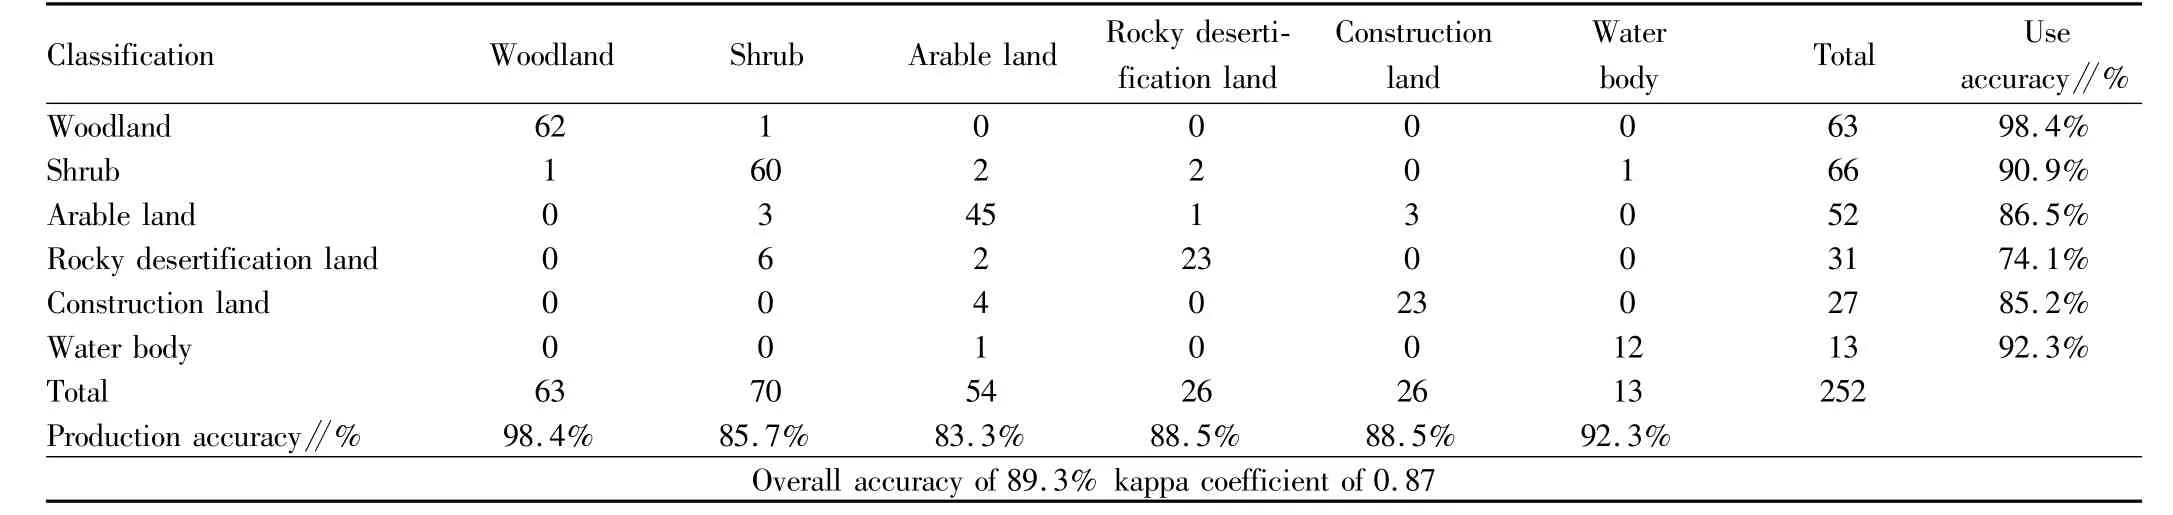
Table 3 Error matrix and accuracy assessment of decision tree classification
7 Conclusions
As can be seen from the classification accuracy and kappa coefficient,using decision tree method for the classification of remote sensing images in the karst rocky desertification areas can help us to get better classification results.Compared with the previous supervised classification and unsupervised classification,the knowledge of slope,lithology and DEM is included,more conducive to improving the classification accuracy.
The classification accuracy of rocky desertification land is 74.1%,and the classification effect is good.The rocky desertification information is automatically extracted,which is of great significance to promoting the rocky desertification studies.
However,there are few ASTER data bands in use,and the spectral information of remote sensing images can not be fully utilized.If it is multi-spectral data,the overall classification accuracy and rocky desertification information accuracy will be improved.In the process of data clipping,the neighbormean interpolation method used may cause half raster error between the gray value of clipped data and original data,which will affect the performance of the object gray value in the image.
In addition,due to the low resolution of DEM,it can not well match the remote sensing image data,so that the DEM data participate in the image classification many times,resulting in"excessive branches and leaves"of the decision tree.If there are DEM data of higher resolution,it will make the decision tree concise and improve the image classification accuracy.
[1]WANG SJ.Concept deduction and its connotation of Karst rocky desertification[J].Carsologica Sinica,2002,21(2):101-105.(in Chinese).
[2]WANGDP,WANGZL,CUICC,et al.Land use/cover classification based on decision tree in Longkou[J].Research of Soil and Water Conservation,2008,15(1):114-116,121.(in Chinese).
[3]SHENWM,WANGWJ,LUO HJ,et al.Classification methods of remote sensing image based on decision tree technologies[J].Remote Sensing Technology and Application,2007,22(3):333-338.(in Chinese).
[4]CHEN HL,CHEN ZH,DING GP.The application of the knowledge-based decision tree classification method to the extraction of land types in mining areas:A case study of Daye area,Hubei Province[J].Remote Sensing for Land&Resources,2004,9(3):49-53.(in Chinese).
[5]John D,CAIJF,CAIZX.Decision tree technique and its current research[J].Control Engineering of China,2005,12(1):15-18,21.(in Chinese).
[6]LIS,ZHANG EX.The decision tree classification and its application in land cover[J].Areal Research and Development,2003,22(1):17-21.(in Chinese).
[7]Fried MA,Brodeley CE.Decision tree classification land cover from remotely sensed data[J].Remote Sensing&Environ.,1997,61:399-409.
[8]SUN JB,SHU N,GUAN ZQ.Principles,methods and applications of remote sensing[M].Beijing:Surveying and Mapping Press,1997.(in Chinese).
[9]Compile Group of Synthetic Agriculture Regionalization of Changshun County.Synthetic agriculture region alization of Changshun County[M].Guiyang:Guizhou People’s Publishing House,1988.(in Chinese).
[10]CHEG B,JIANGQG,ZHOU YX,et al.Decision tree based on ASTER image classification and its application[J].Journal of Jilin Unviersity:Earth Science Edition,2007,37(1):179-184.(in Chinese).
[11]International Scientific&Technical Data Mirror Site,Computer Network Information Center,CAS[DB/OL].http://datamirror.csdb.cn.(in Chinese).
[12]YU Q.Research on the spectrum automatic extracting based on decision treemodel of karst rocky desertification[B].Guizhou Normal University,2009.(in Chinese).
[13]XIONG KN,LIP,ZHOU ZF,et al.The typical research on remote sensing-GISof the rocky desertification in Karsts areas[M].Beijing:Geological Publishing House,2002:87-89.(in Chinese).
猜你喜欢
杂志排行

Asian Agricultural Research的其它文章
- Quantile Regression Analysis on Convergence of China's Regional Econom ic Grow th
- A Study on Antibacterial Activity and Chem ical Com position of the Petroleum Ether Extract from Aspergillu sniger Mycelia
- Current Situation of Information Demand of Farmers in Taihang Mountain Area:A Case Study of Pingshan County in Hebei Province
- Analysis of the Influencing Factors and Key Driving Force concerning the Efficiency of Green Supply Chain of Fruits and Vegetables
- Study of the Option Ordering Policy concerning Perishable Farm Produce Based on Revenue Sharing Contract
- Study on Rural Poverty Reduction Effect of Traffic Infrastructure