Correlation of ADC value with pathologic indexes in colorectal tumor homografts in Balb/c mouse
2014-03-21XiaojunLiHongnanJiangJinliangNiuYingZheng
Xiaojun Li, Hongnan Jiang, Jinliang Niu, Ying Zheng
1Department of Radiology,2Department of Breast Surgery, the 2nd Hospital of Shanxi Medical University, Taiyuan 030001, China
Correspondence to: Xiaojun Li, M.S. Department of Radiology, the 2nd Hospital of Shanxi Medical University, Wuyi Road 382#, Taiyuan 030001, China. Email: judithli0305@sina.com.
Correlation of ADC value with pathologic indexes in colorectal tumor homografts in Balb/c mouse
Xiaojun Li1, Hongnan Jiang2, Jinliang Niu1, Ying Zheng1
1Department of Radiology,2Department of Breast Surgery, the 2nd Hospital of Shanxi Medical University, Taiyuan 030001, China
Correspondence to: Xiaojun Li, M.S. Department of Radiology, the 2nd Hospital of Shanxi Medical University, Wuyi Road 382#, Taiyuan 030001, China. Email: judithli0305@sina.com.
Objective:Noninvasive diffusion-weighted magnetic resonance imaging (DWI) is a well-studied MR imaging technique for quantifying water diffusion especially in tumor area. The correlation between apparent diffusion coeffcient (ADC) value and apoptosis or proliferation is not clear by now. This study aimed to investigate whether DWI-ADC value could be used as an imaging marker related with pathologic indexes of tumors.
Methods:A total of 30 Balb/c mice with HT29 colorectal carcinoma were subjected to DWI and histologic analysis. The percentage of ADC changes and the apoptotic and proliferating indexes were calculated at predefined time points. Kolmogorov-Smirnov distances were considered to determine whether the percentage of ADC changes, and the apoptotic and proliferating indexes were normally distributed. An independent-samples t-test was used to analyze the difference between apoptotic and proliferating indexes in the two groups.
Results:There was a statistically significant difference in proliferating index between the radiotherapy and control groups (mean proliferating index: 49.27% vs. 83.09%), and there was a statistically signifcant difference in apoptotic index between the two groups (mean apoptotic index: 37.7% vs. 2.71%). A signifcant positive correlation was found between the percentage of ADC changes of the viable tissue and apoptotic index. Pearson’s correlation coefficient was 0.655 (P=0.015). A significant negative correlation was found between the percentage of ADC changes of the viable tissue and ki-67 proliferation index. Pearson’s correlation coeffcient was 0.734 (P<0.001).
Conclusions:Our results suggest that ADC value may be used in measurement of cell apoptotic and proliferating indexes in colorectal carcinoma.
Diffusion-weighted magnetic resonance imaging (DWI); apparent diffusion coefficient (ADC); apoptosis; proliferation; HT29
View this article at:http://dx.doi.org/10.3978/j.issn.1000-9604.2014.08.06
Introduction
Noninvasive diffusion-weighted magnetic resonance imaging (DWI) is a well studied MR imaging technique for quantifying the increase in water diffusion caused by cell necrosis in tumors, prior to visible changes in tumor morphology or size, in responding patients with breast (1-3), brain (4,5), and pancreatic (6,7) cancers. DWI can be used to monitor cellular structures in biological media and has been proposed as a tool to distinguish different tissue compartments (8). Through the application of strong gradients in the imaging sequence, imaging is sensitized to the displacement of spins of diffusing protons. It is mainly the protons of bulk water that contribute to the signal in DWI, and not protons within macromolecules, membranes or water protons bound to macromolecules and membranes, because these are relatively immobile and have extremely short T2 values (9). The apparent diffusion coefficient (ADC) of water can be calculated from the images, whereapparent refers to the fact that these values are based on water protons experiencing different restrictions to diffusion inside several tissue or cellular compartments in a single voxel (8,9). The ADC depends on the presence of diffusion barriers, such as cell membranes and macromolecules, in the water microenvironment. Compartments with different cellular structures may, therefore, exhibit different ADCs and be identifed in ADC maps.
Most of the diffusion MR studies of experimental tumors estimate the ADC over a low range of b values. The signal decay over a low b value range (0<b<1,000 mm2/s) is monoexponential and dominated by water in the extracellular microenvironment. Consistent with this, a correlation is often found between the ADC measured at low b values and tumor cellularity observed in histological sections (10,11). Moreover, elevated ADC values have been correlated with the necrotic fraction of animal tumor models (12). In human breast cancer xenografts and radiation-induced fibrosarcomas, high ADC values are coincident with necrotic areas, which have low cellularity (13). A signifcant inverse correlation between ADC and cell density has been demonstrated in a clinical study of gliomas (14).
Information on microscopic structures in tissues other than cell density, such as the apoptosis and proliferation indexes of tumors would also be useful. Apoptosis is associated with an acidic microenvironment and a low oxygen concentration; features which may influence the response to e.g., radiotherapy, thermotherapy or chemotherapy. Cell proliferation may be indicative of tumor aggressiveness; several clinical studies suggest an increased metastatic capacity of highly cellular tumors (15-17). Currently we can only use invasive pathological methods to obtain information about tumor apoptosis and proliferation, but this method has signifcant defciencies: tested samples do not represent the whole tumor information, and it is easy to disseminate metastasis (fne-needle aspiration, puncture, etc.).
The aim of this study was to investigate the possible correlation between ADC value in DWI and histopathology (apoptotic and proliferating indexes) using a colorectal tumor model, in order to further elucidate the efficacy of using this technique in the prognosis and treatment of cancers.
Materials and methods
Animals, tumor model and animal preparation
HT29 cells, N-nitroso-N-methyl urethane-induced mouse colon carcinoma cells of BALB/c origin, were purchased from the American Type Culture Collection (ATCC). Cells were cultured in RPMI 1640 medium (GIBCO) supplemented with 10% heat-inactivated fetal calf serum (Hyclone) at 37 ℃ in a humidifed 50 mL/L CO2incubator. Cultures were passaged every 4 d with TEG solution (0.25% trypsin, 0.1% EDTA and 0.05% glucose in Hanks’ balanced salt solution).
Thirty-six female BALB/c mice (7-9 weeks) were obtained from Chinese Academy of Medical Sciences (Beijing). All animals were implanted with HT29 cells (3×10⁶cells in 0.2 mL culture medium) by subcutaneous injection into the left iliac region. Treatment was begun when tumors grew to 0.6-1.0 cm. Experiments were approved by the Institutional Animal Care and Use Committee of Shanxi Medical University and performed in accordance with the regulations of the NIH Guide for the Care and Use of Laboratory Animals. Six mice were excluded because of model inconsistency (too large or too small).
Thirty mice were scanned before radiotherapy, and divided into two groups, the radiotherapy group and the non-radiotherapy group. DWI and anatomic T2WI were performed on six randomly-chosen mice in total from two groups at different time points after radiotherapy (1, 2, 3, 5, 7 d). After imaging, in total six animals were sacrifced and histological analyses were undertaken.
Radiotherapy
Mice were anesthetized with pentobarbital (50 mg/kg i.p.). The iliac region was irradiated with a total of 12 Gy in 2 daily fractions (6 MV photon beam at source-to-axis distance of 100 cm, dose rate 2.4 Gy/min) by an accelerator (Clinac 1800, Varian Associates Inc., CA, USA). Two tissueequivalent polystyrene plates (1.5 cm upward and 4.5 cm downward) were used to provide adequate build-up.
MRI experiments
Small-animal DWI was performed with a 1.5-T MR imaging system (Signa EXCITE 1.5T HD Twinspeed, GE Medical Systems, Milwaukee, WI) and a surface coil (GE, 3-inch). Animals anesthetized using pentobarbital were placed in a box containing pure water at 37 ℃ to regulate body temperature and reduce artifact.
DWI data were collected using the parameters: repetition time ms/echo time ms, 6,000/84.5; imaging matrix, 64×64; feld of view, 10×10 mm; slice thickness, 3 mm; intersectiongap, 0 mm; No. of averages, 16; voxel size, 0.07 mm; b values, 0.100 s/mm2; bandwidth, 125 kHz.
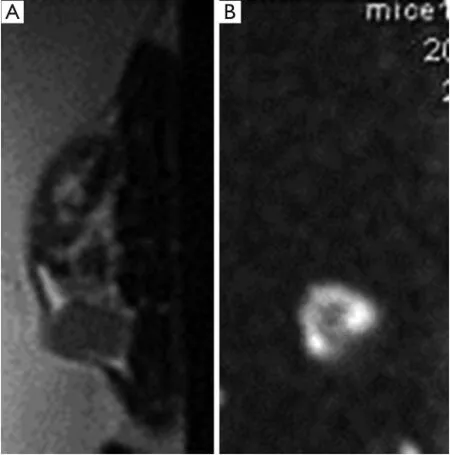
Figure 1 T2 weighted (A) and diffusion weighted (B) images.
T2WI data: repetition time ms/echo time ms, 2,500/76.4; imaging matrix, 160×128; field of view, 10×10 mm; slice thickness, 3 mm; intersection gap, 0 mm; No. of averages, 6; voxel size, 0.01 mm; bandwidth, 31.3 kHz.
Total acquisition time was approximately 12 min (Figure 1).
MR image analysis
MR images were analyzed by consensus between two radiologists, working on a workstation (AW4.2, GE). They were blind to the treatments each animal had received. ADC maps were calculated on a pixel-by-pixel basis by using built-in software (Functool, GE). Regions of interest were manually circumscribed for all high-signal areas on lesions observed during DWI.
The percentage of ADC change was calculated by using the formula, %ΔADCN= (ADCN– ADCB)/ADCB×100, where ADCBis the lesion pretreatment value and ADCNis the lesion ADC value at time N of radiotherapy [1, 2, 3, 5 and 7 d].
Histological analysis
After the mice were sacrificed, terminal deoxynucleotidyl transferase mediated dUTP nick end labeling (TUNEL) and Ki67 staining of each tumor tissue were performed. Four digital pictures were taken, away from areas of necrosis but otherwise randomly, by two investigators who was blind to the treatment each animal had received. Image analysis instruments (AI, LEICA) were used. The apoptotic and proliferating cells were segmented according to the signal intensity difference between target cells and background, while the intensity and minimum particle size thresholds were determined manually. The cell number was then counted in all pictures per tumor.
The apoptotic and proliferating indexes were all determined by counting a total of at least 1,000 neoplastic nuclei subdivided in 10 fields randomly chosen at 400× magnification. Positive signals were all defined as the presence of a distinct brown staining on nuclei of neoplastic cells (Figure 2).
Statistical analysis
Kolmogorov-Smirnov distances were considered to determine whether the percentage of ADC changes, and apoptotic and proliferating indexes were normally distributed. An independent-samples t-test was used to analyze the difference between apoptotic and proliferating indexes in the two groups.
Signifcant correlations between ADC changes from the bright signal intensity region and apoptotic cell density or the density of cells showing Ki67 expression were searched for by Pearson product moment correlation analysis. Correlation between ADC changes and time points was searched for by Spearman correlation analysis (SPSS, version 11.0; SPSS Inc., Chicago, IL, USA). P<0.05 was considered statistically signifcant.
Results
Apoptotic and proliferating indexes in two groups
According to α=0.05, there is a statistically significant difference in proliferating index between the radiotherapy and control groups (mean proliferating index: 49.27% vs. 83.09%). And there is a statistically significant difference in apoptotic index between the two groups. The mean apoptotic index in the radiotherapy group is greater than that in the control group (37.7% vs. 2.71%).
Time course of pathologic index and ADC value
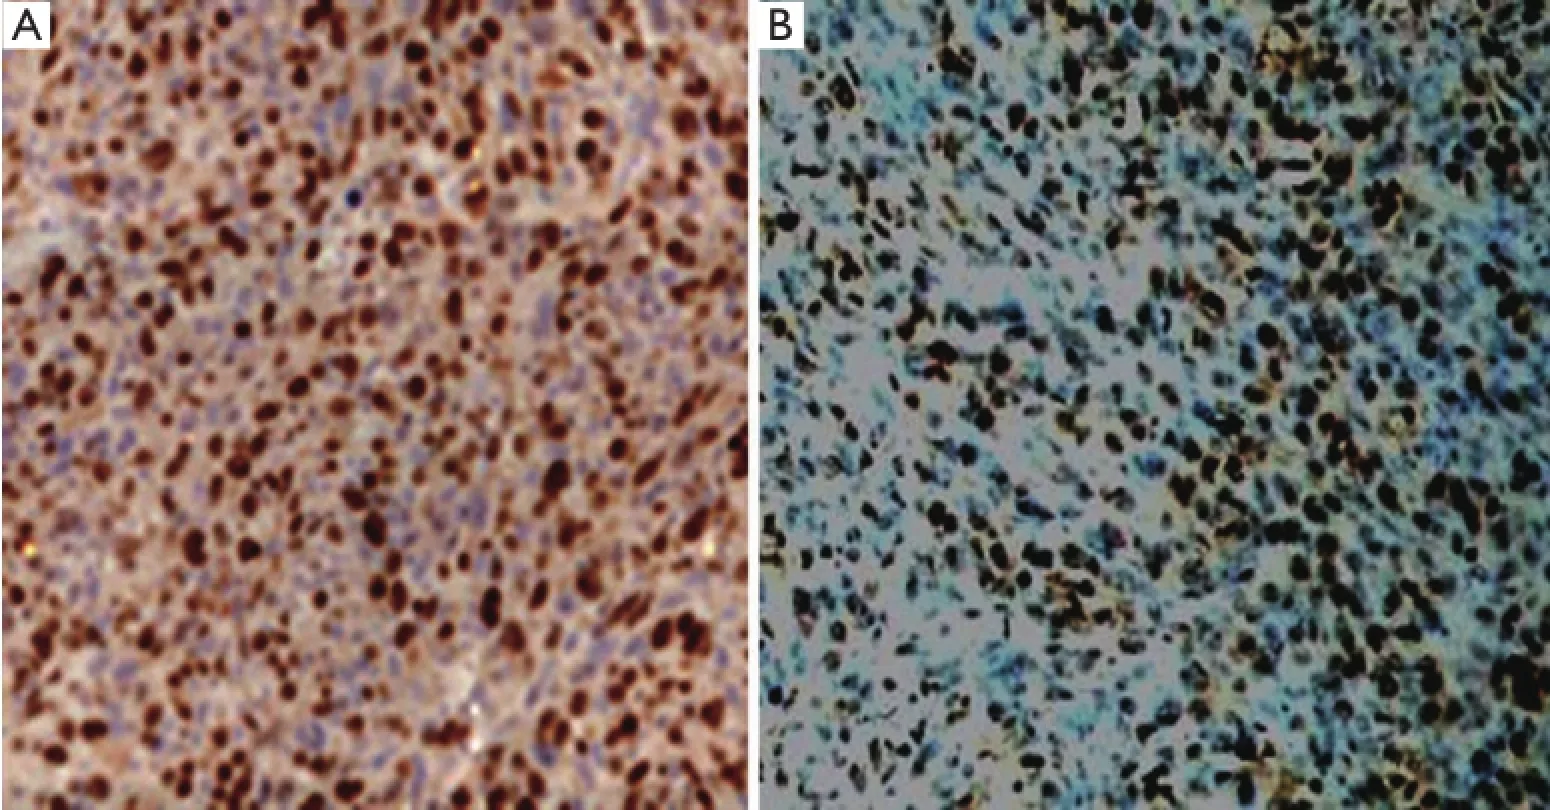
Figure 2 Brown yellow cells represent Ki67 positive (A) and apoptotic (B) cells (400×).
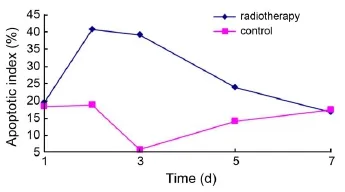
Figure 3 The time-dependent apoptotic index change in radiotherapy and control groups.

Figure 4 The time-dependent proliferating index change in radiotherapy and control groups.
Average apoptotic index in the radiotherapy group increased over the course of treatment, reached its highest level 2 d after radiotherapy, and returned towards baseline almost at the 7-d time point after radiotherapy. The apoptotic index in the control group differed somewhat, and was always less than that in the radiotherapy group except baseline and 7-d time point (Figure 3).
Average proliferating index in the radiotherapy group reached the lowest level 3 d after radiotherapy, then increased slightly, but was always less than the proliferating index at baseline. No signifcant difference was observed in the proliferating index between the two groups (Figure 4).
In the radiotherapy group, average ADC values reached the highest level 2-3 d after radiotherapy, no significant difference was observed in average ADC values between the two groups (Figure 5).
Percentage of ADC changes and apoptotic index
The percentage of ADC changes and the apoptotic index, were normally distributed (Kolmogorov-Smirnov test, P=0.87, 0.73, respectively; the median of the apoptotic index and the percentage of ADC changes are 24.1% and 14.2%, respectively). There is a positive correlation between the percentage of ADC changes and the apoptotic index: the calculated Pearson’s correlation coefficient is 0.655 (P=0.015) (Figure 6).
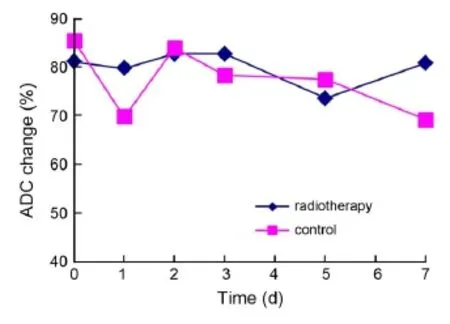
Figure 5 The time-dependent ADC value change in radiotherapy and control groups. ADC, apparent diffusion coeffcient.

Figure 6 Comparison of histological measures of tumor apoptosis with quantitative percentage of ADC changes. There is a positive correlation between the percentage of ADC changes and the apoptotic index. ADC, apparent diffusion coeffcient.
Percentage of ADC changes and proliferating index
The proliferating index was normally distributed (Kolmogorov-Smirnov test, P=0.78; median 69.79%). There is a negative correlation between the percentage of ADC changes and the proliferating index. The calculated Pearson’s correlation coeffcient is 0.734 (P<0.001) (Figure 7).
Discussion
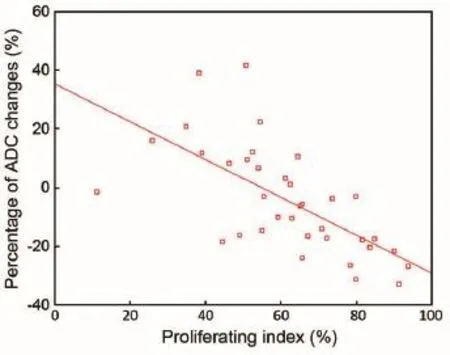
Figure 7 Comparison of histological measures of tumor proliferation with quantitative percentage of ADC changes. There is a negative correlation between the percentage of ADC changes and the proliferating index. ADC, apparent diffusion coeffcient.
Imaging biomarkers are important tools for monitoring response to therapy as well as for detecting and characterizing cancers (15). DWI depends on the microscopic mobility of water. This mobility, classically called Brownian motion, is due to thermal agitation and is highly influenced by the cellular microenvironment of water. Thus, DWI findings could provide an early harbinger of biologic abnormality. For instance, the most established clinical application of DWI is the assessment of cerebral ischemia where DWI fndings precede all other MR techniques (16). In oncological imaging, parameters derived from DWI are appealing as imaging biomarkers because acquisition is noninvasive, does not require exogenous contrast agents, does not use ionizing radiation, yet is quantitative, can be obtained relatively rapidly and is easily incorporated into routine patient evaluations (17). If correlations exist between the parameters of DWI and apoptosis or proliferation indexes, DWI could be developed into a desirable noninvasive tool to obtain information about tumor progression and response to anti-tumor therapy.
The ADC value is a quantitative parameter that measures the diffusion ability of water in DWI, and any factor which infuences the diffusion of water molecules will lead to changes in ADC values (18). A signifcant inverse correlation between ADC and cell density has been demonstrated in a clinical study of gliomas (14) and some experimental studies. In view of the importance of information on tumor apoptosis and proliferation in anti-tumor therapy, this study was designed to analyze possible correlations between the percentage of ADC changes and pathological parameters (apoptotic index and proliferating index). In this study, we used radiotherapy as anintervention to cause apoptosis in HT29 tumors, followed by DWI at different time points after radiotherapy, in order to analyze the correlations of different degrees of apoptosis and proliferation with the percentage of ADC changes.
Radiotherapy is known to kill tumor cells via apoptosis, one hallmark of which is a reduction of cell volume via blebbing. Benson et al. analyzed decreases in cell volume during apoptosis (19), and a study by Hakumäki et al. showed a 219% increase in the ADC of water in viral thymidine kinase-containing tumors induced to apoptosis with ganciclovir (20). As such we concluded that measured nuclear magnetic resonance parameters could potentially describe the biophysical signatures for apoptotic cell death.
In this study, TUNEL staining, in combination with histochemical analysis was used to accurately locate sites of apoptosis, but also to facilitate the detection of early apoptosis more effectively than using morphological criteria. The results indicate a moderate positive correlation between percentage ADC value changes and apoptotic index.
As ADC values are affected by the combined effect of intra- and extra-cellular volume fractions, when the apoptotic index increases, we consider that at least the following two factors will influence tumor ADC values. The first is that apoptosis can cause increased mobility of extracellular water through early cell shrinkage and loss of cell processes, thereby increasing the ADC value. The second is the change of intracellular environment in apoptotic cells, such as decreased nuclear/cytoplasmic ratio, increased perinuclear cisternae, condensed nuclear chromatin, chromatin margination, etc. These factors result in increased intracellular volume and as such intracellular water mobility is slow compared with extracellular water, which makes ADC values decrease slightly. However, when compared with extracellular changes, intracellular effects on water diffusion are an order of magnitude lower. Therefore, the overall impact of an increase in apoptosis is still marked by increased tumor ADC values.
The percentage of ADC changes we obtained correlated inversely with the Ki67 proliferation index. Cellular size changes during the cell cycle, from the smallest size cells seen in G1 phase, with a development through S phase and G2 phase to M phase, cell volume gradually increases, and the extracellular volume fraction gradually decreases. On the other hand, in the intracellular space, with increasing cell volume, the nuclear/cytoplasmic ratio gradually increases, and with it the intracellular volume fraction increases more than before. These two factors lead to extracellular/intracellular volume ratio decreases, thereby the ADC values decrease with increasing proliferation index. Several authors have reported that low ADC levels represent a good predictor of high-grade gliomas or have documented statistically significant results that separate high-grade tumors from low-grade tumors (21,22). However, in such studies, no correlation with Ki67 values was mentioned. Our study strengthens these fndings by comparing ADC and Ki67 values.
This study identified the viable part of the tumor as the region of interest (ROI), mainly because the cells respond to radiotherapy (i.e., high signal region in DWI), whereas necrotic tissue within the tumor will not. If samples contained the central necrosis, it would interfere with percentage ADC changes, and ADC value increases observed could be due to necrosis, not increased apoptosis or reduced proliferation.
We analyzed the correlation between the parameters of DWI and pathology, using the same type of tumor cells (HT29) in each case, which is different from other similar studies (in their studies, research objects are different pathological types of tumors, in essence, there are significant differences in cell density and proliferation activity). In addition, as these same-type tumor cells can be considered to be the same size, the difference of ADC changes is the result of apoptosis or cell proliferation accompanied by intra- and extra-cellular microenvironment changes, and not due to difference in cell size. This study also demonstrated the relationship between the changes in ADC changes, and apoptotic or proliferating indexes. Our study strengthens the fndings of previous studies by comparing ADC values, apoptosis and Ki67, and indicates that DWI can detect slight differences in same-type tumor cells which have undergone different therapy.
The study still has some research shortcomings. The primary limitation of ADC quantification relates to the fact that water released by apoptosis is not confned within the ROI but will diffuse out gradually over time. The increased amount of water generates greater water pressure, resulting in faster diffusion. Therefore, in diffusion-weighted imaging, it is critical to optimize the imaging time point after initiation of therapy to maximize the accuracy of measuring the therapeutic response. In our study, due to limited sample size, we have not elucidated the early time point. Furthermore, the correlation between the percentage of ADC changes and other pathological changes after radiotherapy, such as edema, hyperemia, hemorrhage, etc., has yet been analyzed in more detail.
In conclusion, the present results indicate that water ADCs can be a potential tool for noninvasively monitoring tumor cell apoptosis and proliferation information, to determine optimal therapeutic regimens, avoid side-effects and reduce unnecessary costs. Furthermore, this measurement of ADC values could also help quantitatively compare the anti-tumoreffcacies of different treatment regimens.
Acknowledgments
Disclosure: The authors declare no confict of interest.
1. Woodhams R, Matsunaga K, Kan S, et al. ADC mapping of benign and malignant breast tumors. Magn Reson Med Sci 2005;4:35-42.
2. Woodhams R, Matsunaga K, Iwabuchi K, et al. Diffusionweighted imaging of malignant breast tumors: the usefulness of apparent diffusion coeffcient (ADC) value and ADC map for the detection of malignant breast tumors and evaluation of cancer extension. J Comput Assist Tomogr 2005;29:644-9.
3. Rubesova E, Grell AS, De Maertelaer V, et al. Quantitative diffusion imaging in breast cancer: a clinical prospective study. J Magn Reson Imaging 2006;24:319-24.
4. Chenevert TL, Stegman LD, Taylor JM, et al. Diffusion magnetic resonance imaging: an early surrogate marker of therapeutic effcacy in brain tumors. J Natl Cancer Inst 2000;92:2029-36.
5. Provenzale JM, Mukundan S, Barboriak DP. Diffusionweighted and perfusion MR imaging for brain tumor characterization and assessment of treatment response. Radiology 2006;239:632-49.
6. Matsuki M, Inada Y, Nakai G, et al. Diffusion-weighed MR imaging of pancreatic carcinoma. Abdom Imaging 2007;32:481-3.
7. Ichikawa T, Erturk SM, Motosugi U, et al. High-b value diffusion-weighted MRI for detecting pancreatic adenocarcinoma: preliminary results. AJR Am J Roentgenol 2007;188:409-14.
8. Le Bihan D. Molecular diffusion, tissue microdynamics and microstructure. NMR Biomed 1995;8:375-86.
9. Szafer A, Zhong J, Gore JC. Theoretical model for water diffusion in tissues. Magn Reson Med 1995;33:697-712.
10. Sugahara T, Korogi Y, Kochi M, et al. Usefulness of diffusion-weighted MRI with echo-planar technique in the evaluation of cellularity in gliomas. J Magn Reson Imaging 1999;9:53-60.
11. Lyng H, Haraldseth O, Rofstad EK. Measurement of cell density and necrotic fraction in human melanoma xenografts by diffusion weighted magnetic resonance imaging. Magn Reson Med 2000;43:828-36.
12. Lemaire L, Howe FA, Rodrigues LM, et al. Assessment of induced rat mammary tumour response to chemotherapy using the apparent diffusion coeffcient of tissue water as determined by diffusion-weighted 1H-NMR spectroscopy in vivo. MAGMA 1999;8:20-6.
13. Theilmann RJ, Borders R, Trouard TP, et al. Changes in water mobility measured by diffusion MRI predict response of metastatic breast cancer to chemotherapy. Neoplasia 2004;6:831-7.
14. Gupta RK, Cloughesy TF, Sinha U, et al. Relationships between choline magnetic resonance spectroscopy, apparent diffusion coeffcient and quantitative histopathology in human glioma. J Neurooncol 2000;50:215-26.
15. Rudin M. Imaging readouts as biomarkers or surrogate parameters for the assessment of therapeutic interventions. Eur Radiol 2007;17:2441-57.
16. Johnston KC, Wagner DP, Wang XQ, et al. Validation of an acute ischemic stroke model: does diffusion-weighted imaging lesion volume offer a clinically signifcant improvement in prediction of outcome? Stroke 2007;38:1820-5.
17. Sun YS, Zhang XP, Tang L, et al. Locally advanced rectal carcinoma treated with preoperative chemotherapy and radiation therapy: preliminary analysis of diffusionweighted MR imaging for early detection of tumor histopathologic downstaging. Radiology 2010;254:170-8.
18. Prasad DS, Scott N, Hyland R, et al. Diffusion-weighted MR imaging for early detection of tumor histopathologic downstaging in rectal carcinoma after chemotherapy and radiation therapy. Radiology 2010;256:671-2; author reply 672.
19. Benson RS, Heer S, Dive C, et al. Characterization of cell volume loss in CEM-C7A cells during dexamethasoneinduced apoptosis. Am J Physiol 1996;270:C1190-203.
20. Hakumäki JM, Poptani H, Puumalainen AM, et al. Quantitative 1H nuclear magnetic resonance diffusion spectroscopy of BT4C rat glioma during thymidine kinasemediated gene therapy in vivo: identifcation of apoptotic response. Cancer Res 1998;58:3791-9.
21. Herneth AM, Guccione S, Bednarski M. Apparent diffusion coeffcient: a quantitative parameter for in vivo tumor characterization. Eur J Radiol 2003;45:208-13.
22. Bulakbasi N, Kocaoglu M, Ors F, et al. Combination of single-voxel proton MR spectroscopy and apparent diffusion coeffcient calculation in the evaluation of common brain tumors. AJNR Am J Neuroradiol 2003;24:225-33.
Cite this article as:Li X, Jiang H, Niu J, Zheng Y. Correlation of ADC value with pathologic indexes in colorectal tumor homografts in Balb/c mouse. Chin J Cancer Res 2014;26(4):444-450. doi: 10.3978/j.issn.1000-9604.2014.08.06
10.3978/j.issn.1000-9604.2014.08.06
Submitted Nov 04, 2013. Accepted for publication Apr 16, 2014.
杂志排行
Chinese Journal of Cancer Research的其它文章
- Aberrant DNA methyltransferase 1 expression in clear cell renal cell carcinoma development and progression
- In vitro effect of iASPP on cell growth of oral tongue squamous cell carcinoma
- Long-term survival outcomes of video-assisted thoracic surgery for patients with non-small cell lung cancer
- Embolization of symptomatic renal angiomyolipoma with a mixture of lipiodol and PVA, a mid-term result
- Decline of serum CA724 as a probable predictive factor for tumor response during chemotherapy of advanced gastric carcinoma
- TPX2 knockdown suppressed hepatocellular carcinoma cell invasion via inactivating AKT signaling and inhibiting MMP2 and MMP9 expression
