Pre-deformation for Assembly Performance of Machine Centers
2014-03-01SUNYongpingWANGDelunDONGHuiminXUERuniuandYUShudong
SUN Yongping, WANG Delun, , DONG Huimin, XUE Runiu, and YU Shudong
1 Department of Mechanical Engineering, Dalian University of Technology, Dalian 116024, China
2 Dalian Machine Tool Group Co., LTD, Dalian 116600, China
3 Department of Mechanical and Industrial Engineering, Ryerson University, Toronto M5B 2K3, Canada
1 Introduction
*The rapid development of the manufacturing industry has increased the demand for precision, heavy, and highly reliable CNC machine centers, which requires a flexible manufacturing line for machines[1]. In a machine tool production line, assembly is a key process for achieving machine center accuracy[2–3]. The fitting assembly method is the main approach used in the assembly stage. By applying this method, the repair link is adjusted based on worker experience. Thus, this step is becoming a bottleneck in mass production. Moreover, machine centers are subject to thermal and gravity load while in operation, during which volumetric performance varies based on the coordinate position[4–5]. Consequently, assembly accuracy and efficiency are affected. In such case the variation of deformation must be analyzed to enhance the machine assembly cycle and improve efficiency.
Recent research on machine assembly mainly focused on design for manufacture and assembly (DFMA) and computer-aided assembly process plan (CAAPP). This research status mainly focuses on three areas.
(1) DFMA. During the component design stage, DFMA reduces assembly costs, component count, and overall costs while improving the reliability of the product[6]. Boothroyd and Dewhurst developed the methodologies and computer solutions for DFMA[7–8].The concept has been applied in commercial design software.
(2) CAAPP. CAAPP is the function of determining how a product will be made to satisfy the requirements specified at the most economical cost[9]. Ref. [10] lays the foundation for computer-aided assembly sequence planning studies.The design method is widely used in process planning design.
(3) Geometric error compensation (GEC). Schultschik established the kinematic error vector model, which contains 18 motion errors[11]. KIM[12]developed a new volumetric accuracy analysis method based on the generalized geometric error models. KIRIDENA, et al[13],discussed an approach for modeling the effects of the positioning errors of a machine’s axes on the accuracy of the cutting tool in its work space. No study has been conducted on pre-deformation, with most involving only machine tool geometric error modeling.
However, although considerable research has been conducted on DFMA and CAAPP, the output of the former and the input of the latter lack the elastic deformation trajectory of moving components. This condition results in volumetric error in the workspace. Volumetric performance represents the overall errors of a machine center. Therefore,this factor has become an important index representing the quality of a machine tool. If the machine center structure is designed using DFMA and CAAPP, assembly accuracy will not reach up to the allowance. In such case, workers have to use the fitting assembly method, which restricts assembly efficiency.
In this paper, pre-deformation for assembly performance(PFAP) method, which compensates for volumetric error, is presented to improve the accuracy and performance of the machine center assembly. The concept of travel error of moving component is defined, and the machine center assembly performance is analyzed under cold condition and thermal balance condition, such that the expression of pre-deformation is established. Then, the guide surfaces in normal direction of the X, Y, and Z axes are processed with the pre-deformation function, and the performance of a machine tool is measured using a laser interferometer.Although pre-deformation method has been widely applied in production practice, its application in machine tool assembly is not clear. This paper is significant in the process improvement and structure design of precision machine tools.
2 Theory and Design Procedure
2.1 Design theory for pre-deformation
The machine center is composed of the X-, Y-, and Zaxis sub-systems. The table is the moving component of the X axis, the table-saddle is the moving component of the Y axis, and the spindle head is the moving component of the Z axis[14]. The functional point presents the relative motion between the component of the machine that carries the cutting tool and that which carries the work piece. The configuration and working volume of the vertical machine center (VMC) are shown in Fig. 1.

Fig. 1. Configuration and working volume of the vertical machine center
The working volume of VMC is defined by the travel of the machine linear axes for machining operations with dimensions of 850 mm×510 mm×510 mm. The X-, Y-, and Z-axis sub-systems are connected to bearings and ball screws. The column and bed are bolted to each other at the joints. Meanwhile, the internal weighted system of the column can reduce loading on the spindle. As shown in Figs. 2(a) to 2(c), the machine center structures during travel differ in terms of working volume.

Fig. 2.Three different coordinates of vertical machine center
When one component moves along its linear axis, the sustain component appears with a different degree of elastic deformation. The straightness, positioning, and angular errors are then generated. The concept of pre-deformation is thus presented. The fundamental theory is to process the guide surface in the contrary geometric error function during the cutting stage. When moving components move along their linear axis, geometric error could be compensated, and high accuracy and performance could be achieved.
2.2 Procedure of pre-deformation
The PFAP method for a machine center has three steps:(1) establishment of the model and features of assembly; (2)collaborative computer-aided engineering (CAE)calculation; and (3) contribution and variation analysis. The criterion for pre-deformation could be the basis for the improvement of the machine tool structure. The flow chart of pre-deformation for an assembly machine center is shown in Fig. 3.
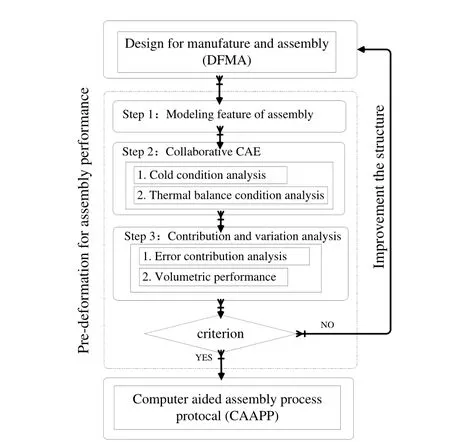
Fig. 3.. Flow chart of pre-deformation for assembly
The key point in pre-deformation is obtaining the variation of the function of geometric errors. PFAP has the following features.
(1) Precision compensation function. Based on the method of PFAP, the geometry errors caused by the structures are compensated with high accuracy, thus improving assembly performance.
(2) High-efficiency mass production. The surface of a slide-guide is processed by the grinder rather than through the manual fitting assembly method. This process could reduce the machine assembly cycle and improve efficiency.
(3) Weight-reduction structure design. A designer could realize a lighter component structure by using the PFAP method. A green design that avoids the heavy structure of moving components is achieved.
3 Modeling Assembly Features
The geometric error of a machine component along its axis of motion corresponds to six deflections, which is analogous to the six degrees-of-freedom of a body in space.This condition could ensure assembly accuracy by checking the geometric error under a quasi-static condition.Quasi-static errors are defined as errors that slowly vary with time and are related to the geometry of the machine center. A typical linear moving component (table) in the X direction[15]is shown in Fig. 4.

Fig. 4. Three translator and three rotary deflections of a table with one axis of movement
As shown in Fig. 4, error motions are identified by the letter E followed by a subscript, where the first letter is the name of the axis corresponding to the direction of the error motion, and the second letter is the name of the axis of motion. The linear error motion along the X direction is called the linear positioning error, which is expressed by EX(X). The other two translational error motions are called straightness errors, which are expressed by EY(X) and EZ(X). The angular error motion around the A, B, and C axes are EA(X), EB(X), and EC(X), respectively. Based on Fig. 4, 18 geometric VMC errors are shown in Table 1.

Table 1. Geometric errors of translator and rotary axis in the machine center assembly process
The variation of the deviation of the Y and Z directions of the table-saddle with X-axis movement is shown in Fig.5.

Fig. 5.. Moving trajectory of the travel error of the X-axis moving component
Definition 1: The machine center travel error is a function of coordinate position. If we consider a point where the coordinate is P0(x, y, z) in a numerical control system with an actual position P(x′, y′, z′), the translation axial error vector is shown in Eq. (1)

The travel error could be curve fitted by four-order polynomial data fitting and could be expressed in Eq. (2):

where E—Error of moving component,
X, Y, Z—Direction of error,
A, B, C—Rotation in the X, Y, Z axes,
(j)—Component of machine tool,
x, y, z—Travel of the X, Y, Z axes.
4 Coordinate CAE Calculation
The coordinate CAE analysis is a computer-aided analysis that calculates the deformation of a machine tool under both cold condition and thermal balance condition.Under cold condition, a machine tool is subject to gravity in standard ambient temperature (20 °C)[16–17]. Under thermal balance condition, the machine tool is subject to thermal-mechanical loading in thermal equilibrium. The framework of the pre-deformation of the coordinate CAE analysis of a machine tool is shown in Fig. 6.
As shown in Fig. 6, the solid model is built based on a 2D drawing. The element distribution of a machine tool is controlled by the program. The boundary and material properties are defined by the features of the machine tool.The cold condition and thermal balance condition are then calculated.

Fig. 6.Flow chart of coordinate CAE analysis of VMC
5 Error Contribution and Variation Analysis
5.1 Error contribution analysis
Different loadings could have different degrees of impact on machine tool travel error. Machine centers are subject to thermal and gravity load while in operation. Thus, 33 disperse position structures of working volume were calculated In order to determine the influence of different loadings on travel error. The conditions are gravity, thermal loading, and thermo-mechanical couple loading (T-M).Most of the travel errors are shown in Table 2.

Table 2. Summarizing of translator and rotary travel error
It is shown in Table 2 that the maximum geometric variation ratio of the X and Y axes is 18.3% of the allowance[18], whereas for the Z axis, the maximum value is 158.9%. EY(Z) and EA(Z) both exceeded the allowance,which can be attributed to the bending moment of the G structure loop. Thus, we should analyze the degree of influence in further detail.
As shown in Table 3, the deformation in Y-direction of Z component under thermal condition is approximately equal to the difference of the thermal balance and cold conditions.The maximum difference of variation and thermal condition is only 0.696 μm in the 0 coordinate under thermal condition. The results show that the deformation changes uniformly in the Z axis under thermal loading and that travel error is mainly caused by gravity.
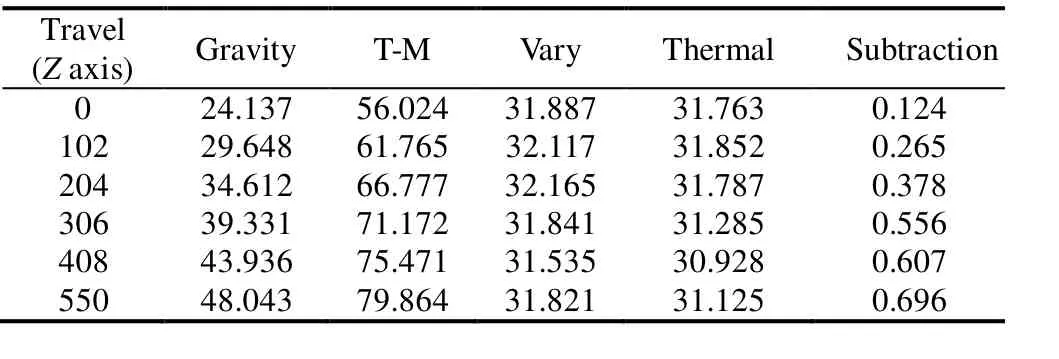
Table 3. Comparison of different conditions of the deformation in Y-direction of Z component μm
5.2 Volumetric performance
5.2.1 Counter map of working volume
First, 121 positions of the XY plane and 11 positions of the Z axis are calculated under cold condition and thermal balance condition to obtain the variation of the working volume. As shown in Figs. 7 and 8, a 3D gray map surface of travel error in XY plane is presented when the coordinate of the Z axis is 255.

Fig. 7.. Travel error of XY plane under cold condition (μm)

Fig. 8.. Travel error of XY plane under thermal balance condition (μm)
As shown in Figs. 7 and 8, the variation of travel error in the XY plane presents a half-cylinder under cold condition with a maximum of −4.25 μm. On the other hand, under thermal balance condition, the XY plane presents an inclined surface with a maximum of 3.69 μm. The travel error variations can be attributed to the asymmetric arrangement caused by the heat source in the fixed end. A 3D gray map surface of travel error in the YZ plane is presented in Figs. 9 and 10, in which the table is in between the X and Y axes.

Fig. 9.. Travel error of YZ plane under cold condition (μm)

Fig. 10.Travel error of YZ plane under thermal balance condition (μm)
As indicated in Figs. 9 and 10, the variation of travel error in the XY plane presents an inclined surface under cold condition and thermal balance condition with a maximum of 23.9 μm. The gradient of cold condition is very similar to that of the thermal balance condition.
5.2.2 Travel error components
From the above analysis, the travel error in the Z axis exceeded the allowance, whereas the travel error of the X and Y axes in the Z direction are in the sensitive direction.Thus, the travel error of the Z axis in the Y direction as well as the travel error of the X, Y component in the Z direction should be discussed further. The deviation of the travel error can be attributed to the straightness. When straightness is analyzed, the other axes are assumed to be located near the center travel of the machine tool axes.
As illustrated in Fig. 11, the travel error under cold condition and thermal balance condition of the X axis is contrasted. Under cold condition, the maximum elastic deformation is at the 0 and 850 coordinates. The straightness reaches the minimum at the 425 coordinate and presents as a convex shape in during travel. Under thermal balance condition, the travel error presents an asymmetric shape and is caused by the DB bearing arrangement. The straightness values are only 1.38 μm and 1.49 μm, with a difference of only 0.11 μm.

Fig. 11.Straightness deviations of X component in Z direction
As shown in Fig. 12, the travel error in the Y axis is contrasted. Under cold condition, the straightness is 1.16 μm and presents an uphill (uptrend) shape. Under thermal balance condition, the straightness is 1.35 μm and likewise presents an uphill shape. The two conditions both exhibit an uphill (uptrend) shape, and the variation of straightness is only 0.21 μm.

Fig. 12.Straightness deviations of Y component in Z direction
As indicated in Fig. 13, the travel error in the Z axis is contrasted. Under cold condition, the straightness is 23.33 μm and presents an uphill (uptrend) shape. Under thermal balance condition, the straightness is 23.84 μm and likewise presents an uphill shape. Both conditions exhibit an uphill (downtrend) shape, with a difference of only 0.51 μm. Other travel errors of the vertical machine center are shown in Appendix.

Fig. 13.Straightness deviations of Z component in Y-direction
5.3 Pre-deformation of machine center
Based on the analysis, the Z direction is found to be the sensitive direction of error, and EY(Z) significantly exceeded the allowance. Thus, the data on slide pre-deformation is curve fitted using the least square method through four-order polynomial data fitting. The function of pre-deformation is shown in Eq. (3):

The parameters of Eq. (3) are shown in Table 4. The data on the pre-deformation curve in the X-, Y-, and Z-axis moving components are shown in Fig. 14.

Table 4. Parameters of least squares (Eq. (3))
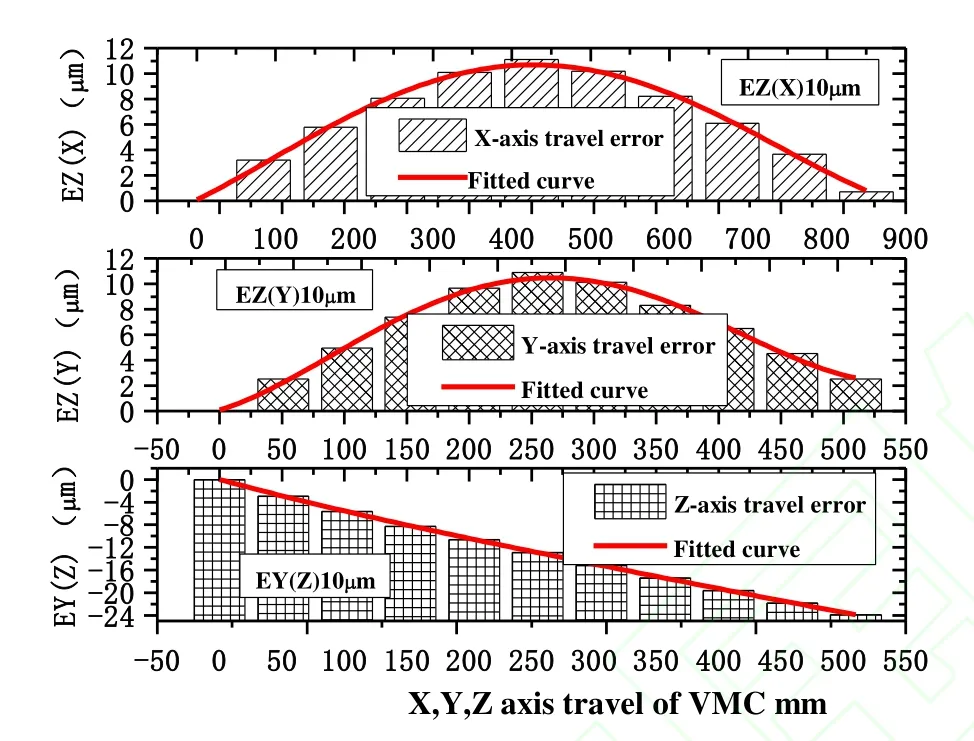
Fig. 14.Pre-deformation function of guide surface in normal direction
The function of pre-deformation is shown in Fig. 14. The pre-deformation of vertical machine center is set as follows:(1) The variation of the X-axis travel error changes in a convex shape, whereas that in the Y axis changes in an uptrend shape, but deformation is minimal. The data should exhibit 10 μm pre-deformation in a convex shape when considering the abrasion of the G-structure of the machine tool. (2) The variation of the Z-axis travel error exceeded the allowance and should thus present a downhill shape.The variation of the Z axis is approximately linear. Thus,the joints of the bed and column should be processed with an angle of 8.94″ or the slide should be processed with the opposite deformation.
6 Verify Experiment
6.1 Test instruments and method
The machine center assembly performance is verified in this experiment. The travel error measurement device consists of a computer and a laser interferometer (laser head, optical module, dual reflector, and temperature compensation module). The resolution of straightness is measured as 0.1 μm. Fig. 15 shows the experiment device.

Fig. 15.Direct measurement using an interferometer
The components of VMC move at a constant speed, and the optical modal follows the movement, thus facilitating changes in the optical lens group of the beam. The travel error could then be measured.
6.2 Verification and discussion
The guide surfaces in normal directions are grinded using a precision grinder according to the data shown in Fig.14. The travel error is measured by travel error measurement device after the assembly, and the tested results are shown in Fig. 16.
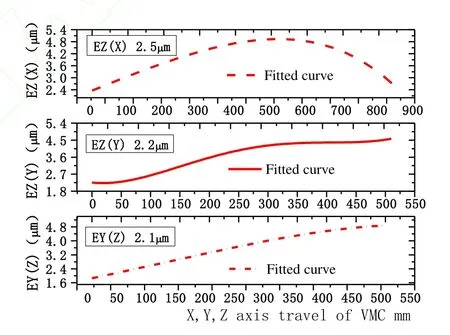
Fig. 16.Measurement result of performance experiment
As shown in Fig. 16, the normal direction straightness of the X axis is 2.5 μm, and that of the Y axis is 2.2 μm. This difference is mainly attributed to the installation error. EY(Z)is 2.1 μm, which has been reduced by 91.2% of the travel error of the Z-axis component.
7 Conclusions
(1) According to the pre-deformation of vertical machine center, this method is technically based on the modeling feature of assembly and on coordinate CAE analysis, by which the precision assembly performance of a machine center is realized.
(2) Through the coordinate CAE analysis of a C-type frame machine center under cold and thermal balance conditions, gravity is demonstrated to be the main cause of travel error in workspace volume.
(3) The straightness of the X- and Y-axis components is minimal. Thus, the grinding allowance should be equal to 10 μm of pre-deformation in a convex shape to consider the abrasion of the slide.
(4) The straightness of the Z-axis moving component is 158.9% of the allowance. Thus, the joints of the bed and column should be processed with an angle of 8.94″ or the slide should present a downhill shape.
(5) An experiment test on the assembly performance of VMC pre-deformation is conducted. EY(Z) has been reduced to 91.2%. The results verify that a high accuracy of machine tool could be achieved by the PFAP method.
[1] WIENDAHL H P, EIMARAGHY H A, NYHUIS P, et al. Changeable manufacturing-classification, design and operation[J]. CIRP Annals-Manufacturing Technology, 2007, 56(2): 783–809.
[2] HUSSAIN T, YANG Z, POPOV A A, WILLIAM S Mc. Straight-build assembly optimization: a method to minimize stage-by-stage eccentricity error in the assembly of axisymmetric rigid components(two-dimensional case study)[J]. Journal of Manufacturing Science and Engineering, 2011, 226(7): 1259–1274.
[3] ARAI T A, TAKEUCHI K A. Simulation system on assembly accuracy[J]. CIRP Annals-Manufacturing Technology, 1992, 41(1):37–40.
[4] WECK Manfred. Handbook of machine tools volume 2: construction and mathematical analysis[M]. New York : Wiley, 1984.
[5] MAYR Josef, JEDRZEJEWSKI Jerzy, UHIMANN Eckart, et al.Thermal issues in machine tools[J]. CIRP Annals-Manufacturing Technology, 2012, 61(2): 771–791.
[6] BOOTHROYD Geoffrey, DEWHURST Peter, KNIGHT Winston A.Product design for manufacture and assembly[M]. USA: CRC Press,2011.
[7] BOOTHROYD G, ALTING L. Design for assembly and disassembly[J]. CIRP Annals-Manufacturing Technology, 1992, 41(2):625–636.
[8] BOOTHROYD Geoffrey, DEWHURST Peter, KNIGHT Winston A.Product design for manufacture and assembly[J]. Computer-Aided Design, 1994, 26(7): 505–520.
[9] MARRI H B, GUNASEKARAN A, GRIEVE R J. Computer-aided process planning: a state of art[J]. The International Journal of Advanced Manufacturing Technology, 1998, 14(4): 261–268.
[10] HOMEM DE MELLO S Luiz, LEE Sukhan. Computer-aided mechanical assembly planning[M]. Massachusetts, Springer, 1991.
[11] SCHULTSCHIK R. The components of the volumetric accuracy[J].Annals of the CIRP, 1977, 25(1): 223–228.
[12] KIM K, KIM M K. Volumetric accuracy analysis based on generalized geometric error model in multi-axis machine tools[J].Mechanism and Machine Theory, 1991, 26(2): 207–219.
[13] KIRIDENA V, FERREIRA P M. Mapping the effects of positioning errors on the volumetric accuracy of five-axis CNC machine tools[J].International Journal of Machine Tools and Manufacture, 1993, 33(3):417–437.
[14] HUNG Jui Pin, LAI Yuan Lung, LIN Ching Yuan, et al. Modeling the machining stability of a vertical milling machine under the influence of the preloaded linear guide[J]. International Journal of Machine Tools and Manufacture, 2011, 51(9): 731–739.
[15] ISO 230-1, Test code for machine tools–Part 1: Geometric accuracy of machines operating under no-load finishing conditions[S]. ISO,2007.
[16] ISO 230-3, Test code for machine tools–part 3: determination of thermal effects[S]. ISO, 2007.
[17] ASME B5.54, Methods for performance evaluation of computer numerically controlled machining centers[S]. ASME, 2005.
[18] ISO 10791-1, Test conditions for machining centers. Part 1:geometric tests for machines with horizontal spindle and with accessory heads (horizontal Z-axis)[S]. ISO, 1998.
杂志排行
Chinese Journal of Mechanical Engineering的其它文章
- Theoretical Analysis and Experimental Verification on Valve-less Piezoelectric Pump with Hemisphere-segment Bluff-body
- Carbody Structural Lightweighting Based on Implicit Parameterized Model
- Prediction-based Manufacturing Center Self-adaptive Demand Side Energy Optimization in Cyber Physical Systems
- Effectiveness of a Passive-active Vibration Isolation System with Actuator Constraints
- Numerical Simulation and Analysis of Power Consumption and Metzner-Otto Constant for Impeller of 6PBT
- Proceeding of Human Exoskeleton Technology and Discussions on Future Research
