Yield and tillering response of super hybrid rice Liangyoupeijiu to tillage and establishmentmethods
2014-02-27*
*
College of Agronomy,Hunan Agricultural University,Changsha 410128,China
Yield and tillering response of super hybrid rice Liangyoupeijiu to tillage and establishmentmethods
M.A.Badshah,Naimei Tu*,Yingbin Zou,M.Ibrahim,Ke Wang
College of Agronomy,Hunan Agricultural University,Changsha 410128,China
A R T I C L E I N F O
Article history:
Received 3 August 2013
Received in revised form
30 October 2013
Accepted 18 November 2013
Available online 26 November 2013
Establishment method
Super hybrid rice
Tillage
Tillering
Yield
Tillering is an important agronomic trait for rice grain production.To evaluate yield and tillering response,Liangyoupeijiu(super hybrid rice)was grown in Hunan,China during 2011–2012 under different methods of tillage(conventional and no-tillage system)and crop establishmentmethods(transplanting at a spacing of 20 cm×20 cmwith one seedling per hill and direct seeding at a seeding rate of 22.5 kg ha-1).Our results revealed that,at maximum tillering(Max.)and at maturity(MA)stages,direct seeding(DS)resulted in 22%more tillers than transplanting(TP)irrespective of tillage system.Tiller mortality reached a peak between panicle initiation(PI)and booting(BT)stages,and was 16%higher under conventionaltillage (CT)than under no-tillage(NT).Transplanting required 29%more time for the completion of tillering and less for DS.Tillering rate was 43%higher in DS than TP under either CT or NT. There was a positive correlation between panicle number per m2and maximumtiller number per m2,but not panicle-bearing tiller rate.The panicle bearing tiller rate was higher under DS than TP and higher under NT than CT.Tiller dry weight gradually increased up to heading(HD) stage,and was 14%higher under TP than DS.Leafarea(cm2tiller-1)gradually increased from Max.to HD stage and then decreased by 34%in conventionaltillage transplanting(CTTP)and 45%in no-tillage transplanting(NTTP)from 12DAH–24DAH(days after heading),but was similar(35%)under DS under either CT or NT.Grain yield was higher under CTTP owing to the larger sink size(heavier panicle,more spikelets in per cm length of panicle)than under DS. ©2013 Production and hosting by Elsevier B.V.on behalf of Crop Science Society of China and Institute of Crop Science,CAAS.
1.Introduction
Tillering in rice(Oryza sativa L.)is an important agronomic trait for panicle numberper unitland area as wellas grain production [1].The panicle-bearing tiller rate influences the grain yield of rice[2]and excessive tillering leads to high tiller abortion,poor grain setting,smallpanicle size,and further reduction in grain yield[3,4].For this reason excessive branching is often considered expensive[5],and formation of lowly productive tillers is considered an investment loss to the plant.Tilleringcharacteristics can be altered by changes in environment and agronomic practices[6]and should be considered in relation to light intensity,temperature and carbohydrate metabolism. Higher panicle numbers per m2of direct-seeded rice are due to higher maximum tiller number per m2but not to higher panicle-bearing tiller rate[7].Tillage is considered to be the oldest and the most effective farm activity for developing a desired soil structure.Tillage improves the physicalconditions of soiland favors the rooting characteristics ofplants,leading to better rice yield.No-tillage was reported to lead to a reduction of rice tillering,effective panicle number,and filled kernels[8]. Grain yield under no-tillage was 13.4%lower than that under conventional tillage,and grain yields were in the order of conventional tillage(CT)>minimum tillage>no-tillage(NT)[9]. Some information is available about direct seeding and transplanting effects on tillering characteristics,but very little information is available describing the combined effect of tillage and crop establishment methods on tillering response in relation to grain yield.This study was accordingly undertaken to investigate the combined effect of tillage and crop establishment methods on tillering characteristics and their subsequent effect on grain yield of the super hybrid rice Liangyoupeijiu.

Table 1–Soil properties of the experimental field.
2.Materials and methods
2.1. Experimental location and soil
A field experiment was conducted in a moist sub-tropical monsoon climate during 2011–2012(May to September).The soilproperties of the experimentalfield are presented in Table 1.
2.2. Weather conditions during crop growing period
Average maximum and minimum temperatures were similar under TP and DS in both years from SWto PI and from HD to MA but were highest at Mid.–Max.during 2012.Average sunshine hour was highest at Mid.–Max.during 2012 in TPbut similar in DS in both years.Average rainfall was higher in 2012 than in 2011 under both TP and DS(Table 2).
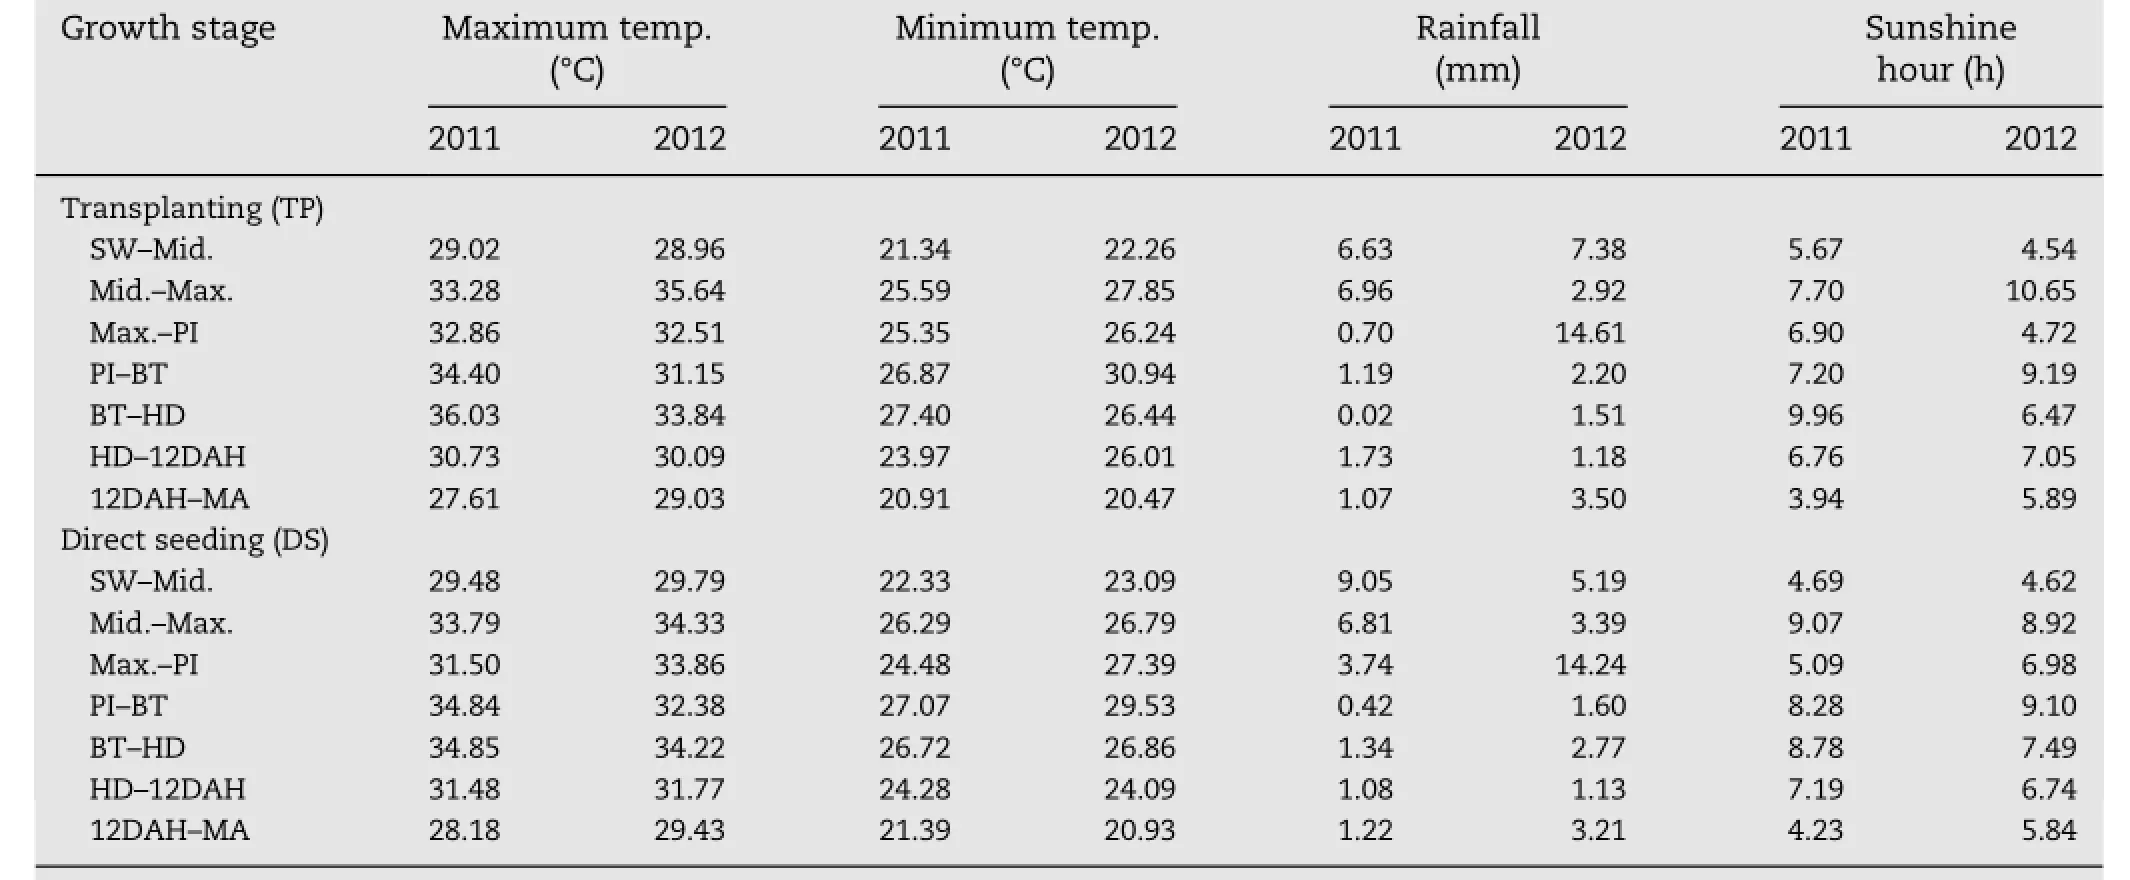
Table 2–Weather data during crop growing period,Changsha,Hunan,China.
2.3. Experiment design and fertilizer management
The field experiment was conducted in a factorialrandomized complete block design with four replications.The unit plot size was 30 m2.Factor A was tillage system,with levels being conventional tillage(CT)and no-tillage(NT),and factor B was crop establishment method,with levels being transplanting (TP)and direct seeding(DS).The treatment combinations were conventional tillage and transplanting(CTTP),no-tillage and transplanting(NTTP),conventional tillage and direct seeding(CTDS),and no-tillage and direct seeding(NTDS).For CT,land was prepared by animal-drawn plowing followed by harrowing,and for the plots of NT,by using a non-selective herbicide and flooding.For TP,twenty five-day old seedlings were manually transplanted at a spacing of 20 cm×20 cm with one seedling per hill on June 8th.For DS,pre-germinated seeds were manually broadcasted on the soil surface at a seeding rate of 22.5 kg ha-1on May 24th.Fertilizer(per ha) was applied as 150 kg N,90 kg P2O5and 180 kg K2O.Fertilizer N was spit as 90,45 and 15 kg ha-1at basal,mid-tillering and panicle initiation stages,respectively.Fertilizer P2O5was applied at basal stage.K2O was split equally at basal and panicle initiation(PI)stages.Weeds,insects and diseases were controlled by recommended methods.
2.4. Sampling
Plants of 0.48 m2area(60 cm×40 cm iron frame)from two different locations in DS plot and twelve hills for TP of each unit plot(2×2 hills from three locations)were selected and marked for tiller counting.Counting was performed at mid-tillering(Mid.),maximum tillering(Max.),panicle initiation(PI),booting(BT),heading(HD)and maturity(MA)stages. Plant samples were separated into stem(the vegetative parts including leaf blades,culm plus sheath and dead tissues), panicles(at BT,HD,12DAH and MA stages)and spikelets(at maturity stage).The vegetative plant parts were oven-dried at 70°C to constant weight and then weighed to calculate the stem dry weight of the respective stage.Panicle number was counted from the 12 hills and 0.48 m2sampled area at maturity stage.At MA,a 5 m2area was harvested for grain yield and the grain was adjusted to a 14%moisture level.
2.5. Measurements and methods
Tillering duration(TD)was calculated from sowing to the date of maximum tiller number.Tillering rate(TR)=the maximum number tillers/TD.Panicle bearing tiller rate(PBTR)=(number of panicles per m2/number of maximum tillers per m2)×100.Tiller mortality at different growth stages=(TL1-TL2)/TL1×100,where TL1is the totaltiller number at time T1, and TL2is the total tiller number at time T2.
Mid.is defined as the midpoint between TP and PI.The PI stage was determined by dissecting five main stems starting from 40 DAT.BT was measured at 20 days after PI.HD was taken as the time when 80%of stems had more than 50%of panicle exerted.The crop reached maturity when 90%of the spikelets turned from green to yellow.Canopy height was measured from the soil surface to the top level of the canopy at every growth stages.
2.6. Data analysis
Statistical analyses were performed using Statistix 9,analytical software,Tallahassee,FL,USA.Means of cultivation methods were compared according to the least significant difference(LSD)test at the 0.05 probability level.Figures were constructed using Microsoft Excel 2003.
Although the results were higher in 2012,all parameters showed similar trends among treatments in both years.For this reason,analyses were performed using the combined results of the two years.
3.Results
3.1. Canopy height dynamics
Canopy height(cm)varied significantly among the treatments at all crop growth stages except BT.Canopy height increased with time from Mid.to HD stage.At every sampling date,TP rice had higher canopy height than DS rice.At HD,the highest canopy height(127.1 cm)was found under the CTTPtreatment and NTTP,CTDS and NTDS resulted in lower and statistically identical canopy heights(Fig.1).

Fig.1–Canopy height dynamics at different growth stage,bar represents SE.
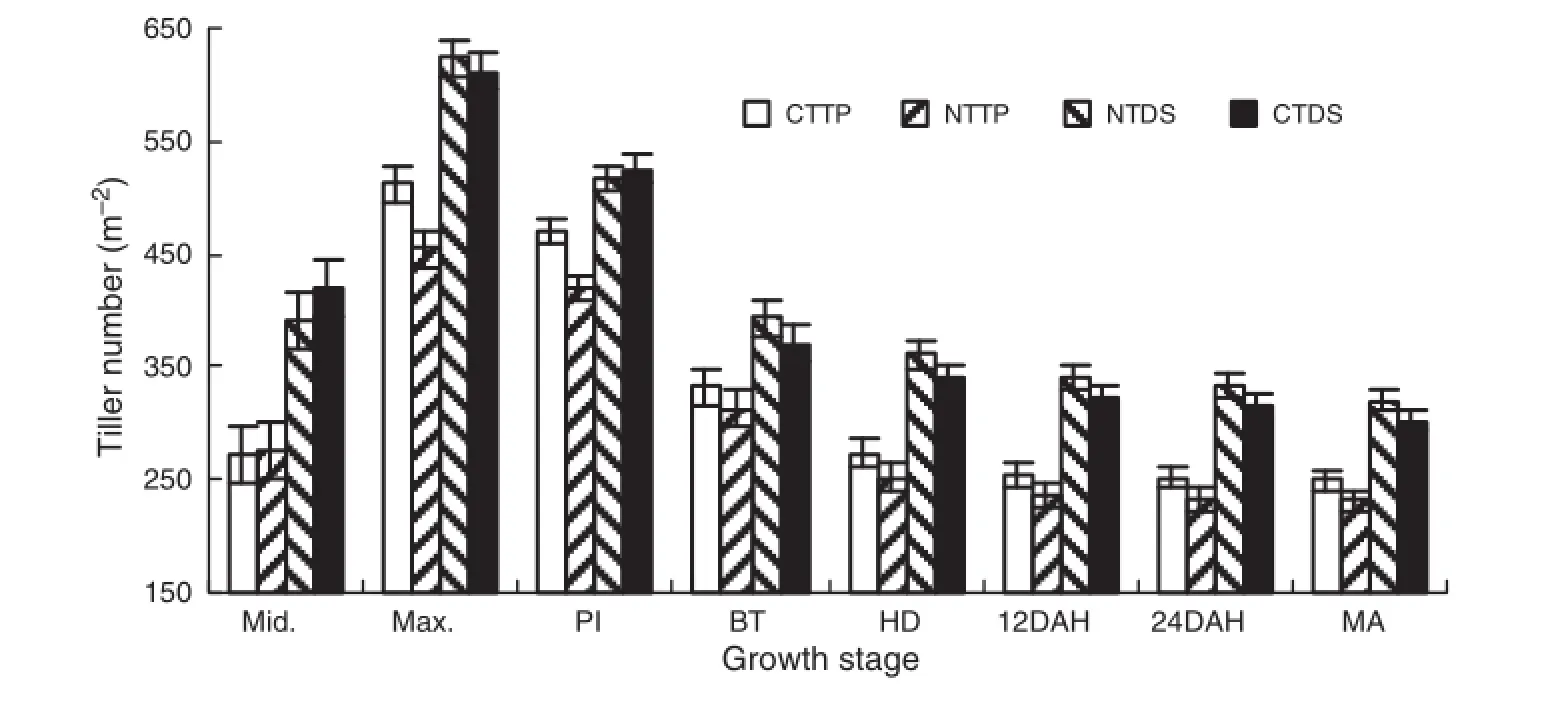
Fig.2–Tillering pattern at different growth stage,bar represents SE.
3.2. Tillering pattern
Tiller number varied significantly among the treatments at all crop growth stages.Tiller number under DS was always higher than under TP irrespective of tillage system at allgrowth stages and was higher under CTTP than under NTTP except at the Mid. stage.At Max.stage,CTTP showed a significantly higher tiller number(512 per m2)than NTTP(454 per m2)but both NTDS and CTDS showed statistically identical tiller numbers(624 and 612 per m2respectively).NTTP showed the lowest tiller number among the treatments(Fig.2).
3.3. Tiller mortality pattern
Tiller mortality varied significantly among the treatments at all growth stages except PI–BT,HD,12DAH and Max.–MA. Tiller mortality began at PI,reached a peak in the PI–BT stage, and then gradually decreased with time untilmaturity.At the Max.–PI stage,DS rice showed higher tiller mortality than TP rice but lower at BT–HDand HD–12DAH under either CT or NT. At PI–BT,higher tiller mortality was observed for CTTP(29.1%) and CTDS(29.4%)and NTDS showed lower tiller mortality than NTTP but with no significant difference.At the Max.–MA stage,the difference in tiller mortality between DS and TP was the smallest(Fig.3).
3.4. Tillering duration and tillering rate
Both tillering duration(TD)and tillering rate(TR)varied significantly among the treatments.The TD was longer under TP than DS but TR was higher under DS than TP in either CT or NT.TD was longer in CTTP(59 days)followed by NTTP and lower duration was observed for NTDS and CTDS methods.NTDS had higher TR(15.3 m-2day-1)followed by CTDS.There was no significant difference in TR between CTTP and NTTP(8.8 and 8.0 m-2day-1)respectively(Fig.4).
3.5. Relationship of maximum tiller number with panicle number and bearing tiller rate(PBTR)
There was a significant correlation between panicle number per m2and maximum tiller number per m2,but not between maximum tiller number and panicle-bearing tiller rate(Fig.5).
3.6. Dry weight of tiller
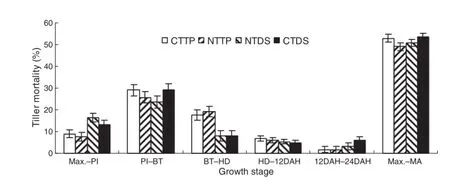
Fig.3–Tiller mortality(%)at different growth stage,bar represents SE.

Fig.4–Effect of treatments on tillering duration and tillering rate,bar represents SE.
The dry weight of the vegetative part of tillers varied significantly among the treatments at all crop growth stages.The tiller dry weight gradually increased until HD and decreased at the MA stage.TP under either CT or NT had higher tiller dry weight than DS except at the tillering stage.NTTP had higher tiller dry weight than CTTP at all growth stages except the tillering and MA stages.However,CTDS produced higher tiller dry weight than NTDS at all growth stages except the tillering and HDstages.Tiller dry weightwas higheratthe HDstage in all treatments and NTTP had higher(4.3 g)tiller dry weight which was statistically not different fromthat of CTTP.Also there was no significant difference in tiller dry weight between NTDS and CTDS at the HD stage(Fig.6).
3.7. Leaf area per tiller
Leaf area(cm2tiller-1)varied significantly among the treatments at all growth stages of the crop.There were significant differences among establishment methods on all sampling dates.Leaf area increased sharply from the Max.to the BT stage,then slightly increased at the HD stage,and then gradually decreased with time.Leaf area per tiller was always higher under TP than DS at all growth stages.CTTP always had higher leaf area than NTTP,and CTDS than NTDS(Fig.7).
3.8. Spikelet per cm panicle,panicle dry weight,bearing tiller rate(PBTR)and grain yield
Number of spikelet per cm of panicle varied significantly among the treatments.CTTP and NTTP had significantly higher numbers of spikelet per cm of panicle than CTDS and NTDS.Panicle dry weight at maturity varied significantly among the treatments.Panicle dry weight under TP was higher than that under DS under either CT or NT.CTTP had heavier panicles(4.3 g)than NTTP.NTDS and CTDS were similar in panicle dry weight.The TP method resulted in 12% longer and heavier panicles than DS.The panicle bearing tiller rate(PBTR)varied significantly among treatments and was higher under DS than under TP and higher under NT than under CT for either TP or DS.PBTR was higher in NTDS(53.2%) which was statistically identical to NTTP and was lowest in CTTP.Grain yield differences were significant among the treatments.CTTP method produced the highest grain yield (9.54 t ha-1)among the treatments and the remaining treatments produced identical grain yield(Table 3).
4.Discussion
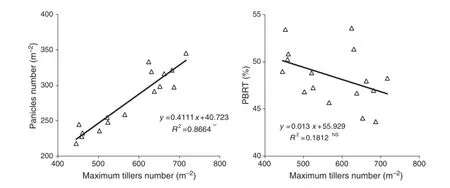
Fig.5–Relationship between maximum tiller number with panicles and panicle bearing tiller rate.
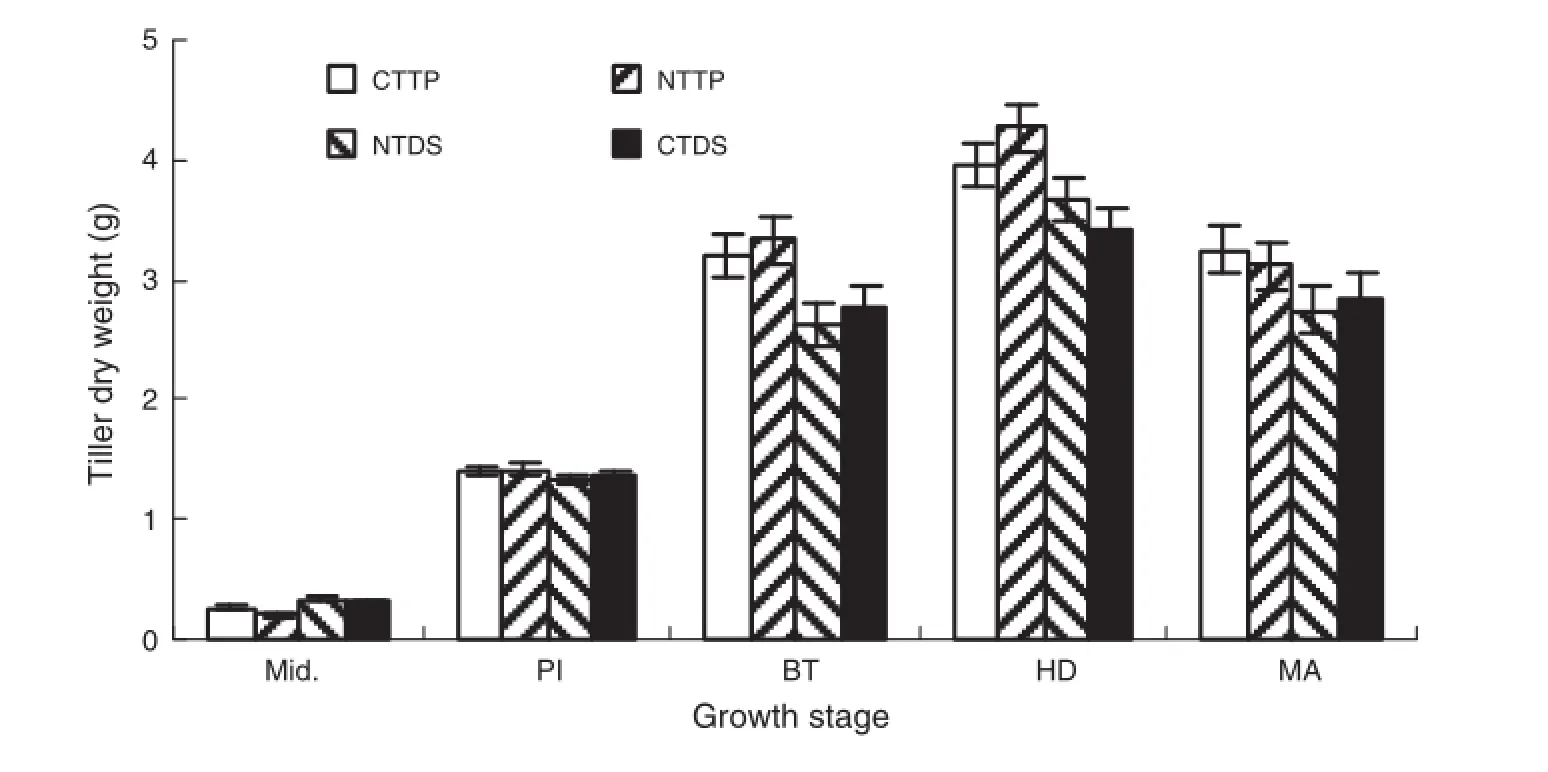
Fig.6–Tiller dry weight(vegetative part),bar represents SE.
Canopy height is influenced by plant population density,and was always higher under TP at all growth stages.At HD,TP had the highest canopy height in both years owing to higher maximum and minimum temperatures and more sunshine hours at the BT–HD stage(Table 2).Canopy height was lower under DS on allsampling dates owing to lower maximum and minimum temperatures and sunshine hours at the BT–HD stage than under TP(Table 2)as well as a crowding effect(Ali [10]).At Max.and MA stages,DS showed 22%more tillers than TP irrespective of tillage system owing to a higher number of plants per unit land area.At early growth stage of rice,NTTP had higher number of tillers than CTTP.Thereafter,tiller number was always higher in CTTP than NTTP owing to deeper root penetration and uptake of more nutrients.Huang et al.,[7]reported that NT leads to root accumulation on the surface of soil layer under both TP and DS conditions.Tiller mortality reached a peak in the PI–BT stages,was 16%higher in CT than NT,and then gradually decreased with time up to 24DAH.Treatment differences were reduced because of tiller abortion,intra-plant competition and partial lodging,under DS.Excessive tillering leads to high tiller abortion,poor grain setting,small panicle size,and further reduced grain yield [3,4].At Max.to MA stage,difference of tiller mortality between DS and TP was smaller(<3%).Transplanting required 29%more time for the completion of tillering and a lower time was required for DS owing to early sowing in seed bed as well as elimination of transplanting shock.Tillering rate was 43% higher under DS under either CT or NT owing to a higher number of plants per unit land area.Maximum tiller number made the largest contribution to panicle number.There was no significant correlation between maximum tiller number and bearing tiller rate,indicating that the higher the tiller number,the higher the senescence.Our study showed that maximum tiller number(per m2)was lower in TP and that panicle number per m2was positively related to maximumtiller number per m2,but not to panicle-bearing tiller rate.This result supports the findings of Huang et al.[7],but excessive tillering leads to high tiller abortion,poor grain setting,small panicle size,and further reduced grain yield[3,4].The tiller dry weight gradually increased up to the HD stage and then decreased at the MA stage owing to translocation of dry matter from vegetative organs to sinks.Transplanting under either CT or NT resulted in higher tiller dry weight than did DS at allgrowth stages owing to lower inter-plant competition for light,space and nutrients but totalabove ground biomass was higher under DS than under TP owing to a higher number of tillers per unit land area.Badshah et al.[11]reported that,DS produced more above ground biomass than TP but that at maturity,both CTTP and NTDS had higher above ground biomass and NTTP was the lowest.Leaf area per tiller varied significantly among the treatments at all growth stages of the crop.It also varied significantly among the establishment methods at allsampling dates owing to high population density under DS resulting in increased mutual shading of plants[12]and a consequent acceleration in leaf senescence[13].Leaf area gradually increased from Max.to HD stage and then decreased by 34%inCTTP and 45%in NTTP from 12DAH–24DAH but was similar (35%)for DS under either CTor NT.Leaf area was reduced more in NTTP than CTTP owing to early drying of plants resulting from the shallower root system under NT.This result agrees with that of Huang et al.[7].Badshah et al.[11]reported that,LAI increased up to the BT stage under TP and the HD stage under DS under both CT and NT and then gradually declined up to 24DAH.CTTP had higher LAI than NTTP at all crop growth stages.Similarly,CTDS had higher LAIthan NTDS.Grain yield is a function of biomass accumulation from heading to maturity and translocation to kernels of reserve pre-stored before heading[14].Ithas often been suggested that rice yield increase depends more on translocation to kernels of biomass accumulated before heading than on biomass accumulation from heading to maturity[15,16].CTTP and NTTP showed significantly higher number of spikelets per cm of panicle than CTDS and NTDS owing to excessive tillering leading to small panicle size and further reduced grain yield[3,4].Panicle dry weight at MAwas higher under TP than DS under either CTor NTowing to the sink/source relationship.TP had an approximately 12% longer and larger sink(heavier panicle)than DS.Increasing spikelet number per panicle may be a better approach to increase sink size[17,18]and sink size(spikelet number per unit land area)is the primary determinant of the rice yield[19]. Grain yield was higher in CTTP owing to a larger sink size (heavier panicle,more spikelets in per cm length of panicle) than under DS although weather parameters(temperature, sunshine hours and rainfall)were similar both in TP and in DS (Table 2).

Fig.7–Leaf area(cm2)per tiller,bar represents SE.
5.Conclusions
There was a positive correlation between panicle number and maximum tillers and NTTP always produced lower numbers of tillers than CTTP.However,PBTR was higher in NTTP than in CTTP,and both NTTP and CTTP had similar sinks(number of spikelet per cm of panicle).Increasing maximum tiller number in NTTP by increasing plant populations may increase rice yield.
Acknowledgments
This study was a part of the PhD dissertation research of the first author.The author greatly appreciates financial support provided by the National Natural Science Foundation of China project,No.311712494.The author also appreciates the financialsupport provided by NATP,BARC,Dhaka,Bangladesh.
R E F E R E N C E S
[1]K.A.K.Moldenhauer,J.H.Gibbons,Rice morphology and development,in:C.W.Smith,R.H.Dilday(Eds.),Rice:Origin, History,Technology,and Production,John Wiley&Sons,Inc., New Jersey,2003,pp.103–128.
[2]F.Wang,F.M.Cheng,G.P.Zhang,Difference in grain yield and quality among tillers in rice genotypes differing in tillering capacity,Rice Sci.14(2007)135–140.
[3]S.Peng,G.S.Khush,K.G.Cassman,Evolution of the new plant ideotype for increased yield potential,in:K.G.Cassman (Ed.),Breaking the Yield Barrier,International Rice Research Institute,Philippines,1994,pp.5–20.
[4]S.A.Ahmad,H.Husain,H.Ali,A.Ahmad,Transplanted fine rice(Oryza sativa L.)productivity as affected by plant density and irrigation regimes,Int.J.Agric.Biol.7(2005)445–447.
[5]E.A.Dun,B.J.Ferguson,C.A.Beveridge,Apicaldominance and shoot branching.Divergent opinions or divergent mechanisms,Plant Physiol.142(2006)812–819.
[6]S.Yoshida,Effects of temperature on growth of the rice plant (Oryza sativa L.)in a controlled environment,Soil Sci.Plant Nutr.19(1973)299–310.
[7]M.Huang,Y.B.Zou,Y.H.Feng,Z.W.Cheng,Y.Mo,M.Ibrahim, B.Xia,P.Jiang,No-tillage and direct seeding for super hybrid rice production in rice–oilseed rape cropping system,Eur.J. Agron.34(2011)278–286.
[8]H.X.Li,W.S.Lu,Y.J.Liu,X.M.Zhang,X.C.Cheng,Y.F.Li,J.T. Hou,Effect of different tillage methods on rice growth and soil ecology,Chin.J.Appl.Ecol.12(2001)553–556(in Chinese with English abstract).
[9]D.Ardell,A.L.Halvoson,J.M.Black,S.D.Krupingley,B.J. Merril,D.Wienhold,L.Tonaka,Spring wheat response to tillage system and nitrogen fertilization within a crop fallow system,Agron.J.92(2000)151.
[10]M.A.Ali,Productivity and resource-use efficiency ofrice as affected by crop establishment and nitrogen management,PhD Dissertation University of Philippines,Los Baños.Philippines, 2005.182.
[11]M.A.Badshah,Y.B.Zou,N.M.Tu,Growth and physiological responses of super hybrid rice Liangyoupeijiu to tillage and crop establishment methods,Res.Crops 14(2013)609–620.
[12]P.Monneveux,C.Sanchez,A.Tiessen,Future progress in drought tolerance in maize needs new secondary traits and cross combinations,J.Agric.Sci.146(2008)287–300.
[13]A.D.Baylis,J.W.Dicks,Investigations into the use of plant growth regulations in oil-seed sunflower(Helianthus annuus L.)husband,J.Agric.Sci.(Camb.)100(1983) 723–730.
[14]W.Yang,S.Peng,R.C.Laza,R.M.Visperas,M.L.Dionisio-Sese, Yield gap analysis between dry and wet season rice crop grown under high-yielding managementconditions,Agron.J. 100(2008)1390–1395.
[15]M.N.H.Miah,T.Yoshida,Y.Yamamoto,Y.Nitta,Characteristics of dry matter production and partitioning of dry matter in high yielding semi-dwarf indica and japonica–indica hybrid rice varieties,Jpn J.Crop.Sci.65(1996)672–685.
[16]R.C.Laza,S.Peng,S.Akita,H.Saka,Contribution of biomass partitioning and translocation of grain yield under sub-optimum growing conditions in irrigated rice,Plant Prod. Sci.6(2003)28–35.
[17]J.Ying,S.Peng,Q.He,H.Yang,C.Yang,R.M.Visperas,K.G. Cassman,Comparison of high-yield rice in tropical and sub-tropical environments.I.Determinants of grain and dry matter yields,Field Crops Res.57(1998)71–84.
[18]Y.Zhang,Q.Tang,Y.Zou,D.Li,J.Qin,S.Yang,L.Chen,B.Xia, S.Peng,Yield potentialand radiation use efficiency of“super”hybrid rice grown under sub-tropicalconditions,Field Crops Res.114(2009)91–98.
[19]M.J.Kropff,K.G.Cassman,S.Peng,R.B.Matthews,T.L.Setter, Quantitative understanding of yield potential,in:K.G. Cassman(Ed.),Breaking the Yield Barrier,International Rice Research Institute,Los Baños,1994,pp.21–38.
*Corresponding author.
E-mailaddress:tnm505@163.com(T.Naimei).
Peer review under responsibility of Crop Science Society of China and Institute of Crop Science,CAAS.
Production and hosting by Elsevier
2214-5141/$–see front matter©2013 Production and hosting by Elsevier B.V.on behalf of Crop Science Society of China and Institute of Crop Science,CAAS.
http://dx.doi.org/10.1016/j.cj.2013.11.004
杂志排行
The Crop Journal的其它文章
- Induction of avirulence by AVR-Pita1 in virulent U.S. field isolates of Magnaporthe oryzae,
- Molecular characterization ofα-gliadin genes from common wheatcultivar Zhengmai004 and their role in quality and celiac disease
- Three photosynthetic patterns characterized by cluster analysis of gas exchange data in two rice populations
- Near-infrared spectroscopy(NIRS)evaluation and regionalanalysis of Chinese faba bean(Vicia faba L.)
- Integration of QTL detection and marker assisted selection for improving resistance to Fusarium head blight and important agronomic traits in wheat
- BRIEF GUIDE FOR AUTHORS
