Near-infrared spectroscopy(NIRS)evaluation and regionalanalysis of Chinese faba bean(Vicia faba L.)
2014-02-27*
*
Institute of Crop Science,Chinese Academy of Agricultural Sciences,Beijing 100081,China
Near-infrared spectroscopy(NIRS)evaluation and regionalanalysis of Chinese faba bean(Vicia faba L.)
Jiaojiao Wang1,Hao Liu1,Guixing Ren*
Institute of Crop Science,Chinese Academy of Agricultural Sciences,Beijing 100081,China
A R T I C L E I N F O
Article history:
Received 8 May 2013
Received in revised form
25 September 2013
Accepted 12 October 2013
Available online 23 October 2013
Vicia faba L.
NIRS
Two-step cluster analysis
Seed quality
Germplasm source
To analyze the nutritional composition of faba bean(Vicia faba L.)seed,estimation models were developed for protein,starch,oil,and totalpolyphenol using near infrared spectroscopy (NIRS).Two hundred and forty-four samples fromtwelve producing regions were measured in both milled powder and intact seed forms.Partial least squares(PLS)regression was applied for model development.The model based on ground seed powder was generally superior to that based on the intact seed.The optimalseed powder-based models for protein,starch,and total polyphenol had coefficients of correlation(r2)of 0.97,0.93 and 0.89,respectively.The relationship between nutrient contents and twelve producing areas was determined by two-step cluster analysis.Three distinct groupings were obtained with region-constituent features,i.e.,Group 1 ofhigh oil,Group 2 ofhigh protein,and Group 3 ofhigh starch as wellas total polyphenol.The clustering accuracy was 79.5%.Moreover,the nutrition contents were affected by seeding date,longitude,latitude,and altitude of plant location.Cluster analysis revealed that the differences in the seed were strongly influenced by geographicalfactors.
©2013 Crop Science Society of China and Institute of Crop Science,CAAS.Production and hosting by Elsevier B.V.All rights reserved.
1.Introduction
Faba bean(Vicia faba L.)is a popular edible legume worldwide, which is probably native to the Mediterranean region or southwestern Asia[1].The globalacreage offaba bean is about 2.50 million ha[2].Faba bean is a good global source for improving the nutritional and textural quality of food[3–8], and some constituents of seed,such as protein,starch,and oil,are the most important nutritional factors for healthy consumption.The concentrations of these constituents are important indicators of seed quality in the investigation of the genetic resources in faba bean.Polyphenols with antioxidation properties have been reported to have beneficial effects for human and animal nutrition[9,10,11]but they can affect the digestibility of protein and starch[12].Numerous constituents in faba bean require thorough study before their utilizationin industrial processing and daily diet,based on quick and reliable analysis.
Near infrared(NIR)spectroscopy provides a rapid,low-cost and accurate method for chemical analysis,which requires simple sample preparation.The analysis spectrum in a wavenumber region(frequency region)of 4000–12,500 cm-1(800–2500 nm)contains abundant relevant information on organic molecules.NIR analysis has been applied widely in food processing,agriculture,petrochemical and environmental fields[13,14].International Standards Committees have accepted NIR as a formal analysis method for quantifying many compounds.Quick measurements of NIR in leguminous crop have been applied for raising crop quality and detecting adulteration in bean products[15,16].However,the use of NIR technology has not been reported in the evaluation of constituents(protein,starch,oil and total polyphenol)in faba bean genotypes for the improvement research of germplasm resources.
Crop cultivation involves the interaction of varieties and growing conditions.Many important agronomic traits and quality characteristics are strongly influenced by local conditions including sunlight,temperature,water,and soil. Two-step clustering analysis provides an important method to reveal natural potential features in data sets of available information in many scientific fields and can influence industry policy[17],medical treatment and public health[18]. However,this approach has not been used in crop germplasm research.
In this study,a collection of faba bean genotypes from different producing areas were used to investigate the feasibility using NIR methods to examine their protein,starch,oil and total polyphenol content in two treatments(intact seeds and ground samples).Furthermore,two-step cluster analysis was used to explore interrelation of the constituents in faba bean varieties and their areas of production.Finally,the correlations among seeding time,longitude,latitude and altitude of the producing areas with those constituents were also studied.
2.Materials and methods
A total of 244 faba bean samples originating from 12 producing regions in China(Shanxi,Hebei,Qinghai,Sichuan,Gansu, Jiangsu,Anhui,Yunnan,Guangxi,Xizang,Ningxia and Inner Mongolia)and collected from 1980 to 2010 were obtained from the Chinese National Genebank(Beijing,China).These samples were acclimated at ambient temperature(20°C)for two days prior to being divided into two samples.One sample was ground by a centrifugalmill(Type 17-140 Glen Creston Ltd,London,UK) and sieved through a 250μm screen before the NIR spectroscopy and chemical analysis,and the other sample was directly used to collect NIR spectroscopy information from intact seed beans.
Protein,starch,oiland totalpolyphenolcontent of the faba bean powder samples were determined using Chinese National Standard Methods(GB).The protein,starch,and oil contents,which were expressed in gram per 100 g of dry weight(%),were determined using the Kjeldahl method (GB2905-1982),Spectropolarimeter method(GB5006-1985),and Soxhlet method(GB2906-1982)respectively.For determining total polyphenol content,a modified Folin–Ciocalteu method was used[19]and the results were expressed as gallic acid (Sigma-Aldrich,St.Louis,USA)equivalents(GAE),in milligrams per 1 g of dry weight.Allthe determinations were performed in duplicate and the results were expressed as the mean± standard deviation.
NIR spectroscopy was obtained by Matrix-I FT-NIR spectrometer(Bruker Optics,Ettlingen,German)equipped with an integrating sphere in the sampling area.OPUS spectroscopy software(v.6.5 Bruker Optics,Ettlingen,Germany)was used for instrumentalcontroland spectral acquisition.Sample was poured into 50 mm rotating cup on holder and scanned over the spectra range 4000–12,500 cm-1(800–2500 nm)at 1 nm interval.The spectrum of each sample was the average of 64 scans with the resolution ratio of 16 cm-1.Allacquisitions of the sample spectrumwere performed in triplicate.Prior to modeling, the original data were smoothed using the Savitzky–Golay(9 points)algorithm to avoid noise enhancement[20].To optimize the models,the available data preprocessing methods were performed on the data using mathematical transformation method such as vector normalization,multiplicative scattering correction,the first derivative+vector normalization and the first derivative+multiplicative scattering correction.Limiting wavenumber region was used to decrease the spectralnoise[13]. Partial least squares(PLS)algorithm was used to obtain the fundamentalrelation between the spectraldata andcorresponding chemical values.The reliability of prediction model was tested by leave-one-sample-out cross validation and external validation.All models were originally based on a calibration set (203 samples)and a validation set(41 samples).Therefore,the choice of the calibration and validation sets ensured a large representative range and a good uniformity of gradient distribution.Various statistics,such as the coefficient of correlation(r2), the coefficient of determination(R2),the root mean square error (RMSE)and residual predictive deviation(RPD),were computed by OPUS 6.5 to judge the quality of models.The coefficient of determination(R2)indicates the percentage of variance present in the chemicalvalues,which was reproduced in the prediction. The root mean square error in cross-validation(RMSECV)gives an average of the uncertainty that can be expected for the predicted values.The rootmean square errorofprediction in test set validation(RMSEP)was also computed.The residual prediction deviation(RPD),defined as the ratio between the standard deviation of the values and the standard error of performance, indicated the predictive capacity.The prediction accuracy of models was regarded as excellent or good when RPD was above 2.5.The models could be applied for a rough prediction when RPD ranged from 2.0 to 2.5.Reliable PLS modelshould have high value of r2,R2and RPD and low value of RMSECV[20,21].For preventing PLS modelfrom over-fitting,the max rank value was determinate at ten.
Two-step clustering analysis was performed by SPSS(Version 13.0 for Windows,SPSS Inc.,USA).After omitting several samples that lacked clear information about producing area, 195 samples from 12 producing areas(P1–P12)were eventually included in the two-step clustering analysis.Concentrations of major constituents as well as continuous variables and producing areas as categorical variables,two-step clustering analysis was run with the log-likelihood distance measure.Theoptimal number of clusters of producing areas was offered through Schwarz's Bayesian Criterion(BIC).The clustering rationality was assessed by discriminant analysis[22].

Table 1–Contents of the principal constituents in faba bean determined by chemical methods.
Information on seeding date was provided by Institute of Crop Science,Chinese Academy of Agricultural Sciences(ICS, CAAS).The geographic coordinates(latitude,longitude and elevation)of the production regions were obtained from the Jinnong Web site(http://www.agri.com.cn/host/province/china. htm).The latitude and longitude values were converted into a decimal system as followed formula(Eq.1):Decimal degrees= Degrees+minutes/60.The data was analyzed using Pearson coefficient with t-test of significance and mean were compared by independent-samples t-test.Kolmogorov–Smirnov method was applied for normality test.Chi-square test was used to determine the significance of the categorical variable in clustering analysis.
3.Results
3.1. Statisticaldescription and correlation analysis
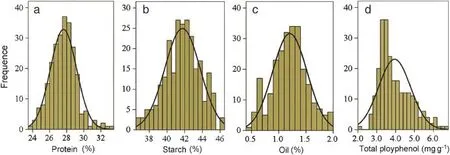
Table 1 shows the range,mean,and standard deviation of the concentrations of the different components in the sample set and Fig.1 shows their distribution.Starch,oil and protein content fit a normal distribution(P>0.05)while total polyphenol did not agreed(P<0.01).
Except for the relationship between protein and oil,the correlation among the contents of majority of the constituents in faba bean was significant(P<0.01,Table 2).Protein content was negatively correlated with starch content and total polyphenol content(P<0.01).Starch content was negatively correlated with oil content(P<0.01)and total polyphenol (positive,P<0.01).Oil content had a negative correlation with total polyphenol content(P<0.01).According to the results of chemical analysis,some faba bean varieties had higher values of protein,starch,oil as well as lower content of total polyphenol e.g.91–825 from Yunnan,H0005043 from Qinghai, and H0004355 from Anhui.H0004355 from Anhuicontained the minimum content of total polyphenol.As a source of antioxidant material,H0005011 from Qinghaiwas considered the best choice because it had the highest content value of total polyphenol.
3.2. NIRS models
NIR spectral patterns of the samples were similar across the whole NIR wavelength region 12,500–4000 cm-1(800–2500 nm) (Fig.2)along the X-axis.While along the Y-axis,the changes of spectral intensities among different samples were clear.PLS regression models of the NIR data were built up on original calibration and validation sets at ratios of 4:1 to 5:1.The outliers were omittedfromcalibration setandeventually the sample size of calibration and validation was set at a ratio of 4:1.The mean values of contents in calibration set and validation set were approximately equal with similar ranges in variation(Table 3).

Fig.1–Distribution of protein(a),starch(b),oil(c)and total polyphenol(d)contents in faba bean.

Table 2–Correlation coefficients of contents of principal constituents in faba bean.
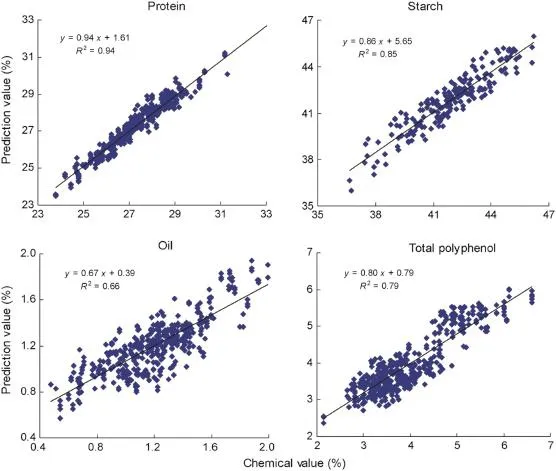
The PLS regression statistics of cross-validation and test set validation are shown in Table 4.The model for the ground powder protein had the highest coefficient of correlation(r2= 0.97)followed by starch(r2=0.93).The protein model also had the highest RPD of 4.09 in the cross validation and 4.05 in the external validation,which indicated extremely on good prediction.The starch model of the milled powder,with a coefficientofcorrelation of0.93 and RPDs of2.64 and 2.95 in cross validation and externalvalidation,demonstrated a good predictive capacity.The RPDs over 2.00 and below 2.50 showed that the predictive capability for total polyphenol in the milled powder and for protein and starch in whole seeds could be used for rough estimation of their content.The oil NIR models could not be used for practicalgermplasm analysis.The optimalmodelfor ground powder with lower values of rank was better than for seeds(Table 4).Figs.3 and 4 represent the optimized regression lines of PLS models in the cross validation of the constituents.
3.3. Cluster analysis
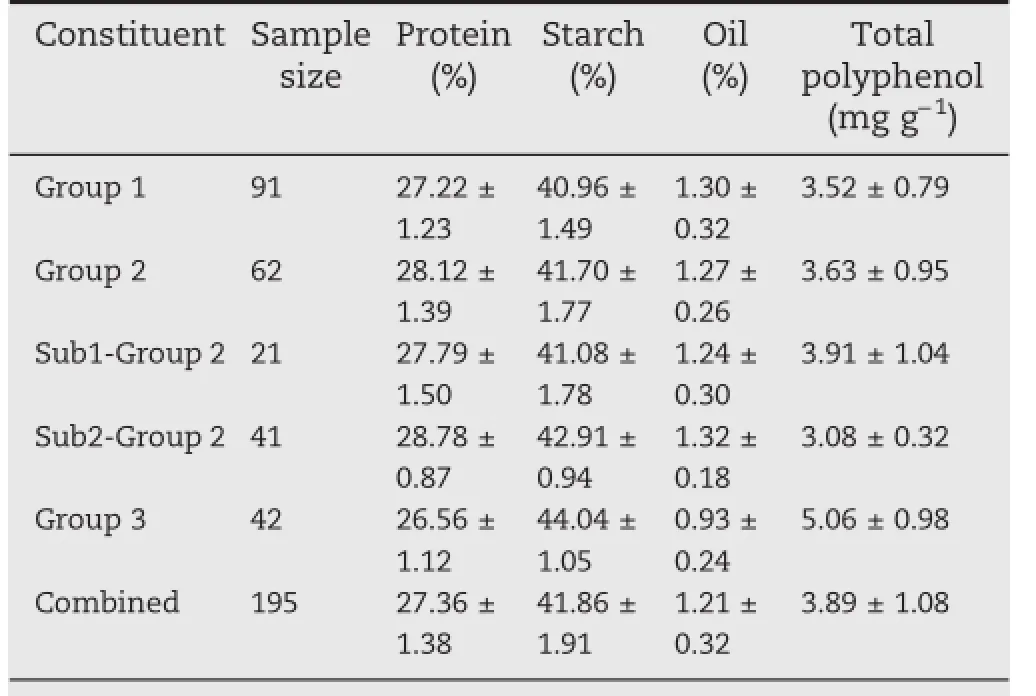
As determined by automatic selection which was based on the values of BIC(Bayesian Information Criterions)across different clustering solutions,the optimized number of clustering was three.The clustering features covered constructors(sample number and producing area)and seed composition characteristics.The three groupings consisted of 91 samples in Group 1 (46.7%),62 samples in Group 2(31.8%)as well as other 42 samples in Group 3(21.5%,Table 5).

Fig.2–Typical NIR spectra obtained from 244 faba beans in powder samples and intact seeds.
Group 1 was characterized by low content of starch (40.96±1.49%)and total polyphenol(3.52±0.79 mg g-1)with a high content of oil(1.30±0.32%).Group 2 had high content of protein(28.12±1.39%).Group 3 was in low content of protein(26.56±1.12%)and oil(0.93±0.24%)but was high in starch (44.04±1.05%)and total polyphenol(5.06±0.98 mg g-1).These results showed the typical features of groupings clustered by a two-step cluster analysis.Canonical discriminant analysis demonstrated that the concentration of protein(Wilk's Lambda=0.825,F=20.302,P=0.000),starch(Wilk's Lambda=0.615, F=60.129,P=0.000),oil(Wilk's Lambda=0.785,F=26.232,P= 0.000)and total polyphenol(Wilk's Lambda=0.671,F=46.999, P=0.000)were all significantly important in the determination of the three groups.The correction ratio of validation was high (79.5%),which indicated agreement with the results of the calibration set.
The outliers of discrimination included that thirteen varieties in Group 1 were predicted to Group 2 and one to Group 3; eighteen in Group 2 were assigned to Group 1 and five to Group 3;one in Group 3 was placed in Group 2 and two in Group 1. Group 2 was clustered into two subgroups(Table 5).Sub1-Group 2 contained samples fromone place with total21 samples while Sub2-Group 2 covered the other nine producing areas.By canonical discriminant analysis,the content of protein(Wilk's Lambda=0.883,F=7.946,P=0.007),starch(Wilk's Lambda= 0.757,F=19.281,P=0.000),oil(Wilk's Lambda=0.980,F=1.193, P=0.279)and total polyphenol(Wilk's Lambda=0.827,F= 12.583,P=0.001)explained that protein,starch and total polyphenol concentration are important traits in the discrimination of the two subgroups.The cluster yielded 90.3%agreement in identifications.However two varieties in subgroup1 were placed in Subgroup 2;and three varieties in Subgroup 2 were placed in Subgroup 1.If a specific variable exceeds the criticalvalue in the Student's t test(dashed verticalline,P=0.05) then that variance contributed to the formation of a specific grouping(Fig.5).For Group 1,the concentration of starch and total polyphenol contributes more significantly than oil.Only protein had major significant contribution for Group 2.The four constituents allcontributed to the formation of Group 3(Table 5).
3.4. Influence of seeding time and producing areas on constituents
There were 81 samples sown in spring and 114 in winter.The protein content in spring sown crops(27.40±1.41%)and in winter sown(27.34±1.37%)were not significantly different(F= 2.046,P=0.771).The starch content(43.19±1.57%)and total polyphenol(4.25±1.16 mg g-1)in spring sown crops was significantly higher(F=0.020,P=0.000;F=14.109,P=0.000) than that in winter sown(40.91±1.54%,3.62±0.94 mg g-1). The content of oil in winter sown crops(1.28±0.32%)was significantly higher(F=0.625,P=0.00)than that in spring sown (1.10±0.29%).These results demonstrated the basic accordance ofthe constituent features of the three groups with sowing date, i.e.,Group 1 for winter sown,Group 2 for both winter and spring sown,and Group 3 for spring sown.
Table 6 shows the correlations between geographical coordinates of producing areas and the principalconstituents. The coefficients of correlation varied from-0.414 to 0.587 (P<0.01),and indicated that there was a relationship between some of the constituents and some of the geographical coordinates of the production areas.Elevation was significantly correlated(P<0.01)with all of the four constituents and coefficients of correlation were negative for protein and oil,but positive for starch and total polyphenol content. Latitude was positively correlated(P<0.01)with the protein and starch content.Longitude showed low correlation only with the oil content.The results also suggested a certain consistency of the characteristics of contents changes with geographic coordinates in the three groups(e.g.Group 1 withlow elevation,Group 2 with median elevation,and Group 3 with high elevation).

Table 3–Reference values of NIR models for protein,starch,oil and total polyphenol in faba bean.

Table 4–Descriptive statistics of cross-validation and test set validation for protein,starch,oil and totalpolyphenolin faba bean.
4.Discussion
Results of chemicalanalysis of components of faba bean were similar to those of previous publications(protein ranging 22.9%to 38.5%,starch at 42%,oil in the range of 1%–2%,and total polyphenol content within 4.8–5.1 mg g-1)[1,23,24].
The NIR models ofprotein and oilhave been seen in soybean (Glycine max[L.]Merr.)(153 intact beans),soybean in Brazil(100 powder samples),field pea(Pisum arvense L.)and chickpea(Cicer arietinum L.)(165 and 151 in powder and intact seeds)were to improve seed quality in breeding program[25–27].In this study, a total of 244 genotypes of faba bean were evaluated with NIR models to determine content range of the seed constituents which is a far greater number than previous study[28].The model for intact seed of faba bean was less precise than powder modelpossibly due to wide differences in particle size. The seed models could be optimized through principalcomponent analysis(PCA).Several studies indicated that physical characteristics of seed samples,such as particle size,water content and interaction between constituents significantly,influenced near infrared absorption and led to variation in the NIR results[29,30].For field pea and chickpea,the calibration accuracy for the chemical constituents of the ground powder was also generally better than those for the intact seed samples [27,31].

Fig.3–Optimized regression line in cross validation of PLS models for the components of milling powder obtained by FT-NIRs.

Fig.4–Optimized regression line in cross validation of PLS models for the components of intact seeds obtained by FT-NIRs.
Zong et al.[32,33]divided the varieties of faba bean germplasm into spring and winter types according to theirnatural seeding time and discussed their regional distribution. Based on the current research,a two-step cluster analysis determined the relationship between the contents of the seed constituents and regionaldifferences accounted for differences in the seed characteristics of the faba bean samples.The majority of faba bean varieties in the same producing area would be clustered into one group and the minority might be kicked out because of their special genotypes or growing conditions[1].Additionally,the clustering results were in accordance with those of cluster research on faba bean using ISSR(Inter-simple Sequence Repeat)markers reported by Wang et al.[34].

Table 5–Features of three groups and two subgroups of faba bean varieties by two-step cluster analysis.
In current study,influences of longitude,latitude,and elevation were observed on the nutrients content in faba bean.Nevertheless,latitude and elevation had a greater influence on these traits than longitude.Compared with faba bean,the influence of latitude on protein(negative,P<0.01) and oil(positive,P<0.05)in soybean was different[35].In Poland,the highest crude protein yields were obtained on an altitude of 300 m and the lowest at 700 m[36].Over a range of altitudes from 0 to 2256 m in Guatemala,the content of protein,starch,tannin and catechin were not affected[37]. Higher altitude is often associated with lower temperature and higher UV absorbance.The starch content of faba bean plants was significantly increased at lower temperature and higher UV exposure[38].High level of UV irradiation will enhance the damage caused lipid peroxidation.High content of totalphenolic is likely to offer certain protection from this damage;and the mechanism may be related with a role ofproline-linked PPP(Pentose phosphate pathway)in response to UV stress[39,40].Total polyphenolcontent in adzuki bean (Vigna angularis)was positively correlated with elevation[41].


Table 6–Coefficients of correlation between principal constituents and geographic coordinates of faba bean varieties.
5.Conclusions
Near infrared spectroscopy(NIRS)provides a quick and reliable method for estimating the protein,starch,and total polyphenol content in faba bean.Generally,powder samples produced more precise results than intact seed.The models for protein and starch content in the ground powder samples provided reliable prediction capability for evaluating germplasm resources.Two-step clustering analysis can be used for the rapid classification of seed nutrient components in crop research.Three groupings were obtained in faba beans and their features included high oil content of Group 1,the high protein content for Group 2,and high contents of starch and total polyphenol for Group 3.These features demonstrated the influences of sowing date and geographicalcoordinates of production areas on the contents of principal constituents in faba bean.All these results support this new approach for screening of germplasm resources and its application in food or feed manufacture.
Acknowledgments
This study was financed by the Modern Agro-industry Technology Research System(nycyty-018:Guixing Ren),the National Infrastructure of Crop Germplasm Resources and the Sci&Tech Innovation Program of CAAS.The authors appreciated Xuxiao Zong,Jianping Guan and Tao Yang for offering materials as well as Sancai Liu,Yan Liand Fang Liu for technologicaladvice.
R E F E R E N C E S
[1]Y.Ye,L.J.Lang,M.Z.Xia,J.M.Xu,Q.Zhao,Faba Bean in China, China Agriculture Press,Beijing,China,2003.(in Chinese).
[2]J.L.Zhou,H.J.Zhang,The International Trade Situation of Edible Beans,Food Nutr.China 17(2011)45–47(in Chinese with English abstract).
[3]M.A.Giménez,S.R.Drago,D.De Greef,R.J.Gonzalez, M.O.Lobo,N.C.Samman,Rheological functional and nutritional properties of wheat/broad bean(Vicia faba L.) flour blends for pasta formulation,Food Chem.134 (2012)200–206.
[4]J.P.Krause,J.Krfigel,K.D.Schwenke,Properties of interfacial films formed by succinylated legumin from faba beans(Vicia faba L.),Colloids Surf.B:Biointerfaces 8(1997)279–286.
[5]J.P.Krause,R.Wustneck,A.Seifert,K.D.Schwenke, Stress-relaxation behaviour of spread films and coalescence stability of o/w emulsions formed by succinylated legumin from faba beans(Vicia faba L.),Colloids Surf.B:Biointerfaces 10(1998)119–126.
[6]E.Makri,E.Papalamprou,G.Doxastakis,Study of functional properties of seed storage proteins from indigenous European legume crops(lupin,pea and broad bean)in as mixture with polysaccharides,Food Hydrocolloids 19(2005) 583–594.
[7]L.A.Arogundade,M.Tshay,D.Shumey,S.Manazie,Effect of ionic strength and/or pH on extractability and physico-functionalcharacterizationofbroad bean(Vicia faba L.) protein concentrate,Food Hydrocolloids 20(2006)1124–1134.
[8]G.Mortuza,A.Hannan,J.T.C.Tzen,Chemical composition and functional properties of Vicia faba L.from Bangladesh, Bangladesh J.Bot.38(2009)93–97.
[9]G.Prestamo,B.Garcia-Criadoa,B.R.Vazquez-de-Aldanaa,A. de Haro,A.Garcia-Ciudada,Protein content and phenolic compounds in okara(soya residue)from the preparation of the soya drink,Aliment.378(2006)108–112.
[10]B.J.Xu,S.K.C.Chang,Totalphenolic content and antioxidant properties of eclipse black beans(Phaseolus vulgaris L.)as affected by processing methods,J.Food Sci.73(2008) H19–H27.
[11]A.R.Santiago,P.Muniz,S.M.Cavia,G.C.Garcia,G.M.Garcia, L.A.Beatriz,M.J.Coma del Corral,Cancer chemotherapy reduces plasma total polyphenol and total antioxidants capacity in colorectalcancer patients,Mol.Biol.Rep.39(2012) 9355–9360.
[12]R.Alonso,A.Aguirre,F.Marzo,Effects of extrusion and traditional processing methods on antinutrients and in vitro digestibility of protein and starch in faba and kidney beans, Food Chem.68(2000)159–165.
[13]N.Yang,G.X.Ren,Application of near-infrared reflectance spectroscopy to the evaluation of rutin and D-chiro-inositol contents in tartary buckwheat,J.Agric.Food Chem.56(2008) 761–764.
[14]J.M.Montes,F.Technow,B.Bohlinger,K.Becker,Grain quality determination by means of near infrared spectroscopy in Jatropha curcas L,Ind.Crop.Prod.43(2013)301–305.
[15]R.Font,M.del Río-Celestino,A.de Haro-Bailón,The use of near-infrared spectroscopy(NIRS)in the study of seed quality components in plant breeding programs,Ind.Crop.Prod.24 (2006)307–313.
[16]L.Wang,F.S.C.Lee,X.R.Wang,Feasibility study of quantifying and discriminating soybean oiladulteration in camellia oils by attenuated total reflectance MIR and fiber optic diffuse reflectance NIR,Food Chem.95(2006) 529–536.
[17]H.S.Park,D.K.Baik,A study for control of client value using cluster analysis,J.Network Comput.Appl.29(2006)262–276.
[18]M.C.Conry,K.Morgan,P.Curry,The clustering of health behaviours in Ireland and their relationship with mental health,self-rated health and quality of life,BMC Public Health 11(2011)692.
[19]Y.Yao,W.Sang,M.J.Zhou,G.X.Ren,Phenolic composition and antioxidant activities of 11 celery cultivars,J.Food Sci.75 (2010)C9–C13.
[20]J.Duan,Y.Huang,Z.H.Li,B.Zheng,Q.Q.Li,Y.M.Xiong,L.J. Wu,S.G.Min,Determination of 27 chemical constituents in Chinese southwest tobacco by FT-NIR spectroscopy,Ind. Crop.Prod.40(2012)21–26.
[21]M.Bala,M.Singh,Non destructive estimation of total phenol and crude fiber content in intact seeds of rapeseed-mustard using FTNIR,Ind.Crop.Prod.42(2013)357–362.
[22]K.A.Ferreira,M.Kimura,M.J.Teixeira,T.R.Mendoza,J.C.da Nóbrega,S.R.Graziani,T.Y.Takagaki,Impact of cancer-related symptom synergisms on health-related quality of life and performance status,J.Pain Symptom Manage.35(2008)604–616.
[23]S.S.Kadam,S.S.Deshpande,N.D.Jambhale,Seed structure and composition,in:D.K.Salunkhe,S.S.Kadam(Eds.), Handbook of World Food Legumes:Nutritional Chemistry, Processing Technology,and Utilization,vol.I,CRCPress,Boca Raton,1989,pp.23–50.
[24]R.Wolosiak,E.Worobiej,M.Piecyk,B.Druzynska,D.Nowak, P.P.Lewicki,Activities of amine and phenolic antioxidants and their changes in broad beans(Vicia faba)after freezing and steam cooking,Int.J.Food Sci.Technol.45(2010)29–37.
[25]Y.Dong,S.Y.Qu,Nondestructive method for analysis of the soybean quality,Int.J.Food Eng.8(4)(2012).
[26]D.S.Ferreira,J.A.L.Pallone,R.J.Poppi,Fourier transform near-infrared spectroscopy(FT-NIRS)application to estimate Brazilian soybean[Glycine max(L.)Merril]composition,Food Res.Int.51(2013)53–58.
[27]P.C.Flinn,R.G.Black,L.Lyer,J.B.Brouwer,C.Meares, Estimating the food processing characteristics of pulses by near infrared spectroscopy,using ground or whole samples,J. Near Infrared Spectrosc.6(1998)213–220.
[28]Y.L.Yan,Foundation and Application of Near-Infrared Spectroscopy Analysis,China Light Industry Press,Beijing, 2005.(in Chinese).
[29]R.Jukka,R.Eetu,T.Jussi,K.Markku,M.Jukka-Pekka,Y.Jouko, In-line moisture measurement during granulation with a four-wavelength near infrared sensor:an evaluation of particle size and binder effects,Eur.J.Pharm.Biopharm.50 (2000)271–276.
[30]D.Wang,F.E.Dowell,R.E.Lacey,Single wheat kernel size effects on near infrared reflectance spectra and color classification,Cereal Chem.76(1999)34–37.
[31]J.Urban,M.Hybl,The use of NIR method for evaluation of the pea(Pisum sativum L.)quality,Rostlinna Vyroba 45(1999) 41–43.
[32]X.X.Zong,X.J.Liu,J.P.Guan,S.M.Wang,Q.C.Liu,G.P.Jeffrey,R. Robert,Molecular variation among Chinese and globalwinter faba bean germplasm,Theor.Appl.Genet.118(2009)971–978. [33]X.Zong,J.Ren,J.Guan,S.Wang,Q.Liu,J.G.Paull,R.Redde, Molecular variation among Chinese and globalgermplasm in spring faba bean areas,Plant Breed.129(2010)508–513.
[34]H.F.Wang,J.P.Guan,Y.Ma,X.L.Sun,X.X.Zong,Genetic diversity of Chinese faba bean(Vicia faba L.)germplasm revealed by ISSR markers,Acta Agron.Sin.37(2011) 595–602(in Chinese with English abstract).
[35]V.Kumar,A.Rani,S.Solanki,S.M.Hussain,Influence of growing environment on the biochemical composition and physicalcharacteristics of soybean seed,J.Food Compos. Anal.19(2006)188–195.
[36]H.Pizo,D.Bobrecka-Jamro,B.Rzasa,Nutrient contents in horse bean and lupin seeds grown in the foothill areas of southeastern Poland,Zeszyty Naukowe Akademii Rolniczej im Hugona Koataja w Krakowie,Sesja Naukowa,32,1992, pp.267–276,(in Polish with English abstract).
[37]R.Bressani,C.Chon,Effects of altitude above sea levelon the cooking time and nutritionalvalue of common beans,Plant Foods Hum.Nutr.49(1996)53–61.
[38]A.M.Hamada,Alteration in growth and some relevant metabolic processes of broad bean plants during extreme temperatures exposure,Acta Physiol.Plant.23(2001)193–200.
[39]I.A.Hassan,J.M.Basahi,M.W.Kadi,H.M.A.Zeid,Physiological and biochemical impairment in bean plants due to supplementary ultraviolet radiation and water stress: possible protective roles of secondary metabolites,Aust.J. Basic Appl.Sci.6(2012)552–561.
[40]P.Shetty,M.T.Atallah,K.Shetty,Effects of UV treatment on the proline-linked pentose phosphate pathway for phenolics and L-DOPA synthesis in dark germinated Vicia faba,Proc. Biochem.37(2002)1285–1295.
[41]Y.Yao,X.Z.Cheng,S.H.Wang,L.X.Wang,G.X.Ren,Influence of altitudinal variation on the antioxidant and antidiabetic potentialof adzuki bean(Vigna angularis),Int.J.Food Sci. Nutr.63(2012)117–124.
*Corresponding author.Tel.:+86 01 62115596.
E-mail address:renguixing@caas.cn(G.Ren).
1The first two authors contributed equally to this paper.Peer review under responsibility of Crop Science Society of China and Institute of Crop Science.
2214-5141/$–see front matter©2013 Crop Science Society of China and Institute of Crop Science,CAAS.Production and hosting by Elsevier B.V.All rights reserved.
http://dx.doi.org/10.1016/j.cj.2013.10.001
杂志排行
The Crop Journal的其它文章
- Induction of avirulence by AVR-Pita1 in virulent U.S. field isolates of Magnaporthe oryzae,
- Molecular characterization ofα-gliadin genes from common wheatcultivar Zhengmai004 and their role in quality and celiac disease
- Three photosynthetic patterns characterized by cluster analysis of gas exchange data in two rice populations
- Integration of QTL detection and marker assisted selection for improving resistance to Fusarium head blight and important agronomic traits in wheat
- Yield and tillering response of super hybrid rice Liangyoupeijiu to tillage and establishmentmethods
- BRIEF GUIDE FOR AUTHORS
