甲烷部分氧化过程中强制振荡的动力学Monte Carlo模拟
2014-02-18任秀彬周安宁章结兵
任秀彬 周安宁 章结兵
(西安科技大学化学与化工学院,西安710054)
1 Introduction
The oxidation of methane on metal catalysts can result in partial oxidation to syngas(CO and H2),which is mostly used for synthesis of chemical materials,for example methanol.It has been reported that the catalytic oxidation of methane exhibits kinetic oscillations in a variety of catalysts including palladium,nickel,cobalt,and nickel/chromium alloy.1The analysis of oscillatory behavior can present valuable information about the intrinsic mechanisms of catalytic reactions.Besides,it is practical to use oscillations to avoid dangerous oscillatory state of reactors,or bring better catalytic performance in some cases.For instance the utilization of pressure cycling is targeted at changing kinetic oscillations,which results in high conversion rate.2
To interpret this complex dynamics in partial oxidation of methane under Ni catalysts,both experimental studies and simulations have been proposed.With experimental studies,the oscillations over Ni foam,3wire and foil,4,5nickel/chromium alloy,6-9and supported nickel catalyst10have been investigated.With simulations,Slinko11and Lashina12et al.developed continuous mathematical models for describing the oscillatory behavior during methane partial oxidation in isothermal and nonisothermal conditions,respectively.In our previous studies,13-17the oscillations during partial oxidation of methane have been surveyed by Monte Carlo(MC)simulations with 12-and 18-step Langmuir-Hinshelwood(LH)mechanism and the formation and removal of nickel oxide under isothermal and nonisothermal conditions,and the formation mechanism of reaction rate oscillations has also been discussed in detail.In all the studies,it is generally suggested that the oscillations over Ni catalysts originate from the repetitive cycles of oxidation and reduction of the metal surface.
After the fact of mechanism has been clarified,the next goal is to control the kinetics on the purpose of avoiding dangerous oscillatory state or bringing about better catalytic performance and high conversion rate.Practically,a large number of researches have been focused on improving the conversion rate of methane to syngas,such as catalytic oxidation of methane on special catalysts in high pressure or high temperature.18-20In earlier studies,it has also been shown that forced composition cycling of the feed to catalytic reactions can lead to significant dynamic change and rate enhancement for the platinum catalyzed CO+N2O reaction,21and CO+O2reaction.22How does the composition cycling of feed influence the dynamics and conversion during partial oxidation of methane on catalysts?This paper studies the impact of forced composition cycling of the feed on the dynamics and conversion in methane oxidation to CO and H2by using kinetic MC simulations.
2 MC model
The partial oxidation of methane on Ni catalysts follows the Langmuir-Hinshelwood mechanism.Because the formation of CO2and H2O may be ruled out in some circumstances,in the simulation the main products(CO and H2)are only considered.The detailed 12 step elementary reactions have been given and summarized in Table 1.
In the MC model,the catalyst surface is represented by a twodimensional square lattice ofL×Lsites with periodic boundary conditions.CH4adsorption occurs on an empty site while O2adsorption on a pair of nearest-neighbor(nn)empty sites.CH4desorption and nickel oxide formation are treated as first-order processes.The sum of rate constants for O desorption,LH step(reaction between adsorbed C and O),and oxide formation are taken as a normalized constant.Probability(pi)for each reaction stepiis drawn from the ratio of the reaction rate constant(ki)to the sum of above three rate constants.That is,the probabilitypifor each event is,

Table 1 Elementary steps

Especially,thepifor steps 3,4,5,6,10,is considered as being equal to 1 because those steps can proceed completely.Adsorbed CH4,O,and H species are allowed to diffuse to an empty nn site.
A dimensionless parameterpreais used to characterize the relative rates of reaction and diffusion,and the rates of the reaction and diffusion processes are considered to be proportional topreaand 1-prea,respectively.The MC algorithm is shown in the following:
(1)A random numberχ(0<χ<1)is firstly generated.The reaction trial is executed withχ
(2)For a diffusion trial,if the randomly selected site is occupied by adsorbed CH4,O,or H,and a randomly selected nn site is empty,the particle jumps to the selected nn site.
(3)For a reaction trial,a lattice site is randomly selected and a random numberχ1(0<χ1<1)is used to determine a reaction event.
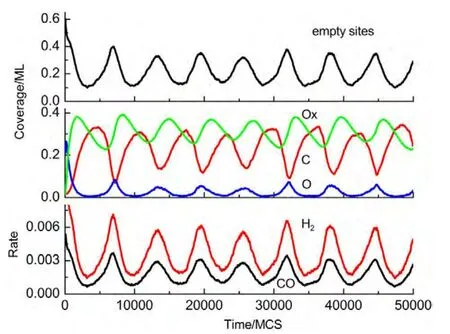
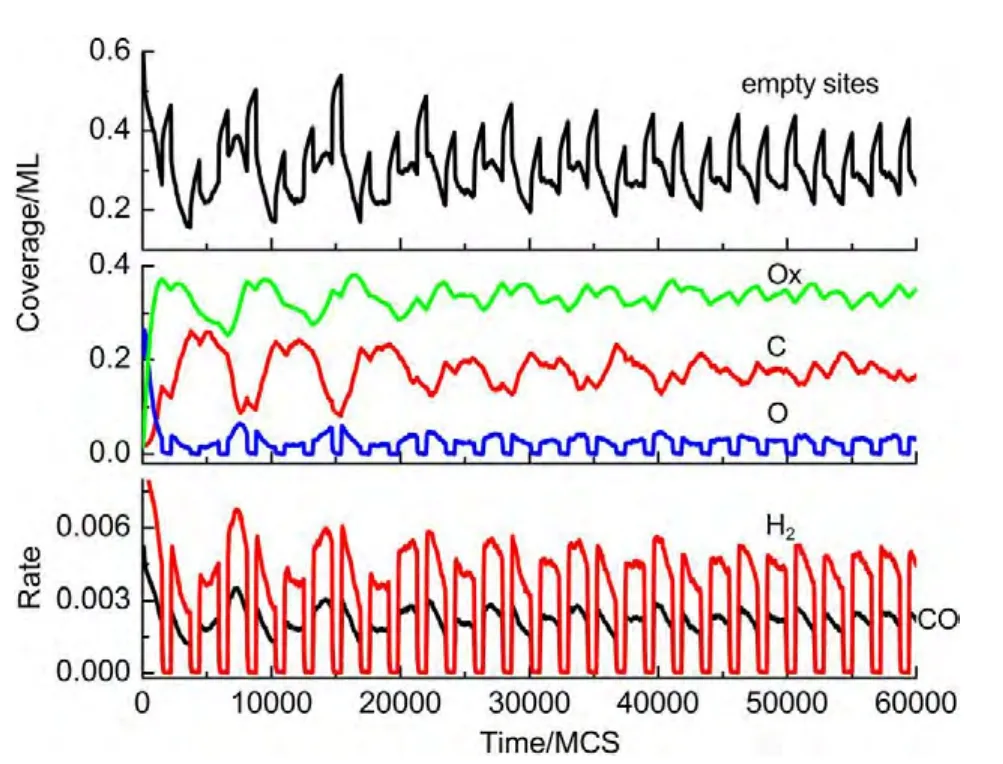
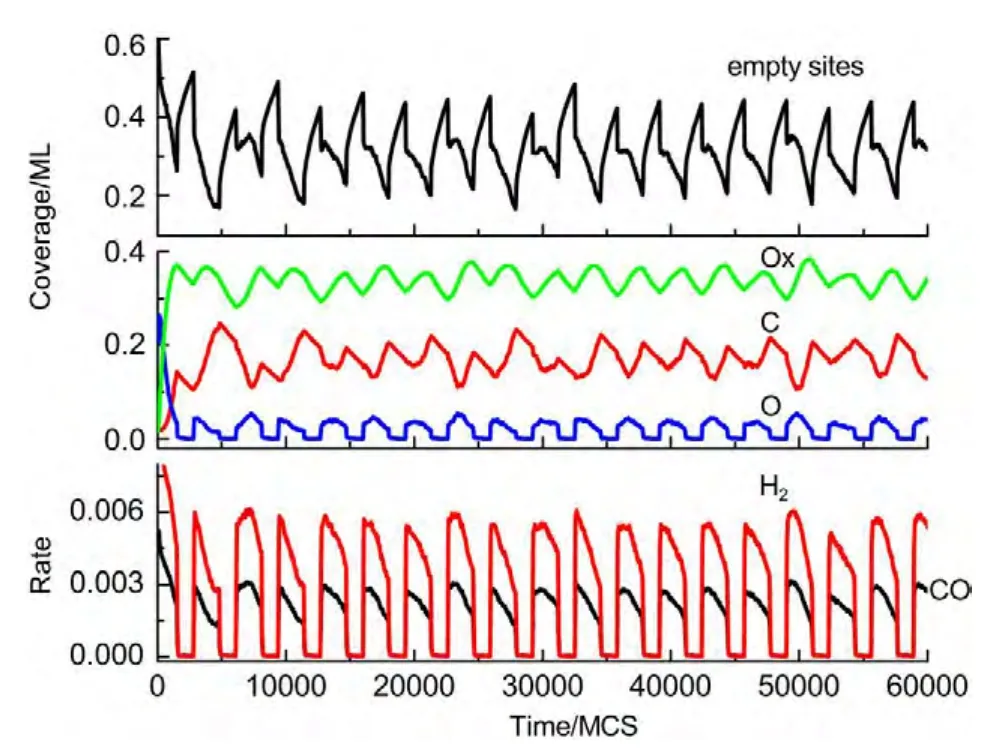
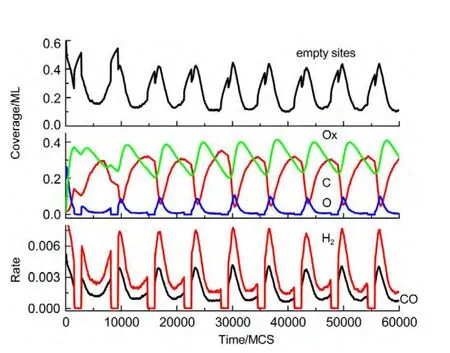
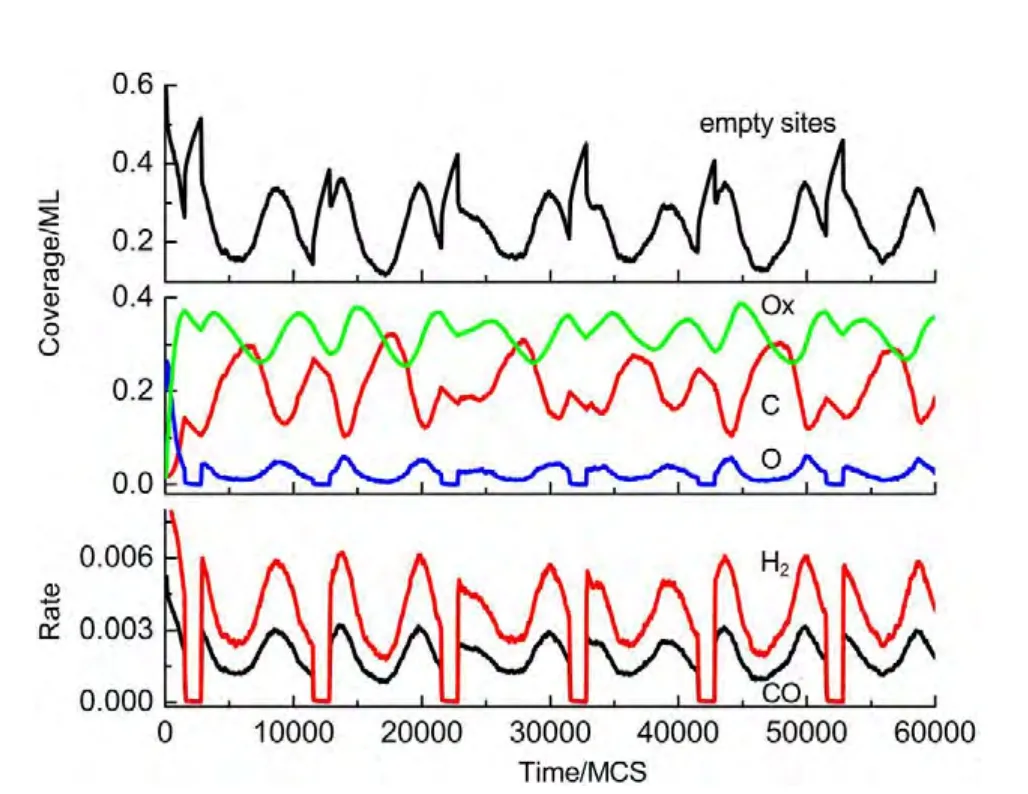
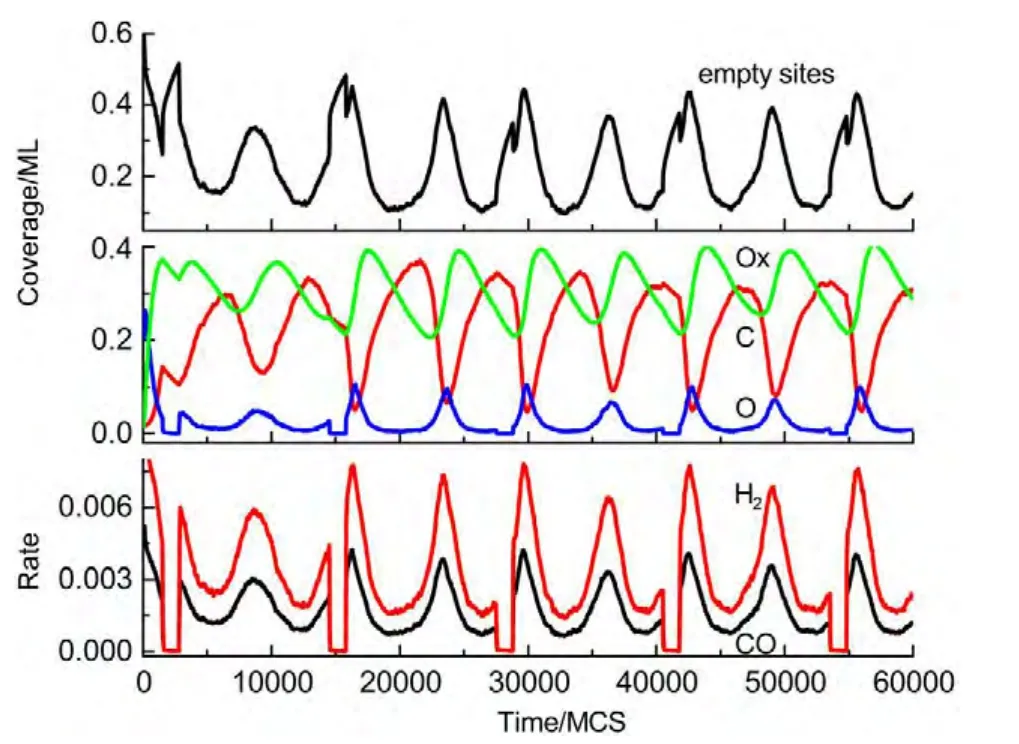
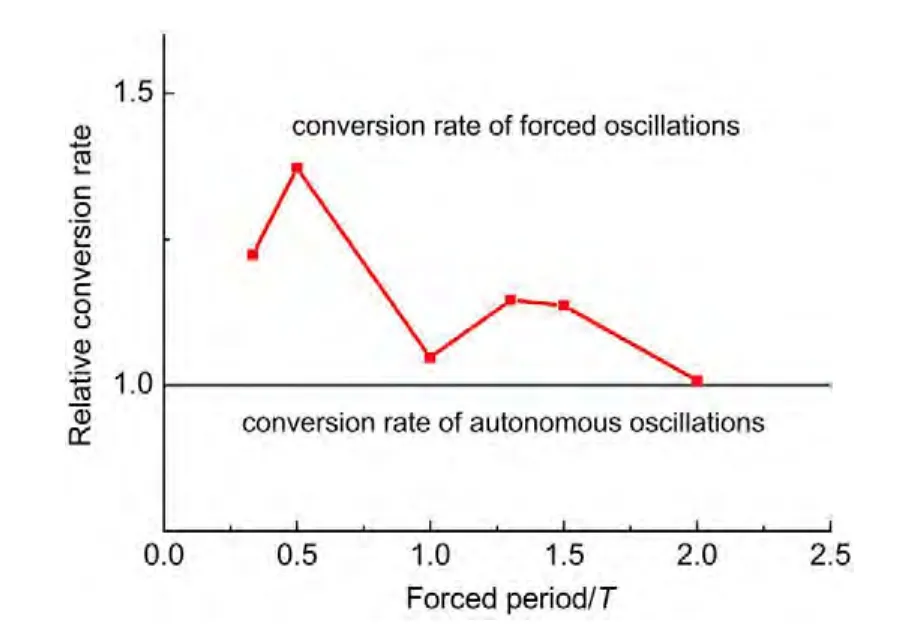
(i)If the selected site is empty,CH4or O2adsorption can occur forχ1 (ii)If the selected site is occupied by adsorbed CH4,CH4desorption or dissociation can occur whenχ1 (iii)If the selected site is occupied by CHx(x=1-3),the trial of CHxdissociation is considered to be successful if the randomly selected nn site is empty. (iv)If the selected site is occupied by C,one of the nn sites is chosen at random.If the nn site is occupied by nickel oxide(Ox),the reaction can occur with the probabilityp12. (v)If the selected site is occupied by O,O2desorption,formation of NiO or reaction with C can occur forχ1 (vi)If the selected site is occupied by H,one of the nn sites is chosen at random.If the nn site is also occupied by H,a gaseous H2molecule is released. (4)CH4and O2adsorption probabilities(p1andp7)have been changed to zero in a fixed period and width periodically. The MC simulation starts from a clean surface,and the MC step(MCS)is employed to represent the reaction time.One MCS is defined asL×Lattempts of the adsorption-reaction events.23,24The reaction rate is determined by the number of produced CO or H2molecules per lattice site in a MCS.The average of produced CO or H2molecules over 50 MCS is used to calculate the reaction rate. It should be mentioned that the simulations are also carried out in the lattice sizes of 100 and 400 to understand the effect of lattice size on the results.The results show that when the lattice size is larger than or equal to 200×200,the oscillatory kinetics has no obvious change.Therefore,all simulations are performed on a square lattice of 200×200 sites.The simulation parameters are executed forprea=0.01,p1=0.009,p2=0.01,p7=0.01,p8=0.001,p11=0.002,andp12=0.001.14 Autonomous oscillations are shown in Fig.1.From the figure,the coverage of empty sites,C,O,Ox and formation rates of CO and H2all exhibit well-developed oscillations.It is found that the transformation of the dominant reaction(from reaction of C and O to the reaction of C and Ox)results in the periodic oscillations of the reaction kinetics,while the oxidation and reduction of nickel surface play an important role in the transformation.13It can also be seen that those self-sustained oscillations have a relatively fixed period.Therefore,the average periodThas been calculated. Composition cycling of feed is used for external forcing of the system.In our previous studies,the reaction rate constant for CH4and O2can be estimated by whereJistands for the impinging constant,Pithe partial pressure,andSithe sticking coefficient.Then,the probabilities for CH4and O2adsorption(p1andp7)are taken by calculating the ratio of the reaction rate constants to normalized constant.Therefore,we can easily see that the parameters ofp1andp7are proportional to the concentration(partial pressure)of CH4and O2,respectively.The paper proposes that composition cycling of feed can be easily achieved by changing the adsorption probabilities ofp1andp7periodically.In the simulation,the forcing width is selected asT/5,whereTis the average period of autonomous oscillations,and the results of forced oscillations for different forcing period(T/3,T/2,T,1.3T,1.5T,and 2T)have been shown from Fig.2 to Fig.7. In order to determine whether the forced oscillations are random,chaotic or periodic,the chaotic attractor is firstly calculated by using time delay method and the correlation dimension algorithm.25,26The one-dimensional time seriesu(tk)(k=0,1,…,M)measured from surface coverage is extended tom-dimensional phase spaceV(tn)(n=0,1,…,N),whereMandNare the number of data points,mis the dimension of phase space.Then the correlation dimensionD(m)can be calculated by correlation integralC(r,m). whereτis the delay time,ris the scaling length,θis the Hevisaide function.The correlation dimensionD(m)is not increased untilmis up tomc,thenD(mc)is the chaotic attractor,wheremcis saturation dimension of phase space.27The calculations are performed utilizing FORTRAN software and the chaotic attractors for forced oscillations are given in Table 2. Fig.1 Autonomous oscillations of coverages of C,O,Ox,empty sites and formation rates of CO and H2 Fig.2 Forced oscillations with the forcing period of T/3 and forcing width of T/5 It is reported that if the chaotic attractorD(mc)is equal to 1,it is periodic oscillation,and if the chaotic attractorD(mc)is equal to 2,it is quasi-periodic oscillation.28WhenD(mc)is greater than 2,and is the fraction,the oscillation is chaotic.FromTable 2 it can be seen that the chaotic attractors of forced oscillations are 1-2,which means that the oscillations with forcing periods ofT/3,T/2,T,and 2Tare periodic oscillations,and the oscillations with forcing periods of 1.3Tand 2Tare quasi-periodic oscillations. In Fig.2,with the forcing period ofT/3,though the chaotic attractor calculation demonstrates it is periodic oscillations,the obtained oscillations are complicated,which is mainly due to system noise.With the forcing period ofT/2(Fig.3),the oscillations show a little complicated state and the period and amplitude have changed.Compared with autonomous oscillations(Fig.1),the period of forced oscillations has reduced by half,which attributes to the transformation of nickel surface between oxidation and reduction.When the reaction begins,the surface is in the reduced state.Then the oxide formation results in the surface changing to oxidized state.Once the breakdown of feed happens,due to the main reaction of C and Ox,the surface again turns to reduced state.It is the period of changing between reduced state and oxidized state that determines the period of forced oscillations.The coverage amplitude of empty sites is slightly increasing while the coverages of C,O,and Ox are reduced by half.This can be interpreted in this way:when the reaction begins there are maximum empty sites on the surface.Methane and oxygen can be easily adsorbed and dissociated,and these processes result in the decrease of empty sites.When the breakdown of feed happens,there is no adsorption of CH4and O2.The increase of C and Ox coverages and decrease of empty sites stop,and C and Ox coverages reach their maximum or minimum respectively.Due to the main reaction of C and Ox,the coverages of C and Ox decrease.Because the reaction rate between C and Ox is very small,the extent of C and Ox decreasing is restricted,which leads to small amplitudes of C and Ox.The consumptions of adsorbed species and oxide could also bring about a larger burst of empty sites. Table 2 Chaotic attractors(D(mc))for different forcing conditions With the forcing period ofT(Fig.4),it is found that the period and amplitude have not changed obviously.Although any particular information has not been acquired from the coverages of C,O,and Ox,it can be seen from the figure that the double-peak oscillations are found in the coverage of empty sites.For the coverage of empty sites,the first peak is originated from external forcing and the second peak from the autonomous oscillations.When the breakdown of feed happens,the empty sites increase and firstly reach their maximum mainly due to the main surface reaction of adsorbed C and Ox.When the reactant concentration resumes,the adsorption of methane and oxygen becomes easier due to the large empty sites,and these processes result in the decrease of empty sites.With the adsorption of methane and oxygen,the quick reaction between adsorbed C and O leads to the empty sites increasing and again reaching its maximum. With the forcing periods of 1.3T(Fig.5)and 1.5T(Fig.6),the period of forced oscillations is decreased remarkably.Besides,double-peak oscillations can be found in the coverages of empty sites,C,O,and Ox.When the forcing period comes to 2T(Fig.7),it can be seen from the coverage of empty sites that in one period the breakout is single-peak,but in the next period the breakout is double-peak. Fig.3 Forced oscillations with the forcing period of T/2 and forcing width of T/5 Fig.4 Forced oscillations with the forcing period of T and forcing width of T/5 The above results show that with composition cycling of feed,not only the oscillatory behavior such as the period and amplitude could be changed,but also some complex dynamics such as double-peak oscillations can be obtained.The changing of oscillatory dynamics is considered to be related with the transition of metal from oxidized to reduced state.When the forcing of feed happens,the oxidized surface changes to partially reduced surface due to the main reaction between C and Ox.When the reactant concentration resumes,the oxide formation changes reduced surface to the partially oxidized surface.If the forcing period is less than that of autonomous oscillations,the recovery of the system after the forcing of feed is not completed up to the time when the new forcing begins,the smaller oscillatory periods and amplitudes are found.If the forcing period is longer than that of autonomous oscillations and the recovery of system is achieved adequately,the complex dynamics such as double-peak oscillations can be found. Fig.5 Forced oscillations with the forcing period of 1.3T and forcing width of T/5 It has been reported that high conversion rate can be obtained in some forcing conditions.We will now concentrate on the conversion rates of forced oscillations.In the simulation,the conversion rate in different forcing conditions has been calculated.The conversion rate is defined as the ratio between CO production and amount of CH4feed.It is assumed that the amount of CH4feed in one MCS is proportional to the probability of CH4adsorption(p1)and the value isC.Then,the relative average conversion rates of forced oscillations(Xforce)and autonomous oscillations(Xauto)can be calculated as follows. Fig.6 Forced oscillations with the forcing period of 1.5T and forcing width of T/5 Fig.7 Forced oscillations with the forcing period of 2T and forcing width of T/5 Fig.8 shows conversion rate as a function of forcing period.From Fig.8 it can be seen that the mean conversion rate of forced oscillations is higher than that of the autonomously oscillating state.When the forcing periods areTand 2T,the average conversion rates drop to almost the same value the autonomous system shows. Effects of forced processes on the conversion rates can be realized by changing the oxidation and reduction state of catalysts.When the surface is oxidized,the operations of composition cycling of feed(with forcing periods of 1.3Tand 1.5T)make the surface be reduced mainly due to the reaction between C and Ox,which results in an obvious increasing of empty sites.On this basis,CH4and O2adsorption become much easier,and much higher conversion rate of CO can be found.When the surface is reduced,the operations of composition cycling of feed(with forcing periods ofTand 2T)result in further reduction of catalysts due to the reaction between C and Ox.Because the reaction rate of C and Ox is small,the increasing of empty sites is limited,and relative lower conversion rate of CO can be found.With the forcing periods ofT/2,both the above effects make the conversion rate reach its maximum. Fig.8 Relative conversion rate as a function of the forcing period The kinetics of external forced oscillations during partial oxidation of methane over Ni surface was simulated by the MC method.Based on 12-step Langmuir-Hinshelwood mechanism and composition cycling of feed,kinetic oscillations in both products and coverage of surface species have been observed.The results indicate that with fixed forcing amplitude ofT/5(Tis the average period of autonomous oscillations)and alterable forcing period fromT/3 to 2T,not only the period and amplitude change obviously,but also the kinetic oscillations show double-peak behavior.The mean conversion rates have also been calculated in both autonomous oscillations and forced oscillations.The results demonstrate that the forced oscillations show an increase in conversion rate.The changes of kinetics and conversion rate could attribute to the surface transition from oxidized to reduced states due to the operation of composition cycling of the feed.The results show that the kinetic oscillations could be effectively controlled by composition cycling of feed. (1)Zhang,X.L.;Lee,C.S.M.;Hayward,D.O.;Mingos,D.M.P.Catal.Today2005,105,283.doi:10.1016/j.cattod.2005.02.040 (2) Svensson,P.;Jaeger,N.I.;Plath,P.J.J.Phys.Chem.1988,92,1882.doi:10.1021/j100318a037 (3) Cimino,S.;Lisi,L.;Mancino,G.;Musiani,M.;Vázquez-Gómez,L.;Verlato,E.Int.J.Hydrog.Energy2012,37,17040.doi:10.1016/j.ijhydene.2012.08.022 (4)Zhang,X.L.;Hayward,D.O.;Mingos,D.M.P.Catal.Lett.2003,86,235.doi:10.1023/A:1022672219909 (5)Zhang,X.L.;Hayward,D.O.;Mingos,D.M.P.Catal.Lett.2002,83,149.doi:10.1023/A:1021069510797 (6)Tulenin,Y.P.;Sinev,M.Y.;Savkin,V.V.;Korchak,V.N.Stud.Surf.Sci.Catal.1997,110,757.doi:10.1016/S0167-2991(97)81038-5 (7)Tulenin,Y.P.;Sinev,M.Y.;Savkin,V.V.;Korchak,V.N.;Yan,Y.B.Kinet.Catal.1999,40,405. (8) Tulenin,Y.P.;Sinev,M.Y.;Savkin,V.V.;Korchak,V.N.Catal.Today2004,91-92,155. (9)Zhang,X.L.;Hayward,D.O.;Mingos,D.M.P.Catal.Lett.2001,72,147. (10) Hu,Y.H.;Ruckenstein,E.Ind.Eng.Chem.Res.1998,37,2333.doi:10.1021/ie980027f (11) Slinko,M.M.;Korchak,V.N.;Peskov,N.V.Appl.Catal.A:Gen.2006,303,258.doi:10.1016/j.apcata.2006.02.010 (12)Lashina,E.A.;Kaichev,V.V.;Chumakova,N.A.;Ustyugov,V.V.;Chumakov,G.A.;Bukhtlyrov,V.I.Kinet.Catal.2012,53,374.doi:10.1134/S0023158412030081 (13) Ren,X.B.;Li,H.Y.;Guo,X.Y.Surf.Sci.2008,602,300.doi:10.1016/j.susc.2007.10.016 (14)Ren,X.B.;Li,H.Y.;Guo,X.Y.Acta Phys.-Chim.Sin.2008,24,197.[任秀彬,李换英,郭向云.物理化学学报,2008,24,197.]doi:10.1016/S1872-1508(08)60009-1 (15) Ren,X.B.;Guo,X.Y.Surf.Rev.Lett.2008,15,769.doi:10.1142/S0218625X0801213X (16) Ren,X.B.;Guo,X.Y.Surf.Sci.2009,603,606.doi:10.1016/j.susc.2008.12.018 (17)Ren,X.B.;Guo,X.Y.J.Nat.Gas Chem.2011,20,503.doi:10.1016/S1003-9953(10)60216-2 (18) Zhao,K.;He,F.;Huang,Z.;Zheng,A.Q.;Li,H.B.;Zhao,Z.L.Chin.J.Catal.2014,35,1196.[赵 坤,何 方,黄 振,郑安庆,李海滨,赵增立.催化学报,2014,35,1196.]doi:10.1016/S1872-2067(14)60084-X (19) Donazzi,A.;Livio,D.;Diehm,C.;Beretta,A.;Groppi,G.;Forzatti,P.Appl.Catal.A:Gen.2014,469,52. (20) Nguyen,T.H.;Łamacz,A.;Beaunier,P.;Czajkowska,S.;DomaDski,M.;KrztoD,A.;Le,T.V.;Djéga-Mariadassou,G.Appl.Catal.B:Environ.2014,152-153,360. (21) Sadhankar,R.R.;Lynch,D.T.J.Catal.1994,149,278.doi:10.1006/jcat.1994.1296 (22)Graham,W.R.C.;Lynch,D.T.AIChE J.1990,36,1796. (23) Sinha,I.;Mukherjee,A.K.Chem.Phys.Lett.2012,553,30.doi:10.1016/j.cplett.2012.09.073 (24) Liu,D.J.;Evans,J.W.Prog.Surf.Sci.2013,88,393.doi:10.1016/j.progsurf.2013.10.001 (25) Packard,N.H.;Crutcheld,J.P.;Farmer,J.D.;Shaw,R.S.Phys.Rev.Lett.1980,45,712.doi:10.1103/PhysRevLett.45.712 (26) Grassberger,P.;Procaccia,I.Phys.Rev.Lett.1983,50,346.doi:10.1103/PhysRevLett.50.346 (27) Kipchatov,A.A.;Krasichkov,L.V.On Reconstruction of ChaoticAttractor from Time Series Represented as"Clusters".InDynamical Systems and Chaos;The Proceedings of the International Conference on Dynamical Systems and Chaos,Tokyo,Japan,May 23-27,1994;pp 1-4. (28)Guo,X.Y.;Zhong,B.;Peng,S.Y.Acta Phys.-Chim.Sin.1995,11,873.[郭向云,钟 炳,彭少逸.物理化学学报,1995,11,873.]doi:10.3866/PKU.WHXB200805243 Results and discussion





4 Conclusions
