Shock tube design for high intensity blast waves for laboratory testing of armor and combat materiel
2014-02-09ElijhCOURTNEYAmyCOURTNEYMichelCOURTNEY
Elijh COURTNEY,Amy COURTNEY*,Michel COURTNEY
aBTG Research,P.O.Box 62541,Colorado Springs,CO 80962,USA
bExponent,Inc.,3440 Market Street,Philadelphia,PA 19104,USA
1.Introduction
The use of improvised explosive devices(IEDs)has greatly increased in recent military conflicts,and as a direct result,more soldiers are also being exposed to explosions[1,2].It has been shown that the blast wave from an explosion can cause injuries apart from projectiles or impacts;these have been called primary blast injuries.The recent increase in injury to personnel and blast-induced damage to materiel has motivated laboratory scale experiments on the effects of blast waves[3-5].Goals of such experiments include the improvement of armor and the treatment of blast-induced injuries.The shock tube is an instrument that is used to simulate a blast wave so that the simulated blast wave can be directed and measured more easily,and so experiments can be conducted in laboratory conditions[5,6].
Shock tubes have been used to study high speed aerodynamics and shock wave characteristics as well as the response of material to blast loading for over a century[7].More recently,the value of using shock tubes to understand and prevent blast-related injuries has been demonstrated.Most shock tube designs are one of two main categories based on how the simulated blast wave is created:compression-driven[8,9]or blast-driven[10,11].However,each of these has some limitations.Design details and dimensions of compression driven shock tubes vary,but the basic principle is that pressure builds in a driving section separated from the longer driven section by a thin barrier.When the barrier ruptures due to overpressure in the driving section or a mechanical perturbation,the overpressure propagates along the driven section.As the overpressure propagates,the gas dynamics cause a shock wave to form at the leading edge,followed by a decay in the pressure profile that somewhat approximates a blast wave.Compression-driven shock tube designs often produce significant shot-to-shot variations in peak pressure,as well as pressure wave durations that are longer than those of realistic threats such as mines,hand grenades,and IEDs.Often,they do not approximate the Friedlander waveform of free field blast waves[12].Furthermore,the expansion of the compressed gases results in a jet of expanding gases that transfers additional momentum to the test object.
Blast-driven shock tubes are often relatively simple tubes closed at one end and open at the other.A given quantity of high explosives is located near the closed end and detonated.The blast wave is directed out of the open end by the tube,producing more realistic blast profiles.The detracting feature of blast-driven shock tubes is that their operation requires expensive facilities,liability,and personnel overhead for storing and using high explosives[12].
Previous work showed that a modular,oxy-acetylene based shock tube produced realistic blast waves with peak pressures up to about 1.17 MPa[12].However,in some situations it may be desirable to increase the peak pressure to as much as 5 MPa to simulate closer proximity to a blast source and assist the development and testing of personal and vehicle armors.Higher blast pressures are also desirable for testing damage thresholds of equipment.A 5 MPa reflected pressure(for the sake of comparison,this paper discusses reflected pressures,that is,pressures determined with the pressure transducer having its flat surface directly facing the blast source)corresponds approximately to a blast produced by a hand grenade(~0.23 kg charge weight)at a standoff distance of 0.4 m or a 155 mm high explosive(~10.8 kg charge weight)at 2 m[10].
The present study experimentally investigated three approaches to increase the peak pressure of the simulated blast wave produced by a laboratory scale oxy-acetylene based shock tube.The first method employs the addition of a Shchelkin spiral priming section which supports a deflagration to detonation transition.The second method uses a bottleneck between the driving and driven sections to increase pressure by increasing the ratio between volume of fuel and crosssectional area of the driven section.The third method adds solid fuel to the driving section with the oxy-acetylene with the goal of increasing the heat and pressure of the blast wave inside the driven section.
2.Materials and methods
In all three designs,a single layer of food-grade plastic film(low density polyethylene)was placed over the open end to contain the mixture before filling the driving section with the fuel-oxygen mixture,and a small ventilation tube was placed parallel to the driving section to allow ambient air to escape during filling.Two layers of Teflon tape were applied to the threads of the driving section before and after placement of the plastic film barrier to prevent the threads from cutting the film prior to ignition.Both driven and driving sections were commercially available steel pipe,and the sections were coupled by a steel flange.For the bottleneck and solid fuel designs,the driving section was sealed with a steel end cap,into which a hole was drilled for ignition access,and the driving section was filled with a stoichiometric mixture of oxygen and acetylene.(This procedure produced 2-6%shotto-shot variations in earlier work[12]and 3-9%variations here.This level of repeatability is sufficient for most applications.)Combustion products of this mixture were carbon dioxide and water vapor.The ignition source,an electric match,was placed in the ignition access,which was then sealed with putty.The driving section was then threaded into the flange and the leads to the ignition source were attached to a remote 9V DC source[12].
2.1.Shchelkin spiral priming section
A Shchelkin spiral was incorporated into a priming section,which was placed behind the driving section(Fig.1A).The Shchelkin spiral is hypothesized to work by increasing the turbulent flow of the deflagration wave,thus increasing the chemical reaction rate and wave speed[13,14].Both the priming and driving sections were filled with oxy-acetylene.For this design,the priming section was a 60.7 cm long and 16 mm inner diameter machined steel tube with the spiral groove machined to a depth of 0.36 mm on the inside of the tube.The driving section was 30.5 cm in length and 79 mm in inner diameter.This design did not employ a driven section.The reaction of the priming compound(0.04 g of lead styphnate)was initiated by impact,thus igniting the oxyacetylene.As the fuel burned along the priming section,a deflagration to detonation transition(DDT)occurred.When the reaction reached the driving section,the energy was amplified by the additional volume of fuel in the driving section.
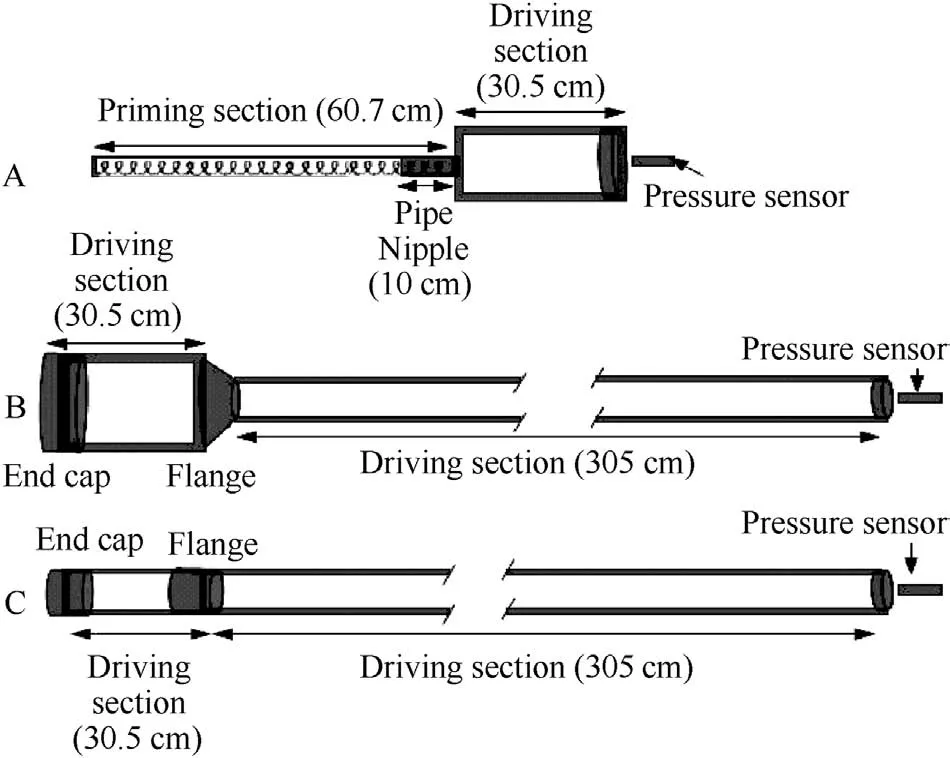
Fig.1.Diagram of oxy-acetylene shock tube designs.A:Shchelkin spiral shock tube,B:Bottleneck shock tube,C:Solid fuel shock tube.
2.2.Bottleneck driving section
A decrease in diameter from the driving section to the driven section,or a bottleneck,increased the ratio of chemical energy to the diameter of the driven section,while keeping other features of an earlier,successful design(Fig.1B).Two specific variations were tested in the present study:a 79 mm inner diameter and 30.5 cm long steel cylinder as the driving section with a 53 mm inner diameter and 304.8 cm long steel cylinder as the driven section;and a 103 mm diameter driving section with driven section of the same diameter.Assuming the proportionality of peak blast pressure to increased fuel volume[15],the pressure was expected to increase by a factor of 2.1 for the 79 mm bottleneck,and a factor of 3.8 for the 103 mm diameter bottleneck.Though the proportionality may not strictly apply,this consideration provided a reasonable estimate for design purposes.
2.3.Addition of solid fuel
An amount of additional solid fuel computed to yield 3 times the available chemical energy of the oxy-acetylene mix was added to the driving section in addition to the oxyacetylene.The powdered solid fuel was ignited by the burning oxy-acetylene to try to increase the peak pressure by increasing the amount of chemical energy available.Calculations showed that 0.8 g of nitrocellulose was needed to triple the available chemical energy.The driving section was 53 mm in inner diameter and 30.5 cm in length,and the driven section was 53 mm in inner diameter and 304.8 cm in length(Fig.1C).
2.4.Instrumentation
For tests of each design,a piezoelectric pressure sensor(PCB Piezotronics 113B24)was placed at the shock tube opening with its face perpendicular to the direction of travel of the blast wave.Pressure data was recorded at a sample rate of 1 MHz via cables which connected the pressure transducer to a signal conditioning unit(PCB 842C)which produced a voltage output,which was digitized with a National Instruments USB-5132 fast analog-to-digital converter and stored in a laptop computer.Digitized voltage vs.time data was converted to pressure vs.time using the calibration certificate provided by the manufacturer of the pressure sensor.
Three trials for each design were recorded,and five trials were recorded for the Shchelkin spiral,for it showed the greatest promise.In addition,a single trial with the pressure sensor at 20,40,and 60 mm from the shock tube opening was recorded for the Shchelkin spiral to measure the magnitude of the simulated blast wave as it traveled from the shock tube opening.Earlier work[12]had shown that peak pressure is nearly constant at distances within one diameter of the shock tube opening in oxy-acetylene based designs,so these additional trials were performed to confirm this expectation in the improved design.
3.Results
Of the designs tested,the priming section with a Shchelkin spiral inside behind the driving section proved to have the biggest peak pressure.This design achieved the design goal,with an average peak pressure of 5333 kPa( 98 kPa)while approximating the steep shock front and near exponential decay of a Friedlander waveform.The bottleneck shock tube with the 103 mm driving section had the second biggest peak pressure,with an average peak pressure of 2642 kPa( 41 kPa).The bottleneck shock tube with the 79 mm driving section had the third largest peak pressure,with an average peak pressure of 2246 kPa( 94 kPa).The addition of solid fuel to the driving section had the smallest peak pressure and produced an average peak pressure of 1696 kPa( 92 kPa).Table 1 shows the average peak pressure,standard deviations,and uncertainties for each of the designs.The uncertainties were calculated as the standard error of the mean.It is of general interest in blast research to know the pressure-time curves generated by each design for comparison with freefield blast waves.The duration of the pressure wave produced by each design varied from about 0.2 ms for the Shchelkin spiral(Fig.2)to about 2 ms for the other designs(Figs.3-5).

Table 1The average peak pressures at the shock tube opening for each design,along with standard deviations and uncertainties.
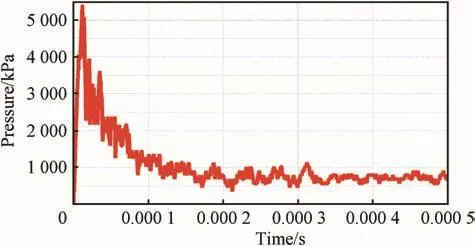
Fig.2.Blast pressure produced by the shock tube with a Shchelkin spiral in the priming section as a function of time.
Fig.2 shows the pressures measured at the shock tube opening by the pressure sensor with its face perpendicular to the direction of travel of the blast wave at a distance of 0 mm.The shape and magnitude of the blast wave were repeatable.The addition of the Shchelkin spiral resulted in a shorter duration blast wave compared to the base design,because the total energy was similar but condensed in a much shorter time span.Table 2 shows that the peak pressure of the wave created by the design with the Shchelkin spiral does not decay rapidly after leaving the tube.However,the shape of the waveform begins to degrade with distance,suggesting that measurements beyond 60 mm may not be useful due to degraded wave shape.

Table 2Peak blast pressures at distances of 0 mm,20 mm,40 mm,and 60 mm from the opening of the Shchelkin spiral shock tube.
Fig.3 shows the pressures measured at 0 mm from the bottleneck shock tube opening.Note that the additional local peaks are near 0.75 ms and 1.7 ms.The local peaks are the reflections of blast wave caused by the bottleneck.The shape and magnitude of the blast wave were approximately the same in each of the trials.The bottleneck was used to increase the area of the driving section relative to the driven section to increase the peak blast pressure.
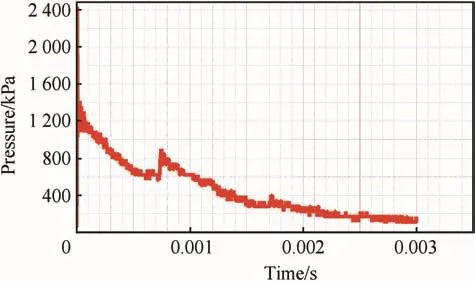
Fig.3.Blast pressure produced by the bottleneck shock tube with a 79 mm inner diameter driving section as a function of time.
Fig.4 shows the pressures measured at 0 mm from the bottleneck shock tube opening.Note that the reflections of the blast wave caused by the bottleneck are near 0.7 ms and 1.55 ms.The reflections in Fig.4 are more pronounced than the reflections in Fig.3,because the difference in area between the driving section and driven section is larger.The shape and magnitude of the blast wave were about the same in each of the trials.The bottleneck was used to increase the area of the driving section relative to the driven section to increase the peak blast pressure.
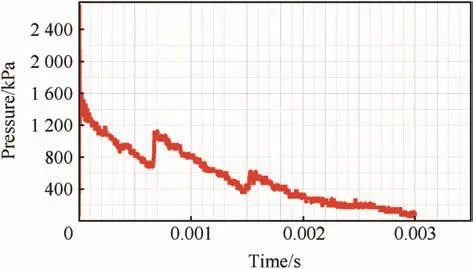
Fig.4.Blast pressure produced by the bottleneck shock tube with a 103 mm inner diameter driving section as a function of time.
Fig.5 shows the pressure measured at the opening of the solid fuel added design(a distance designated as 0 mm).The shape and magnitude of the blast wave were repeatable from trial to trial.The solid fuel was added to increase the available amount of chemical energy for the blast wave.
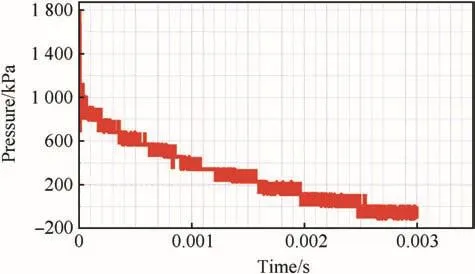
Fig.5.Blast pressure produced by the solid fuel design as a function of time.
4.Discussion and conclusions
4.1.Discussion
The experimental results showed the differences in the ability of the different designs to increase the peak pressure of a blast wave.The designs had a range of peak pressures from 1.7 MPa to 5.3 MPa.The results from each set of experiments were repeatable,with standard deviations ranging from 3 to 9%.Another strength is that the shock tube designs require few or no specialized or expensive parts.A single trial in a blast experiment using high explosives may cost above$10,000.In contrast,the designs described here produce realistic simulated blast waves,and the materials costs are less than$1000 without the added liability,storage,safety,or personnel costs required when using high explosives.
The blast wave for the Shchelkin spiral design,as shown in Fig.2,is a near-Friedlander waveform,with a sudden shock front followed by a near-exponential decay.It is not an exact Friedlander waveform because of the “noise”as the shock front decays and due to the absence of a negative phase.This design may be improved by the addition of a short driven section which may smooth out the noisy waveform.
The blast waves for the bottleneck shock tubes are not Friedlander waveforms because the blast wave reflects off the flange used to decrease the surface area(Fig.1B),which causes secondary peaks in the waveform(Figs.3 and 4).These reflections might be reduced by replacing the relatively short bottleneck with a longer,more gradually tapered transition section to reduce the diameter without providing a reflective surface.This shock tube might have the potential to produce a non-ideal blast wave with multiple fronts(as suggested by Cernak and Noble-Haeusslein),“Most shock and blast tubes used in current experimental models replicate the ideal blast wave from an open-air explosion,without the capability to generate a non-ideal blast wave with multiple shock and expansion fronts as seen in real life conditions”[3].
For the bottleneck and solid fuel designs,the complete and rapid fuel combustion and the proportionality of peak pressure to chemical energy were assumed to lead to the expectation for the peak pressure to increase in direct proportion to the total amount of fuel.However,that was not observed and the peak pressure was less than would be expected based on proportionality to the chemical energy of the fuel.Alternatively,it is known in physics that the energy of a given wave is proportional to the amplitude squared[16,17].Therefore,a more reasonable expectation might be that the wave amplitude(in this experiment,pressure)will be proportional to the square root of the energy available.While the features of shock waves defy simple analysis,the scaling rules are inexpensive,useful tools for estimating expected performance during the design process.
In the 79 mm design,the amount of fuel(and thus the chemical energy)was increased by a factor of 2.22 from the shock tube with a 53 mm inner diameter driving section with an expected increase in peak pressure of a factor of 1.49,assuming the square root scaling.The actual increase in peak pressure was by a factor of 1.87.In the 103 mm design,the amount of fuel was increased by a factor of 3.78 and the expected increase in peak pressure was by a factor of 1.94,assuming a square root scaling.The actual increase in peak pressure was by a factor of 2.20.For both variations of the bottleneck design,the increase in peak pressure is slightly greater than would be expected if the increase in peak pressure was proportional to the square root of the increase in fuel,but is smaller than the increase in peak pressure expected if the increase in peak pressure was proportional to the increase in fuel[15].
The waveform generated by the shock tube with solid fuel added(Fig.5)is an approximate Friedlander waveform.For this design,the available energy was tripled from that of the 53 mm diameter shock tube without solid fuel added[12].The expected increase in peak pressure would be by a factor of 1.73,assuming a square root scaling.The actual peak pressure of the blast wave was only increased by a factor of 1.42.This suggests that not all of the solid fuel was burned quickly enough to contribute to increasing the peak pressure.Combustion dynamics in the driving section have not been studied in detail,but the high-speed video and independent burn rate results of oxy-acetylene mixtures suggest a time of approximately 3 ms for the deflagration in the 30 cm long driving section.Apparently,only a fraction of the additional fuel has burned during the passing of the deflagration wave in the oxy-acetylene mixture.
Future work may include design improvements such as adding a short driven section to the Shchelkin spiral design to reduce noise in the wave shape or replacing the short bottleneck flange with a longer,gradually tapering section to reduce area and increase peak pressure without reflections.It may be possible to further increase the peak simulated blast pressure by increasing the amount of chemical energy in the Shchelkin spiral or bottleneck designs with a longer driving section.The Shchelkin spiral priming section might also be combined with a longer driving section and/or a gradually tapered transition section to increase the peak pressure above 5 MPa.However,combining Shchelkin spiral or bottleneck designs with the addition of solid fuel is not promising as the solid fuel would have to finish combustion within about 0.2 ms.In the current solid fuel design,the solid fuel has not finished combustion even after 3 ms.
Shock tubes currently employed to test vehicle and structural armor[18]utilize high explosives,compressed gases or specialized equipment.Such tests are expensive and may require getting special permission.However,the results of this experiment demonstrate shock tubes which produced blast waves with higher peak pressures to test vehicle and other armors without requiring specialized equipment or high explosives.
A possible limitation of the shock tube is that the initial fuel-oxygen ratio in the driving sections is not precisely measured.However,consistent procedures were followed,and since the peak pressures and pressure-time curves produced were so consistent from shot to shot,that does not seem to be an important limitation.Although the addition of a Shchelkin spiral did increase the peak pressure to meet the design goal,the reasons why it did so are still unclear.It is also a possibility that the priming compound used for ignition may initiate detonation of the fuel-oxygen mixture without the presence of a Shchelkin spiral.A limitation of the bottleneck design is that the bottleneck produces unrealistic reflections which may lower the peak pressure of the initial blast.
4.2.Conclusions
In summary,three methods were investigated to increase peak simulated blast pressure produced by an oxy-acetylene driven shock tube while maintaining suitability for laboratory studies.The first method,the addition of a Shchelkin spiral priming section,increased the average peak pressure from 1.17 MPa to 5.33 MPa.The second method was a bottleneck between the driving and driven sections.Coupling a 79 mm diameter driving section to a 53 mm driven section increased the peak pressure from 1.17 MPa to 2.25 MPa.A 103 mm driving section was used to increase peak pressure to 2.64 MPa.The third method,adding solid fuel to the driving section with the oxy-acetylene,resulted in increasing a peak pressure to 1.70 MPa,and the solid fuel did not completely combust in the available time.Of the new designs tested,the design that incorporated a Shchelkin spiral meets the design goal and maintained a relevant pressure-time curve(near Friedlander waveform).
The authors are grateful to Louisiana Shooters Unlimited for use of their test facilities.This work was funded by BTG Research;affiliated authors participated in all stages of the study with scientific and academic freedom.The authors appreciate feedback from two peer reviewers that was incorporated into improvement of the manuscript.
[1]Wojcik BE,Stein CR,Bagg K,Humphrey RJ,Orosco J.Traumatic brain injury hospitalizations of US army soldiers deployed to Afghanistan and Iraq.Am J Prev Med 2010;38(1):S108-16.
[2]Hoge CW,McGurk D,Thomas JL,Cox AL,Engel CC,Castro CA.Mild traumatic brain injury in US soldiers returning from Iraq.N Engl J Med 2008;358(5):453-63.
[3]Cernak I,Noble-Haeusslein LJ.Traumatic brain injury:an overview of pathobiology with emphasis on military populations.J Cereb Blood Flow Metab 2009;30(2):255-66.
[4]Long JB,Bentley TL,Wessner KA,Cerone C,Sweeney S,Bauman RA.Blast overpressure in rats:recreating a battlefield injury in the laboratory.J Neurotrauma 2009;26(6):827-40.
[5]Courtney EDS,Courtney MW,Courtney AC.Blast wave transmission through transparent armor materials. J Battlef Technol 2012;15(2):19-22.
[6]Reneer DV,Hisel RD,Hoffman JM,Kryscio RJ,Lusk BT,Geddes JW.A multi-mode shock tube for investigation of blast-induced traumatic brain injury.J Neurotrauma 2011;28(1):95-104.
[7]Segars RA,Carboni MG.A shock tube for downselecting material concepts for blast protection part I:description of the shock tube and comparison of flush mounted and recess mounted pressure sensors;2008.Technical Report,Natick/TR-09/010.
[8]Cernak I,Wang Z,Jiang J,Bian X,Savic J.Ultrastructural and functional characteristics of blast injury-induced neurotrauma.J Trauma Inj Infect Crit Care 2001;50(4):695-706.
[9]Henshall BD.On some aspects of the use of shock tubes in aerodynamic research.HM Stationery Office;1957.
[10]Alley M.Explosive blast loading experiments for TBI scenarios:characterization and mitigation.Purdue University;2009.UMI Microform 1470126.
[11]Martin WA.A review of shock tubes and shock tunnels.General Dynamics San Diego,CA,Convair Div,No.GDC-ZR-658-050;2010.
[12]Courtney AC,Andrusiv L,Courtney MW.Oxy-acetylene driven laboratory scale shock tubes for studying blast wave effects.Rev Sci Instrum 2012;83(4):045111-1-045111-7.
[13]New TH,Panicker PK,Lu FK,Tsai HM.Experimental investigations on DDT enhancements by Shchelkin spirals in a PDE.AIAA Paper 552;2006.
[14]Lu FK,Meyers JM,Wilson DR.Experimental study of a pulse detonation rocket with a Shchelkin spiral.In:Proceedings of the 24th International Symposium on shock waves,Beijing,China;July 11-16,2004.pp.825-30.
[15]Taylor G.The formation of a blast wave by a very intense explosion,I:theoretical discussion.Proc Royal Soc Lond Ser Math Phys Sci 1950;201(1065):159-74.
[16]Brode HL.A calculation of the blast wave from a spherical charge of TNT.United States Air Force Research Memorandum;1957.
[17]Pain HJ.The physics of vibrations and waves,vol.43.John Wiley and Sons;2005.
[18]Cullis IG.Blast waves and how they interact with structures.J R Army Med Corps 2001;147(1):16-26.
杂志排行
Defence Technology的其它文章
- Long-rod penetration:the transition zone between rigid and hydrodynamic penetration modes
- Damage visualization and deformation measurement in glass laminates during projectile penetration
- Reduction of global effects on vehicles after IED detonations
- On the continued acceleration of bomb casing fragments following casing fracture
- Numerical simulation of the natural fragmentation of explosively loaded thick walled cylinders
- Study of simple plane wave generator with an air-metal barrier
