Factors affecting headway regularity on bus routes
2013-09-17ZhangManLiWenquan
Zhang Man Li Wenquan
(School of Transportation, Southeast University, Nanjing 210096, China)
U ntil now,the study of headway adherence has been limited,and it has mainly focused on the strategy for improving bus schedule reliability[1-2]or addressing the bus bunching problem[3].However, identifying the factors affecting the regularity of headway is essential to these researches.This paper analyzes some of these factors based on the automatic vehicle location(AVL)data.A bus arrival model is developed to study the effects of scheduled headway,and Matlab is used to simulate the model.
1 Phenomenon of Uneven Headway Analysis
In Fig.1, we show the space-time plot of bus positions,which is obtained by the AVL data in Yichun City of Jiangxi Province,and the data provides arrival times of buses at each bus stop on Route 2.There are sixteen bus stops lying along the route, denoted from 1 to 16, and we can obtain every curve in Fig.1 by connecting each bus's arrival time at each bus stop sequentially and smoothly.The 29 curves in Fig.1 represent 29 buses which depart from the starting station during the day of September 22nd, 2011 from 6:00 to 9:00 in the morning.The vertical distance between adjacent curves represents the headway.

Fig.1 Space-time of bus position based on AVL data
As can be seen from Fig.1, there are two distinctive stages of headway, from 6:00 to 7:00 and 7:00 to 9:00.The headway of the former is more regular than the latter, and bus bunching arises in the latter.Obviously, the second stage occurs during the morning peak hour due to the fact that both the traffic conditions and the passenger demand are unusual.Simulation results[4]show that running time fluctuations and uneven passenger arrivals will lead to headway variations.
There are another two differences between these two stages.First, the departure interval is different, which from 6:00 to 7:00 is 10 min,and from 7:00 to 9:00 is 4 min.Secondly, the departure interval from 7:00 to 9:00 is not so uniform as the former.However, we have not known how these two factors affect the regularity of headway.
Although there are some researches[5-7]about adherence of headway,most of those studies assume that the scheduled headway is even and fixed.Hence, it is necessary to study the effect of departure intervals on headway regularity.
2 Bus Arrival Model
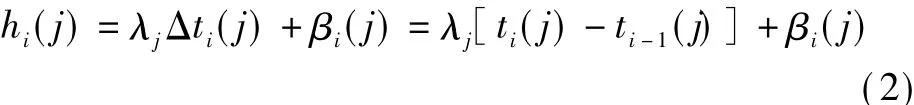
We now consider a fixed-route bus service.Each bus is labeled by a numberirunning from 1 toI.Busi+1 is the one just following behind busi.Each bus stop is la-beled by a numberjrunning from 1 toJ,and the starting one is labeled as 1.Each bus stops at all the bus stops.The arrival time of busiat bus stopjis defined asti(j).We define the headway of busiat bus stopjas follows:

We define the dwell time of busiat bus stopjashi(j), and we assume thathi(j)is linear in Δti(j).The dwell time can be influenced by the time required for crippled or old passengers loading as these activities will result in a longer-than-average dwell time,which can be treated as random disturbances and we use β(j)to denote this variability.We can obtain the equation of the dwell time for busiat bus stopjin terms of headway as follows:
where λjis the dimensionless parameter expressing the marginal increase in bus dwell time arising from unit headway.The random term β(j)is normally distributed,β(j)~N(0,σj2), and it is independent of Δti(j).
We define the travel time of busibetween bus stopjandj-1 as αi(j).We assume that αi(j)is random and normally distributed, αi(j) ~N(μj,δj2).μjis the average travel time between bus stopjandj-1, and δj2is the random noise.The arrival timeti(j)of busiat bus stopjis given by

Combining Eqs.(2)and(3), we obtain the law of bus arrival time as follows:
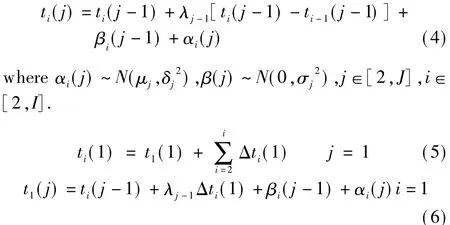
Note that the motion described by Eq.(4)is unstable,because the headway increasingly deviatesfrom the scheduled headway as time passes, until buses bunch up,i.e.,ti(j)=ti-1(j).To solve this instability, we assume that the bus behind cannot pass over the delayed bus,i.e.,ti(j)-ti-1(j)≥0.Ifti(j)-ti-1(j)≺0, thenti(j)=ti-1(j).
3 Simulation and Discussion
We carry out two simulations by Matlab for the bus arrival model described by Eq.(4),J=18.The simulations are all performed with the parameters in Tab.1.The first simulation is executed under the fixed scheduled headway, with no fluctuation, and three departure intervals are simulated.The second simulation is carried out with different fluctuations of scheduled headway within a given range.All the simulations are implemented from 7:30 to 9:30 in the morning.

Tab.1 Values of parameters min
3.1 Simulation with even scheduled headway
When the scheduled headway is even with Δti(1)=H,we can rewrite Eq.(5)as

Figs.2(a)to(c)are obtained, respectively, with even scheduled headways, i.e.,H=6, 5, 4 min.In Fig.2(a),H=6 min, and the headways between successive buses are relatively regular with only a small fluctuation and no bus bunching.However, in Fig.2(b),H=5 min,and most of the headways are still regular but bus bunching arises.In Fig.2(c), bus bunching arises more often than the situation in Fig.2(b), but the fluctuation of the headways is still acceptable.By comparison, under the even scheduled headway,it can be concluded that the regularity of headway is affected by the intervals,and longer intervals result in more regular headway.But the effect is not obvious.
According to TCRP Report 100[8], headway adherence is measured based on the variation coefficient of the headway of transit vehicles serving a particular route arriving at a stop,and it is calculated as follows:wherecvhis the variation coefficient of headway;σdhis the standard deviation of headway deviations;and¯His the mean scheduled headway.
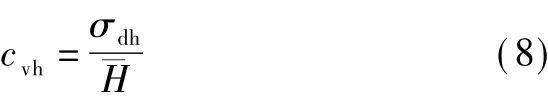
In this simulation,with the even scheduled headway,the mean scheduled headway equals the departure intervalH.Based on Eq.(8), longer intervals result in smaller values ofcvh,which means more regular headway,and this conclusion is in good agreement with the simulation results.
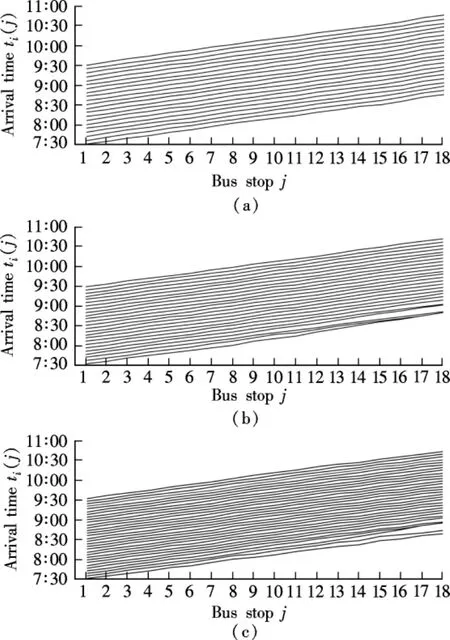
Fig.2 The space-time of bus position with even scheduled headway.(a)H=6 min;(b)H=5 min;(c)H=4 min
3.2 Simulation with uneven scheduled headway
We carry out the simulations under the following initial condition:
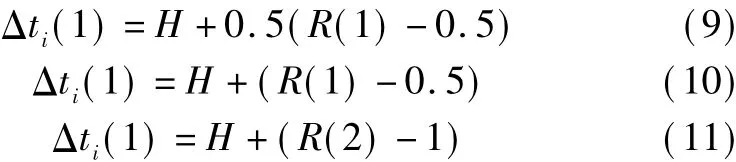
whereR(i)is the random number ranging from 0 toN,and the second term represents the fluctuation of scheduled headway at starting bus stop,H=6 min.
Fig.3 gives the simulation results.Figs.3(a)to(c)are obtained by Eqs.(9)to(11), respectively, with uneven scheduled headways.In these plots, there are apparent headway fluctuations between successive buses.Even in Fig.3(a), where the fluctuation of scheduled headway is only 0.25 min, some bus bunchings arise, and obviously,the headways are not regular as those shown in Fig.2(a).In Fig.3(c), the fluctuation is 1 min, bus bunching happens very frequently,and the headways between buses fluctuate widely.The bus service under this condition is unstable.We can say that uneven scheduled headway will result in irregular headway,and the effect should not be overlooked.
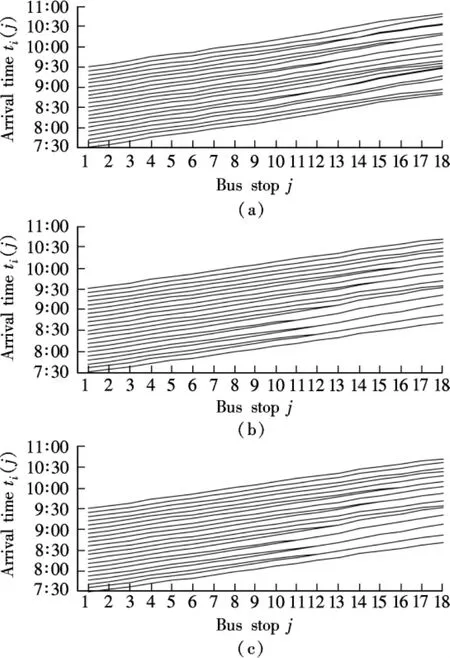
Fig.3 The space-time of bus position with uneven scheduled headway.(a) Δti(1)=H+0.5(R(1)-0.5);(b) Δti(1)=H+(R(1)-0.5);(c) Δti(1)=H+(R(2)-1)
4 Conclusion
Traffic condition,passenger demand and scheduled headway are the key factors affecting headway regularity.It is found that longer intervals and less fluctuation of scheduled headway lead to more regular headway.What's more,the fluctuation affects headway regularity more obviously than the interval.As the scheduled headway is a controllable parameter compared to the traffic condition and passenger demand,controlling the scheduled headway, especially its fluctuation, is an effective strategy to improve the reliability of bus service.
[1]Xuan Yiguang, Argote J, Daganzo C F.Dynamic bus holding strategies for schedule reliability:optimal linear and performance analysis [J].Transportation Research Part B,2011,45(10):1831-1845.
[2]Lin Jie, Wang Peng, Barnum D T.A quality control framework for bus schedule reliability [J].Transportation Research Part E,2008,44(6):1086-1098.
[3]Daganzo C F, Pilachowski J.Reducing bunching with bus-to-bus cooperation [J].Transportation Research Part B,2011,45(1):267-277.
[4]Chen Weiya, Chen Zhiya.Service reliability analysis of high frequency transit using stochastic simulation [J].Journal of Transportation Systems Engineering and Information Technology, 2009, 9(5):130-134.
[5]Daganzo C F.A headway-based approach to eliminate bus bunching:systematic analysis and comparisons [J].Transportation Research Part B, 2009, 43(10):913-921.
[6]Wei Feng, Figliozzi M.Empirical findings of bus bunching and attributes using archived AVL/APC bus data[C]//Proceedings of the11th International Conferenceof Chinese Transportation Professionals.Nanjing, China, 2011:4330-4341.
[7]Nagatani T.Interaction between buses and passengers on a bus route [J].Physica A:Statistical Mechanics and Its Applications, 2001, 296(1/2):320-330.
[8]Transportation Research Board.TCRP Report 100:transit capacity and quality of service manual[EB/OL].(2004-01-27)[2012-04-23].http://trb.org/publications/tcrp/tcrp100/part%202.pdf.
杂志排行

Journal of Southeast University(English Edition)的其它文章
- A personalized trustworthy service selection method
- L1-norm minimization for quaternion signals
- Feature combination via importance-inhibition analysis
- W-band sharp-rejection bandpass filter with notch cavities
- Effects of carbonaceous conductive fillers on electrical and thermal properties of asphalt-matrix conductive composites
- Optimization of RDF link traversal based query execution