Conversion of Fuel-N to N2O and NOxduring Coal Combustion in Combustors of Different Scale*
2013-07-31ZHOUHao周昊HUANGYan黄燕MOGuiyuan莫桂源LIAOZiyu廖子昱andCENKefa岑可法
ZHOU Hao (周昊)**, HUANG Yan (黄燕), MO Guiyuan (莫桂源), LIAO Ziyu (廖子昱) and CEN Kefa (岑可法)
State Key Laboratory of Clean Energy Utilization, Institute for Thermal Power Engineering, Zhejiang University, Hangzhou 310027, China
Conversion of Fuel-N to N2O and NOxduring Coal Combustion in Combustors of Different Scale*
ZHOU Hao (周昊)**, HUANG Yan (黄燕), MO Guiyuan (莫桂源), LIAO Ziyu (廖子昱) and CEN Kefa (岑可法)
State Key Laboratory of Clean Energy Utilization, Institute for Thermal Power Engineering, Zhejiang University, Hangzhou 310027, China
With focus on investigating the effect of combustor scale on the conversion of fuel-N to NOxand N2O, experiments are carried out in three combustors, including single coal particle combustion test rig, laboratory scale circulating fluidized-bed boiler (CFB) and full scale CFB in this work. For single coal particle combustion, the majority of fuel-N (65%-82%) is released as NOx, while only a little (less than 8%) fuel-N yields N2O. But in laboratory scale CFB, the conversion of fuel-N to N2O is increases, but the conversion of fuel-N to NOxis quite less than that of single coal particle combustion. This is because much char in CFB can promote the NOxreduction by increasing N2O formation. In full scale CFB, both of the conversion of fuel-N to NOxand the conversion of fuel-N to N2O are smaller than laboratory scale CFB.
fuel-N, N2O, NOx, coal, fluidized bed
1INTRODUCTION
With the aim of understanding the NOxand N2O formation mechanism and investigating the factors influencing the NOxand N2O formation during coal combustion, many studies have been carried out and reported [1-19]. Due to the greenhouse effect and its destruction to the stratospheric ozone, nitrous oxide (N2O) has caused widely environmental concern. NOx[nitric oxide (NO) and the nitrogen dioxide (NO2)] is harmful gas and results in acid rain.
Fluidized bed combustion technology shows lower SO2and NOxemissions than other combustion systems, and it has been developed rapidly in the past decades. Because of the much lower temperature in the fluidized beds, the NOxemission is much lower than pulverized coal boiler, but the N2O emission increases. In some cases, the N2O concentration is even higher than the NOxconcentration released from some circulating fluidized beds, as reported by Leckner [1].
NOxand N2O control for fluidized bed has caused much attention, and many factors influencing the NOxand N2O emissions have been studied. NOxand N2O formation shows great difference for various coal type, and the fixed carbon content were the most important coal property in the formation of NOxand N2O [14]. Increasing in coal particle size will increase the NOxemission, but the N2O emission decreases [3]. The excess air in fluidized bed combustion can result in an increase in N2O and NOxemissions, but the N2O and NOxemissions can be reduced with the increase of the air staging [1-3, 7]. The reversed air staging shows positive effect on the N2O control [8]. Due to the increasing combustion temperature, reburning produces favorable influence on the N2O removal and destruction [1, 9, 10]. Temperature plays a very important role in the N2O and NOxemissions, the NOxincreases and N2O decreases with the increase in temperature [1-6]. In the pressurized fluidized bed, the increasing operating pressure contributes to decrease in NOxemission, but a maximum value of N2O emission occurs at operating pressure about 0.4 MPa [5]. An effective method to decrease both NOxand N2O emissions is co-combustion of coal and biomass [11]. During the co-combustion of coal and dried sewage sludge, the fixed carbon content of fuel plays an important role in the conversion of fuel-N to N2O [17]. Some catalyst and char show great effect on the N2O reduction and decomposition [9, 11, 12]. Increasing in limestone feed will decrease the N2O emission for most of coal types [2-4]. But the NOxemission will be increased due to the limestone addition [3, 20].
However, in the above studies, much attention is focused on the NOxand N2O formation and the factors influencing N2O and the NOxemissions, and experiments are carried out in a laboratory-scale or a pilotscale [2-4, 7-9, 16] fluidized bed. Actually, the combustion situation and the pollutants emissions in laboratory-scale and pilot-scale fluidized beds are quite different from that of industrial fluidized beds. John et al. carried out experiments to investigate the effect of burner scale on NOxemissions from a swirl pulverized coal burner, and they found that the NOxemission increases with increased burner scale [21]. Sadakata and Hirose presented the scaling law for pollutant emission from a combustion furnace, and found that the flow pattern and the micro- and macro-mixing times should coincide in the scale-up to keep a constant emission level, and residence time has to keep the micro- and macro-mixing times constant [22]. Xiang et al. reported an experimental study on the NOxformation in three full scale boilers and two pilotscale test furnace, suggesting the control of temperature and residence time during coal combustion is important for comparison of NOxformation [23]. Gulyurtlu compared NOxemissions from a pilot scale bubbling fluidized bed and a drop-tube combustor with values measured at power plants, but he found that it is difficult to obtain a general empirical correlation to predict NOxemissions when designing larger units [24].
To the authors’ knowledge, there are few reported studies investigating the conversion of fuel-N to NOxand N2O during coal combustion in different scale combustors, especially in circulating fluidized bed (CFB). In this work, experiments are carried out in three combustors, including single coal particle combustion test rig, laboratory scale CFB and full scale CFB. The NOxand N2O emissions in flue gases are measured, and the conversion of fuel-N to NOxand N2O is calculated. The effect of temperature and the oxygen on the conversion of fuel-N to NOxand N2O is also investigated. NOxand N2O formation and the conversion of fuel-N to NOxand N2O in three kinds of combustor scale are compared, and the reasons for the difference in the conversion of fuel-N to NOxand N2O of three combustors are analyzed.
2EXPERIMENT FACILITY SETUP
Three combustors are set up to study the effect of combustor scale on NOxand N2O emissions during coal combustion. The conversion of fuel-N to NOxand N2O is calculated and compared for three combustors, including single particle combustion test rig, laboratory scale circulating fluidized bed and full scale circulating fluidized bed. Anthracite is used as fuel in all experiments in this work, the properties of coal used are listed in Table 1.
2.1Single particle combustion test rig
The NOxand N2O emissions can be influenced by the interaction between flue gases and the fuel particles, and the particle components can act as catalysts to affect the NOxand N2O formation and reduction during coal combustion [5, 9]. With the aim to minimize the interaction of flue gases and the fuel particles, some experiments of NOxand N2O emissions have been carried out using a single fuel particle [25-30]. In this work, the NOxand N2O formation during single coal particle combustion is investigated, and the conversion of fuel-N to NOxand N2O is calculated.
Figure 1 shows the schematic configuration of the single particle combustion test rig. The diameter of the reactor tube is 60 mm and the height is 500 mm. Quartz glass is used to make the preheating furnace and the reactor. Electrically heated furnace is employed to control the temperature of reactor. A thermocouple is installed in the reactor to measure the gas temperature. To model the gas composition of combustion environment in a full scale boiler, the conveying gas is made up of oxygen, nitrogen and carbon dioxide, and the N2volume concentration is 80.5%, O2is 11% and CO28.5%. Alicat mass-flow controllers are used to control the gas flow rates, with the accuracy of 0.01 L·min−1. The total gas flow rate is set to be 10 L·min−1for all cases. Thus, the gas velocity in the reactor is 0.234 m·s−1(T=800 °C), and the residence time is about 2.14 s, which is long enough for the homogeneous reactions. After the temperature reaches the desired value, a single coal particle is put in a platinum basket, which is hung up by a platinumwire. Gasmet FT-IR Dx4000 (Gasmet Technologies, Finland) is employed to analyze the gas component concentration, at the frequency of 10 Hz and with the accuracy of 0.01 μl·L−1. During the experiments, the data collected by the mass-flow controllers and the gas analyzers are displayed and saved by a computer.

Table 1Properties of coal used in this work

Figure 1Schematic configuration of the single particle combustion test rig
2.2Laboratory and full scale CFBs
In this work, a laboratory scale CFB is set up to investigate the NOxand N2O emissions and the conversion of fuel-N to NOxand N2O during coal combustion. The scaled CFB combustor is 550 mm in height and 50 mm in diameter. The full scale CFB has a generating capacity of 135 MW and an evaporation capacity of 440 t·h−1, with furnace height of 35.620 m and cross section area of 13.373×7.684 m2. The outlet pressure of superheated steam is 13.7 MPa, with the outlet temperature 540 °C, and total input air into the furnace is 486 m3·h−1.
To scale down the full scale CFB, some scaling criterions presented by Glick’man are followed [31, 32]. Table 2 lists the comparison of five non-dimensional numbers for laboratory scale and full scale CFBs. For
particle Reynolds number, its value should be larger than 400 to obtain similar characteristics of particle movement. In this work, the particle Reynolds numbers of both CFBs are larger than 400. More details on the scale criterion can be referred to Refs. [31, 32]. Fig. 2 shows the schematic configuration of the laboratory scale CFB. The combustor and air pre-heater is made up of quartz glass. The temperature of reactor is controlled by an electrically heated furnace. The fluidizing gas is air, with the total gas flow rate is 12 L·min−1. Primary air pass though the preheating tube first to be heated, and enters the CFB combustor to fluidize bed material supported by the air distributor, which is represented by the constriction segment portion in Fig. 2. Secondary air is divided into two streams, one for conveying fuel into combustor and the other for particle feed back. The gas flow rates are controlled by Alicat mass-flow controllers, with the accuracy of 0.01 L·min−1. The particles in the flue gases are separated by a cyclone, and then are fed back to combustor. The NOx, N2O and O2concentration in flue gases are measured by Gasmet FT-IR Dx4000, with the accuracy of 0.01 μl·L−1. The information of mass flow rates and gas concentrations are displayed and saved by a computer during the experiments.

Table 2Comparison of scale criterions for full scale and laboratory scale CFB
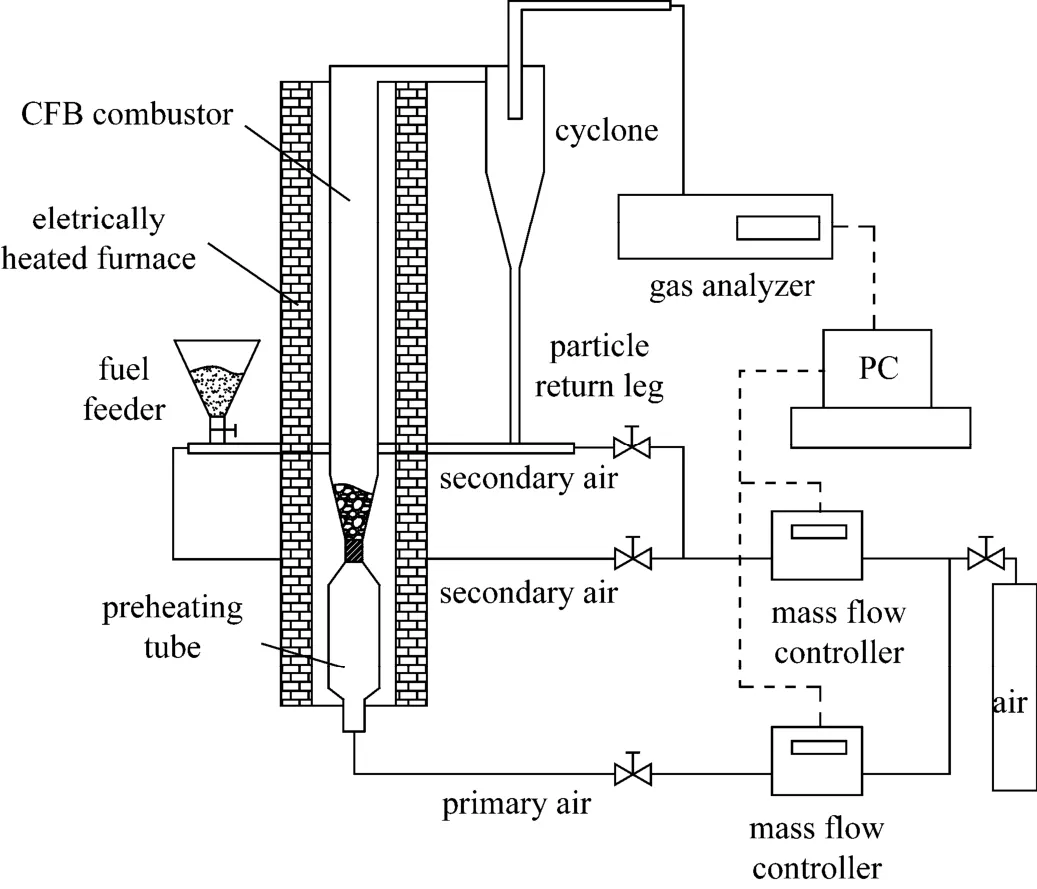
Figure 2Schematic configuration of laboratory scale CFB
3RESULTS AND DISCUSSIONS
3.1NOxand N2O emissions of single coal particle
The effect of temperature on the fuel-N conversion is studied in experiments of single coal particle combustion. Four temperature levels of 800, 830, 890 and 920 °C are chosen to be temperature conditions. For each case, the single coal particle is processed to be spheric shape with the same diameter of about 7 mm. During the single coal particle combustion, the NOxand N2O concentration in the flue gases are measured, and the conversion of fuel-N to NOxand N2O can be calculated as follows:
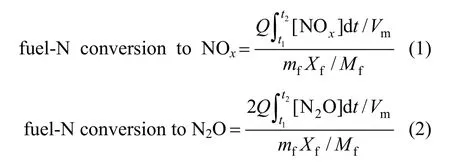
where Q is the gas flow rate, and Vmis the molar volume (under normal conditions). [NOx] and [N2O] are the NOxand N2O concentrations in μl·L−1. The time interval from t1to t2is the burning time of single coal particle. mfis the mass flow rate of single coal particle, and Xfis the nitrogen fraction of fuel, volatile and char. Mfis the atomic mass of nitrogen.
Figure 3 shows the conversion of fuel-N to NOxand N2O of single coal particle combustion. As can be seen, the conversion of fuel-N to N2O decreases when the temperature increases, while the conversion of fuel-N to NOxincreases with the increase in temperature. At the same time, the total conversion of fuel-N to NOxand N2O increases as the temperature increases. It is worth notice that the conversion of fuel-N to N2O is below 8% within the temperature concerned during single coal particle combustion, it is smaller than 1% especially when the temperature is greater than 890 °C. However, the conversion of fuel-N to NOxis very high (larger than 65%), and it can reach 82% at the temperature of 920 °C. Therefore, it can be concluded that the majority of fuel-N (65%-82%) is released as NOx, while only a little (less than 8%) fuel-N yields N2O during single coal particle combustion.

Figure 3The conversion of fuel-N to NOxand N2O of single coal particle combustion■ conversion of fuel-N to N2O; ● conversion of fuel-N to NOx;▲ conversion of fuel-N to N2O and NOx
3.2NOxand N2O emissions in laboratory scale CFB
Figure 4 shows the NOxand N2O concentration in flue gases under different combustion conditions in laboratory CFB. The influence of temperature and O2concentration on the N2O and NOxemission can be showed in Fig. 4 (a) and 4 (b), respectively. The N2O and O2concentrations mean their values in flue gas. O2concentration is relied on excess air, so the effect of excess air can be reflected by O2concentration in flue gas. As can be seen, both of the N2O concentration and NOxconcentration increase as the O2concentration increases. The N2O concentration decreases with increasing of temperature, while the NOxconcentration shows opposite tendency. The N2O concentration is more sensitive to O2concentration at lower temperature, and when the O2concentration is smaller than 3%, the influence of temperature on N2O concentration is unobvious, with the N2O concentration below 60 μl·L−1for temperatures of 750-850 °C. However, temperature produces more and more strong effect on the N2O concentration when the O2concentration increases, especially at the O2concentration of about 13%.

Figure 4The N2O and NOxconcentration in laboratory scale CFB (6% O2)■ 700 °C; ● 750 °C; ▲ 800 °C; ▼ 850 °C
For coal combustion in CFB, the conversion of fuel-N to NOxand N2O can be calculated as follows:

where [NOx] and [N2O] are the NOxand N2O concentrations in μl·L−1, Q is the gas flow rate, and Vmis the molar volume (under normal conditions). Rfand Xfis the mass flow rate of coal and the nitrogen fraction of fuel, volatile and char. Mfis the atomic mass of nitrogen.
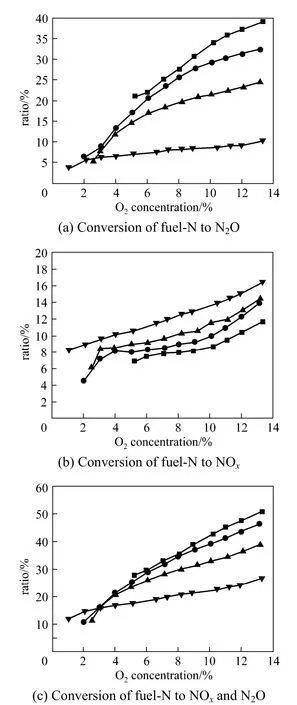
Figure 5The conversion of fuel-N to NOxand N2O in laboratory scale CFB■ 700 °C; ● 750 °C; ▲ 800 °C; ▼ 850 °C
Figure 5 shows the conversion of fuel-N to NOxand N2O under different combustion temperatures in laboratory scale CFB. As can be seen, the influence of temperature on the conversion of fuel-N to NOxand N2O is quite similar to NOxand N2O concentration. At temperature of 750 °C, the conversion of fuel-N to N2O increases from 6% to 32% with O2concentration increasing from 3% to 13%. When the O2concentration is smaller than 3%, the conversion of fuel-N to N2O is smaller than 8% for temperatures of 750-850 °C, while that ranges from 10% to 39% at the O2concentration of about 13% with the temperature decreasing from 850 °C to 700 °C. As can be seen from Fig. 5 (b), the conversion of fuel-N to NOxis 4.5%-16% under the conditions concerned. At a certain temperature, the relation between the conversion of fuel-N to NOxand the O2concentration is nearly linear, which is different from the conversion of fuel-N to N2O. Fig. 5 (c) shows the conversion of fuel-N to NOxand N2O decreases as the temperature rises, but it increases with increased O2concentration. When the temperature decrease from 850 °C to 700 °C, the conversion of fuel-N to NOxand N2O is less than 16% with the O2concentration smaller than 3%, but the conversion of fuel-N to NOxand N2O increases from 26.6% to 50.8% at the O2concentration of about 13%.
3.3NOxand N2O emissions in full scale CFB
The NOxand N2O emissions in 4 cases were measured in a full scale CFB with the capacity of 135 MW. Fig. 6 shows the NOxand N2O concentrations in the full scale CFB. The N2O concentration decreases from 76.5 μl·L−1(at 6% O2) to 20.9 μl·L−1, but NOxconcentration increases from 66.6 μl·L−1to 114 μl·L−1with increased temperature. For Case 1, NOxconcentration is 66.6 μl·L−1, while N2O concentration is 76.5 μl·L−1which is higher than NOxconcentration. So the N2O emission may be the major pollutant in full scale CFB in some case, especially at low temperature.
Figure 7 shows the conversion of fuel-N to NOxand N2O for the full scale CFB. The conversion of fuel-N to N2O decreases from 5.5% to 0.7%, but the conversion of fuel-N to NOxincreases from 2.3% to 3.9%. For Case 1, the conversion of fuel-N to NOxand N2O is 7.9%, and it is about 5% for Cases 2-4.
3.4Discussions
To investigate the effect of combustor scale on the conversion of fuel-N to NOxand N2O, experiments were carried out in three different combustors. For single coal particle combustion, the majority of fuel-N (65%-82%) is released as NOx, while only a little (less than 8%) fuel-N yields N2O during single coal particle combustion. For laboratory scale CFB, there is more fuel-N is converted to the N2O, but quite less fuel-N is converted to NOxthan single coal particle combustion. Fig. 8 shows the comparison of the conversion of fuel-N to NOxand N2O in single coal particle combustion test rig and laboratory scale CFB underthe same conditions of temperature of 800 °C and O2concentration of 11%. As can be seen, the conversion of fuel-N to N2O increases from 7.6% to 22%, while the conversion of fuel-N to NOxdecreases from 67% to 11.8% in laboratory scale CFB.

Figure 6The N2O and NOxconcentration in full scale CFB (6% O2)
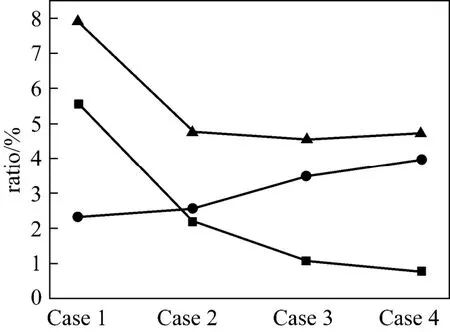
Figure 7The conversion of fuel-N to NOxand N2O in full scale CFB■ conversion of fuel-N to N2O; ● conversion of fuel-N to NOx; ▲ conversion of fuel-N to N2O and NOx

Figure 8Comparison between single particle combustion and laboratory scale CFB (T=800 °C, O2=11%)conversion of fuel-N to NOx;conversion of fuel-N to N2O
This is because there are a lot of char in CFB. The presence of char provides nitrogen site (CN·), and N2O can be formed by reducing NOx[27]:

As a result, the conversion of fuel-N to N2O increases while the conversion of fuel-N to NOxdecreases, because of the abundance of char in CFB. Johnsson et al. also carried out experiments in a 12 MW circulating fluidizing bed boiler, and they found that 80% of the N2O destruction is caused by char, while 20% is duo to the catalytic decomposition [9].
The comparison between laboratory scale and full scale CFB are carried out under the same or similar combustion conditions. Fig. 9 shows the comparison of the conversion of fuel-N to NOxand N2O between laboratory scale CFB (T=800 °C, O2=6.1%) and full scale CFB (Case 1: T=798 °C, O2=6.25%). As can be seen, both of the conversion of fuel-N to NOxand the conversion of fuel-N to N2O in laboratory scale CFB are large than full scale CFB. There are some differences between laboratory scale and full scale CFB, such as size of combustion zone, characteristics of gas and solid mixing, macro mixing time and the residence time, these factors may result in different properties of NOxand N2O formation and emission. This phenomenon is in accordance with the conclusion by Cen et al. [33] that although the NOxformationin enlarged scale CFB will increase because the mixing between fuel and air becomes weak in a larger volume, the NOxand N2O will decrease due to the weaken boundary effect on the NOxand N2O formation. On the whole, the NOxand N2O emissions decrease in an enlarged CFB [33].
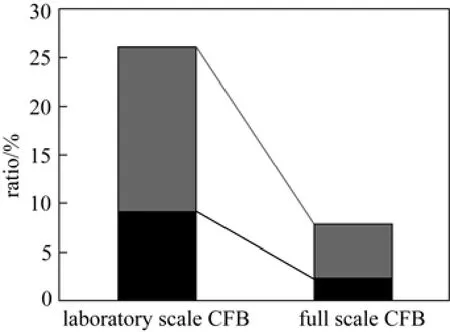
Figure 9Comparison between laboratory scale (T=800 °C, O2=6.1%) and full scale CFB (Case 1: T=798 °C, O2= 6.25%)conversion of fuel-N to NOx;conversion of fuel-N to N2O
4CONCLUSIONS
In this work, experiments are carried out in three combustors, including single coal particle combustion test rig, laboratory scale CFB and full scale CFB to investigate the combustor effect on the conversion of fuel-N to NOxand N2O. During single coal particle combustion, the majority of fuel-N (65%-82%) is released as NOx, while only a little (less than 8%) fuel-N yields N2O. For laboratory scale CFB, the N2O concentration is sensitive to O2concentration at low temperature; the influence of temperature on N2O concentration is unobvious with the low O2concentration; the influence of temperature on the conversion of fuel-N to NOxand N2O is similar to NOxand N2O concentration. In full scale CFB, the conversion of fuel-N to NOxand N2O is much lower than that of single coal particle combustion and laboratory scale CFB, the conversion of fuel-N to NOxand N2O is 5%-7.9% for the four cases.
For laboratory scale CFB, the conversion of fuel-N to N2O is larger, but the conversion of fuel-N to NOxis quite less than that of single coal particle combustion. Because of the abundance of char in CFB, char can promote the NOxreduction by increasing N2O formation. In full scale CFB, both of the conversion of fuel-N to NOxand the conversion of fuel-N to N2O are smaller than that of laboratory scale CFB.
NOMENCLATURE
D furnace equivalent diameter, m
dpparticle diameter, m
g gravitational acceleration, m·s2
H furnace height, m
Mfatomic mass of nitrogen, g·mol−1
mfmass of single coal particle, g·s−1
[NOx] N2O concentrations, μl·L−1
[N2O] N2O concentration, μl·L−1
Q flue gas flow rate, L·s−1
Rfmass flow rate of fuel, g·s−1
Vmmolar volume (under normal conditions), L·mol−1
V0fluidizing velocity, m·s−1
Xfnitrogen fraction of fuel
μ kinetic viscosity, m2·s−1
ρpparticle density, kg·m−3
ρggas density, kg·m−3
REFERENCES
1 Leckner, B., “Fluidized bed combustion: Mixing and pollutant limitation”, Prog. Energy Combust. Sci.,24, 31-61 (1998).
2 Collings, M.E., Mann, M.D., Young, B.C., “Effect of coal rank and circulating fluidized-bed operating parameters on nitrous oxide emissions”, Energy Fuels,7, 554-558 (1993).
3 Diego, L.F., Londonot, C.A., Wang, X.S., Gibbs, B.M., “Influence of operating parameters on NOxand N2O axial profiles in a circulating fluidized bed combustor”, Fuel,75, 971-978 (1996).
4 Armesto, L., Boerrigter, H., Bahillo, A., Otero, J., “N2O emissions from fl uidised bed combustion: The effect of fuelcharacteristics and operating conditions”, Fuel,82, 1845-1850 (2003).
5 Svoboda, K., Pohorely, M., “In fl uence of operating conditions and coal properties on NOxand N2O emissions in pressurized fl uidized bed combustion of subbituminous coals”, Fuel,83,1095-1103 (2004).
6 Valentim, B., Sousa, M.J., Abelha, P., Boavida, D., Gulyurtlu, I.,“Combustion studies in a fluidised bed—The link between temperature, NOxand N2O formation, char morphology and coal type”, Int. J. Coal Geol.,67, 191-201 (2006).
7 Tarelho, L.C., Matos, M.A., Pereira, F.A., “In fl uence of limestone addition on the behaviour of NO and N2O during fl uidised bed coal combustion”, Fuel,85, 967-977 (2006).
8 Lyngfelt, A., Amand, L., Leckner, B., “Reversed air staging—A method for reduction of N2O emissions from fluidized bed combustion of coal”, Fuel,77, 953-959 (1998).
9 Johnsson, J.E., Amand, L.E., Johansen, K.D., Leckner, B., “Modeling N2O reduction and decomposition in a circulating fluidized bed boiler”, Energy Fuels,10, 970-979 (1996).
10 Gustavsson, L., Glarborg, P., Leckner, B., “Modeling of chemical reactions in afterburning for the reduction of N2O”, Combust. Flame,106, 345-358 (1996).
11 Shen, B.X., Mi, T., Liu, D.C., Feng, B., Yao, Q., Winter, F., “N2O emission under fluidized bed combustion condition”, Fuel Process. Technol.,84, 13-21 (2003).
12 Hou, X., Zhang, H., Yang, S., Lu, J., Yue, G., “N2O decomposition over the circulating ashesfrom coal-fi red CFB boilers”, Chem. En g. J.,140, 43-51 (2008).
13 Murakami, T., Suzuki, Y., “New approach to understanding NO emission during bubbling fluidized bed coal combustion: Separation of NO formation and reduction processes in the bed”, Energy Fuels,23, 1950-1955 (2009).
14 Liu, H., Feng, B., Lu, J., Zhang, G., “Coal property effects on N2O and NOxformation from circulating fluidized bed combustion of coal”, Chem. Eng. Comm.,192, 1482-1489 (2005).
15 Gani, A., Morishita, K., Nishikawa, K., Naruse, I., “Characteristics of co-combustion of low-rank coal with biomass”, Energ y Fuels,19, 1652-1659 (2005).
16 Li, Z., Lu, Q., Na, Y., “N2O and NO emissions from co-firing MSW with coals in pilot scale CFBC”, F uel Process. Technol.,85, 1539-1549 (2004).
17 Shimizu, T., Toyono, M., “Emissions of NOxand N2O during co-combustion of dried sewage sludge with coal in a circulating fl uidized bed combustor”, Fuel,86, 2308-2315 (2007).
18 Xie, J., Yang, X., Zhang, D., Tong, l., Song, W., Liu, W., “Emissions of SO2, NO and N2O in a circulating fluidized bed combustor during co-firing coal and biomass”, J. Envir. Sci.,19, 109-117 (2007).
19 Zheng, Y., Fan, J., Ma Y., Sun, P., Cen, K., “Computational modeling of tangentially fired boiler (II) NOxemissions”, Chin. J. Chem. Eng.,8(3), 247-250 (2000).
20 Hiltunen, M., Kilpinen, P., Hupa, M., Lee, Y., “N2O emissions from CFB boilers”, In: Proceedings of the Eleventh international Conference on Fluidized-Bed Combustion, Anthony, E.J., ed., ASME Press, New York (1991).
21 John, P., Willem, L., Mark, E., “The effect of burner scale on NOxemissions from a swirl stabilized pulverized coal burner”, Fuel,69(11), 1350-1355 (1990).
22 Sadakata, M., Hirose, Y., “Scaling law for pollutant emission from a combustion furnace”, Fuel,73(8), 1338-1342 (1994).
23 Xiang, J., Sun, X., Hu, S., Yu, D., “An experimental research on boiler combustion performance”, Fuel Process. Technol.,68(2), 139-151 (2000).
24 Gulyurtlu, “A comparison of NOxlevels from R&D studies with values measured at different plants”, Fuel,74(2), 253-257 (1995).
25 Lu, Y., “Laboratory studies on devolatilization and char oxidation under PFBC conditions (2) Fuel nitrogen conversion to nitrogen oxides”, Energy Fuels,10, 357-363 (1996).
26 Tullin, C.J., Goel, S., Morihara, A., Sarofim, A.F., Beer, J.M., “NO and N2O formation for coal combustion in a fluidized bed: Effect of carbon conversion and bed temperature”, Energy Fuels,7, 796-802 (1993).
27 Hayhurst, A.N., Lawrence, A.D., “The amounts of NO, and NO formed in a fluidized bed combustor during the burning of coal volatiles and also of char”, Combust. Flame,105, 341-357 (1996).
28 Loffler, G., Andahazy, D., Wartha, C., Winter, F., Hofbauer, H., “NOxand N2O formation mechanisms—Detailed chemical kinetic modeling study on a single fuel particle in a laboratory-scale fluidized bed”, Journal of Energy Resources Technology-Transactions of the ASME,123, 228-235 (2001).
29 Winter, F., Wartha, C., Hofbauer, H., “NO and N2O formation during the combustion of wood, straw, malt waste and peat”, Bioresource Technol.,70, 39-49 (1999).
30 Tullin, C.J., Sarofim, A.F., Beer, J.M., Teare, J.D., “Effect of SO2and NO on the conversion of fuel nitrogen to N2O and NO in single particle combustion of coal”, Combust. Sci. Tech.,106, 153-166 (1995).
31 Glicksman, L.R., “Scaling relationships for fluidized beds”, Chem. Eng. Sci.,39(9), 1373-1379 (1984).
32 Glicksman, L.R.,Yule, T.,Dyrness, A., Carson, R., “Scaling the hydrodynamics of fluildized bed combustors with cold models in experimental confirmation”, In: Proceedings of the 1987 Inter. Conf. on Fluidized Bed Combustion, Mustonen, J.P., ed., ASME Press, Boston, Massachusetts, 511-514 (1987).
33 Cen, K.F., Ni, M.J., Luo Z.Y., Yan J.H., Chi R., Fang, M.X., Theory Design and Operation of Circulating Fluidized Bed Boiler, China Electricity Press, China (1998). (in Chinese)
10.1016/S1004-9541(13)60571-6
2011-09-05, accepted 2012-04-27.
* Supported by the National Basic Research Program of China (2009CB219802).
** To whom correspondence should be addressed. E-mail: zhouhao@cmee.zju.edu.cn
杂志排行
Chinese Journal of Chemical Engineering的其它文章
- Halloysite Nanotube Composited Thermo-responsive Hydrogel System for Controlled-release*
- Experimental and Theoretical Studies of CO2Absorption Enhancement by Nano-Al2O3and Carbon Nanotube Particles
- A Novel γ-Alumina Supported Fe-Mo Bimetallic Catalyst for Reverse Water Gas Shift Reaction*
- Recent Advances in Separation of Bioactive Natural Products*
- Volumetric and Transport Properties of Aqueous NaB(OH)4Solutions*
- A New Tuning Method for Two-Degree-of-Freedom Internal Model Control under Parametric Uncertainty*
