Fast and Slow Responses of the North Pacific Mode Water and Subtropical Countercurrent to Global Warming
2013-07-28XULixiao1XIEShangPing2andLIUQinyu1
XU Lixiao1), 2), 3), XIE Shang-Ping2), 1), and LIU Qinyu1), *
Fast and Slow Responses of the North Pacific Mode Water and Subtropical Countercurrent to Global Warming
XU Lixiao, XIE Shang-Ping, and LIU Qinyu
1),,266100,2),,,92093-0230,3),,,96822,
Six coupled general circulation models from the Coupled Model Intercomparison Project Phase 5 (CMIP5) are employed for examining the full evolution of the North Pacific mode water and Subtropical Countercurrent (STCC)under global warming over 400 years following the Representative Concentration Pathways (RCP) 4.5. The mode water and STCC first show a sharp weakening trend when the radiative forcing increases, but then reverse to a slow strengthening trend of smaller magnitude after the radiative forcing is stablized. As the radiative forcing increases during the 21st century, the ocean warming is surface-intensified and decreases with depth, strengthening the upper ocean’s stratification and becoming unfavorable for the mode water formation. Moving southward in the subtropical gyre, the shrinking mode water decelerates the STCC to the south. After the radiative forcing is stabilized in the 2070s, the subsequent warming is greater at the subsurface than at the sea surface, destabilizing the upper ocean and becoming favorable for the mode water formation. As a result, the mode water and STCC recover gradually after the radiative forcing is stabilized.
mode water; STCC; fast and slow response; CMIP5; radiative forcing
1 Introduction
In the central subtropical gyre of the North Pacific (20˚N–30˚N), there is an eastward surface current named the Subtropical Countercurrent (STCC). Together with theories (Kubokawa, 1999), the recent enhanced observations (Aoki., 2002; Kobashi, 2006) and model simulations (Kubokawa and Inui, 1999; Yamanaka., 2008; Xie., 2011; Xu., 2012a, b) show the importance of the mode water in the existence and variability of STCC. The mode water of low potential vorticity (PV) shoals the upper thermocline northward in the central subtropical gyre, and anchors the STCC in the thermal- wind relationship (Kobashi., 2006; Xie., 2011).
The atmospheric concentration of carbon dioxide (CO) has been steadily increasing since the Industrial Revolution and will continue to increase for the foreseeable future. As the radiative forcing of the planet increases, various components of the coupled ocean–atmosphere system respond to this external forcing at different time scales, including the fast response of the mixed layer and the slow response of the permanent thermocline and deepwater massesventilation and mixing (Stouffer, 2004). Fig.1 shows the time evolution of the area-aver- aged sea surface temperature (SST) for the globe, the North Pacific (120˚E–120˚W, 20˚N–45˚N), and the Kuroshio-Oyashio Extension (KOE) region (140˚E–140˚W, 30˚N–45˚N). In all three regions, SST increases rapidly with COconcentrations from 2001 to the late 21st century. This fast response of SST is nearly in equilibrium with the increasing radiative forcing within the ocean mixed layer (Held., 2010). After the radiative forcing is stabilized in the 2070s, SST continues to rise but the rate of increase slows down dramatically. With the radiative forcing reaching a constant, this slow response of SST is due to the gradual warming of the subsurface ocean, which is in contrast to the fast response directly induced by radiative flux at the sea surface. Formed in the deep winter mixed layer, the mode water may be especially sensitive to the change in upper ocean stratification associated with the transition from the fast to slow response. Previous studies mainly focused on the fast response. It was found that in global warming, the mode water production decreases and takes place on lighter isopycnal surfaces (Luo., 2009), decelerating the STCC and leaving the banded structures on SSH and SST changes (Xie., 2011; Xu., 2012a, b). The full evolution of the mode water and STCC response, especially after the green house gas (GHG) stabilization, has not been investigated.
The present study examines six coupled general circulation models (CGCMs) from the Coupled Model Intercomparison Project Phase 5 (CMIP5) that offer long-term global-warming simulations through the 23rd century, well after the GHG stabilization. The full evolution of mode water and STCC response to global warming is investigated. It is shown that the response consists of two distinct stages: the fast response characterized by the weakened mode water ventilation and STCC from 2001 to 2070 when the radiative forcing steadily increases, and the slow response characterized by a slow recovery of the mode water formation after the radiative forcing has stabilized. Both types of the mode water response are closely related to changes in stratification and mixed layer depth (MLD) in the formation region.
The rest of the paper is organized as follows. Section 2 briefly describes the data source and analysis method. Section 3 presents the main results. Section 4 is a summary.
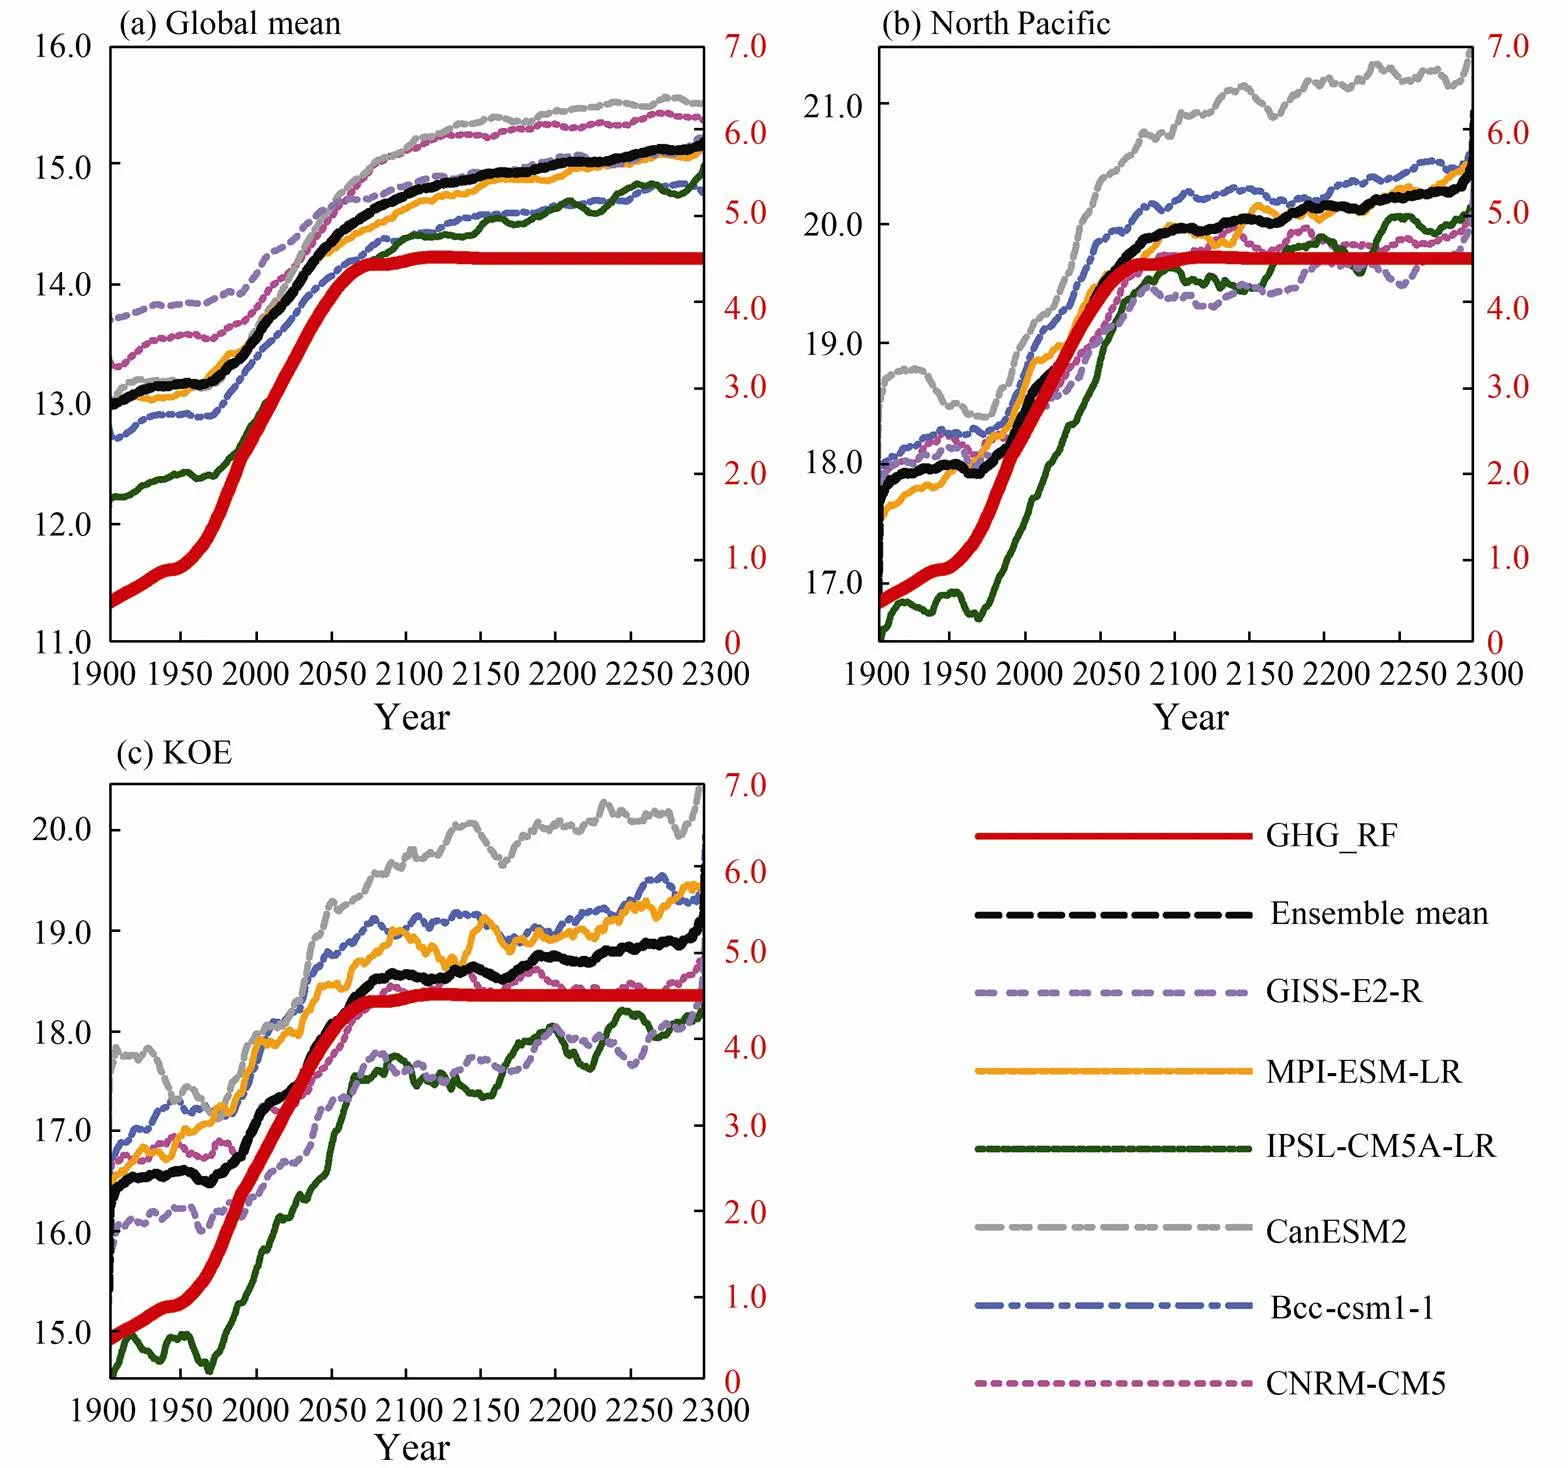
Fig.1 Time series ofthe area-averaged SST (℃) for a) globe, b) the North Pacific (120˚E–120˚W, 20˚N–45˚N) and c) Kuroshio-Oyashio Extension region (140˚E–140˚W, 30˚N–45˚N) based on six CMIP5 models. The black dash line represents the ensemble mean of the six models and the thick red line represents the radiative forcing concentrations for historical and RCP4.5 scenarios. The other lines displayed in the legend correspond to the results of six individual models, respectively.
2 Data and Methods
The model output in this study is from six coupled climate models (Table 1) as part of the CMIP5, which offers a multi-model perspective of simulated climate variability and change (Taylor., 2012). Both the historical (20th century with all forcing) simulation and the representative concentration pathways (RCP) 4.5 scenario (approximately with a radiative forcing of 4.5Wmat year 2100, relative to pre-industrial conditions) are used. For most of the CMIP5 models, the RCP 4.5 scenario extends only to 2100. To focus on the long-term response, a subset of model integrations that extend to 2300 is selected. The spatial resolution varies between models and within the same model for atmospheric and oceanic variables. To facilitate comparisons with each other, all the model results are interpolated onto a 1˚×1˚ latitude-longitude grid. The model output is freely available from the program for climate model diagnosis and intercomparison (PCMDI) at the Lawrence Livermore National Laboratory (http://cmip-pcmdi.llnl.gov/cmip5/). For each model only one member run is analyzed (usually ‘rli1p1’).
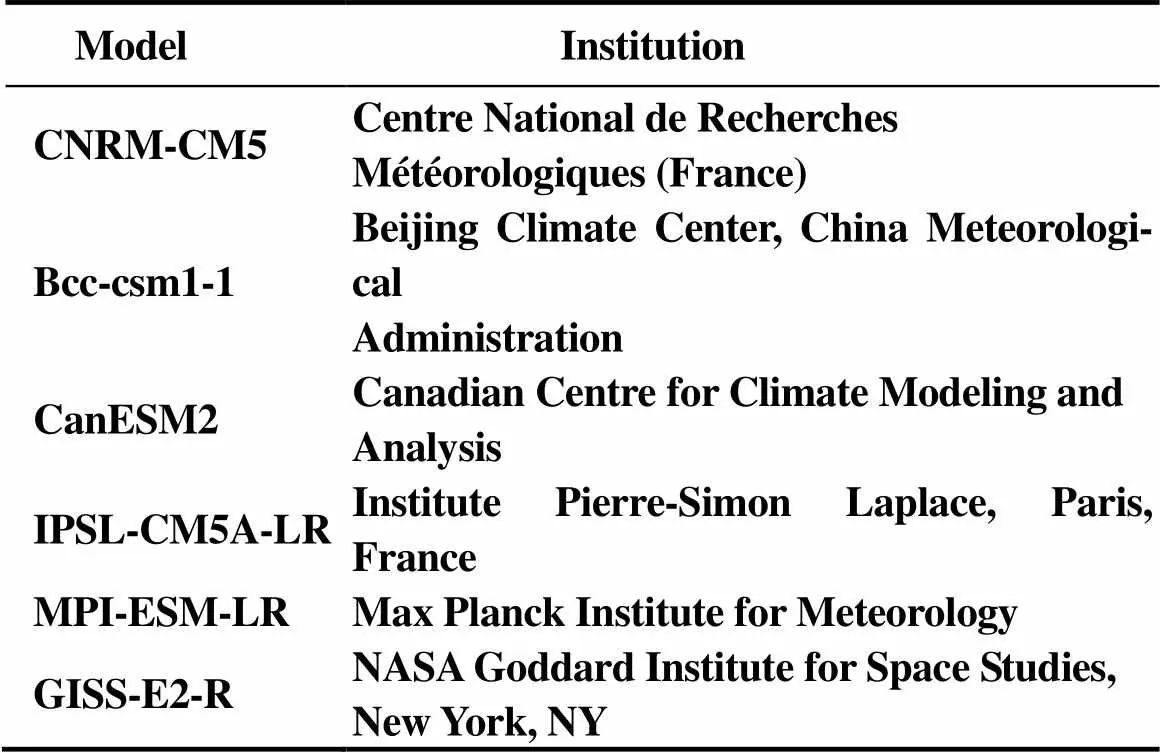
Table 1 List of six CMIP5 models used in this study
3 Results
3.1 Mode Water Ventilation and Its Dynamical Effect on STCC
This subsection gives the physical basis for how the mode water is subducted and related to STCC in the CMIP5 models.The MLD, defined as the depth at which the water density is 0.03kgmdenser than at the sea surface, reaches its seasonal maximum in the North Pacific in March. KOE east of Japan has the deepest simulated MLD (>250m) (Fig.2a). Separating this deep mixed layer region from the rest of the North Pacific is a narrow transition zone called the MLD front, which is the key to the formation of low PV waters (Kubokawa, 1999). The low PV water north of STCC is subducted from the intersections of outcrop lines and MLD front (Xie., 2000). The MLD front slants slightly northeastward from the western subtropical gyre, while outcrop lines are almost zonal. As the outcrop line of increasing density successively intersects the MLD front northeastward, the low PV fluids on denser isopycnals are formed in the northeast (Kobashi and Kubokawa, 2012). As in observations (Kobashi., 2006) and Kubokawa’s theory, trajectories of these minimum PV fluids on isopycnals converge on the horizontal plane as they are advected southward, and the low PV fluids are stacked up vertically to form a thick layer of low PV fluids. This thick low-PV pool shoals the upper thermocline, leading to an eastward countercurrent on the southern flank (Kubokawa and Inui, 1999).
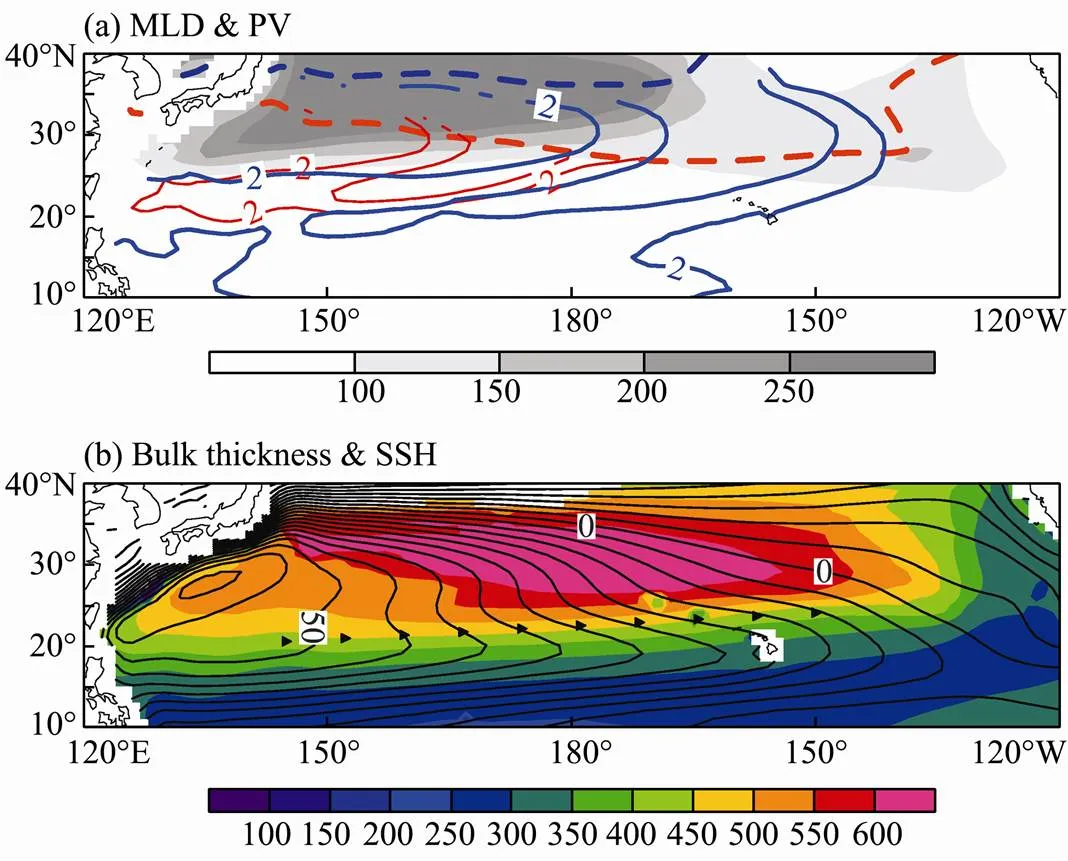
Fig.2 Present-day climatology of a) MarchMLD (gray shade), outcrop lines (dash contour), and low PV distribution for the core layer of STMW and CMW (solid line). The outcrop lines and low PV contours for STMW are plotted in red color, whereas for CMW in blue line; b) Bulk thickness of the layer between 24.5σθand 26.6σθ(color shade in a 50m interval), and SSH (black contours at a 5cm interval).
An accumulative variable ‘bulk thickness’ is introduced to highlight the accumulated effect of low PV waters on the STCC formation. The bulk thickness represents the thickness of a layer that contains the mode waters. After investigation of the climatological thermocline structure in the central North Pacific, the bulk thickness is calculated as the difference of isopycnal depths between the seasonal (24.5σ) and permanent (26.6σ; largely unventilated)thermocline because this layer contains both the subtropical mode water (STMW) and the central mode water (CMW) (Xu., 2012a). Marked with solid triangles in Fig.2b, the STCC is located in the central gyre (20˚N–30˚N) where the sea surface height (SSH) contours veer northwestward. Large bulk thickness values are located in the central subtropical gyre just to the north of the STCC (Fig.2b), suggesting the dynamic effect of the mode water on the STCC.
3.2 Time Evolutions of MLD, Mode Water and STCC
By combining the historical and the RCP 4.5 runs, a 400-year dataset from 1900 to 2300 is formed. A 9-year low pass filter is applied to remove high frequency and to identify long-term variability. Using this dataset, the full evolutions of the MLD, the mode water, and the STCC under global warming are investigated.
Using the output from the six CMIP5 models, an em- pirical orthogonal function (EOF) analysis is performed for MLD anomaly in the Kuroshio Extension region (140˚E–170˚W, 25˚N–45˚N) where the STMW and the CMW are formed. The spatial patterns (Fig.3) and principal components (PC) (Fig.4) of the leading mode in the six CMIP5 models are similar and characterized by the overall shoaling of the MLD under global warming. The MLD PC1 in all the CMIP5 models first show a fast shoaling trend as the GHG forcing in RCP4.5 increases from 2001 to about 2070, but then a slow deepening trend when the GHG forcing is stabilized. The fast and slow responses in the MLD correspond well to two epochs of the GHG increase and leveling off, respectively. Fig.5 shows the area-averaged temperature change in the KOE region (140˚E–170˚W, 25˚N–45˚N) as a function of depth and time. To compare the temperature changes between the fast and slow response epochs, the temperature time series from 2001 to 2070 is subtracted from the 2001–2010 average while the time series from 2071 to 2300 is subtracted from the 2071–2080 average. This method separates the MLD’s fast and slow responses well. As the GHG forcing rapidly increases from 2001 to 2070 (Fig.5a), the ocean is heated from the above, and the surface warming is greater than the warming at depth. This intensifies the upper ocean stratification and shoals the MLD. On the other hand, with the GHG forcing stabilized in the 2070s, the subsequent subsurface warming is greater than the warming at the sea surface (Fig.5b), which reduces the upper ocean stratification and deepens the MLD as a result.
Corresponding to the MLD change, the mode water shows fast and slow evolutions. Fig.6a shows the time series of bulk thickness anomaly between 24.5σand 26.6σover the North Pacific (120˚E–140˚W, 20˚N–40˚N). Its evolution is similar to the MLD PC1. The correlation coefficient between the ensemble mean MLD PC1 and bulk thickness anomaly is~0.93. The bulk thickness in the 20th century exhibits a decadal variability at a typical time scale of 50 years (Xie., 2011). As the atmospheric COconcentrations increase from 2001 to 2070, the bulk thickness decreases sharply because the more stratified upper ocean and the shoaling MLD are unfavor-able for the mode water formation. After the radiative forcing is stabilized, favorable conditions for the mode water formation are created. Under those conditions, the MLD deepens slowly and the bulk thickness increases slightly because of more heat release from the warm sea surface to the atmosphere and slowly subsurface warming. Anchored by the mode water to the north as discussed in the last subsection, the STCC shows corresponding changes following the mode water change with a high correlation (~0.92). The zonal velocity of the STCC decreases sharply with the decreasing bulk thickness in the first half of the 21st century, and returns to stronger values as the bulk thickness gradually recovers after the 21st century (Fig.6b).
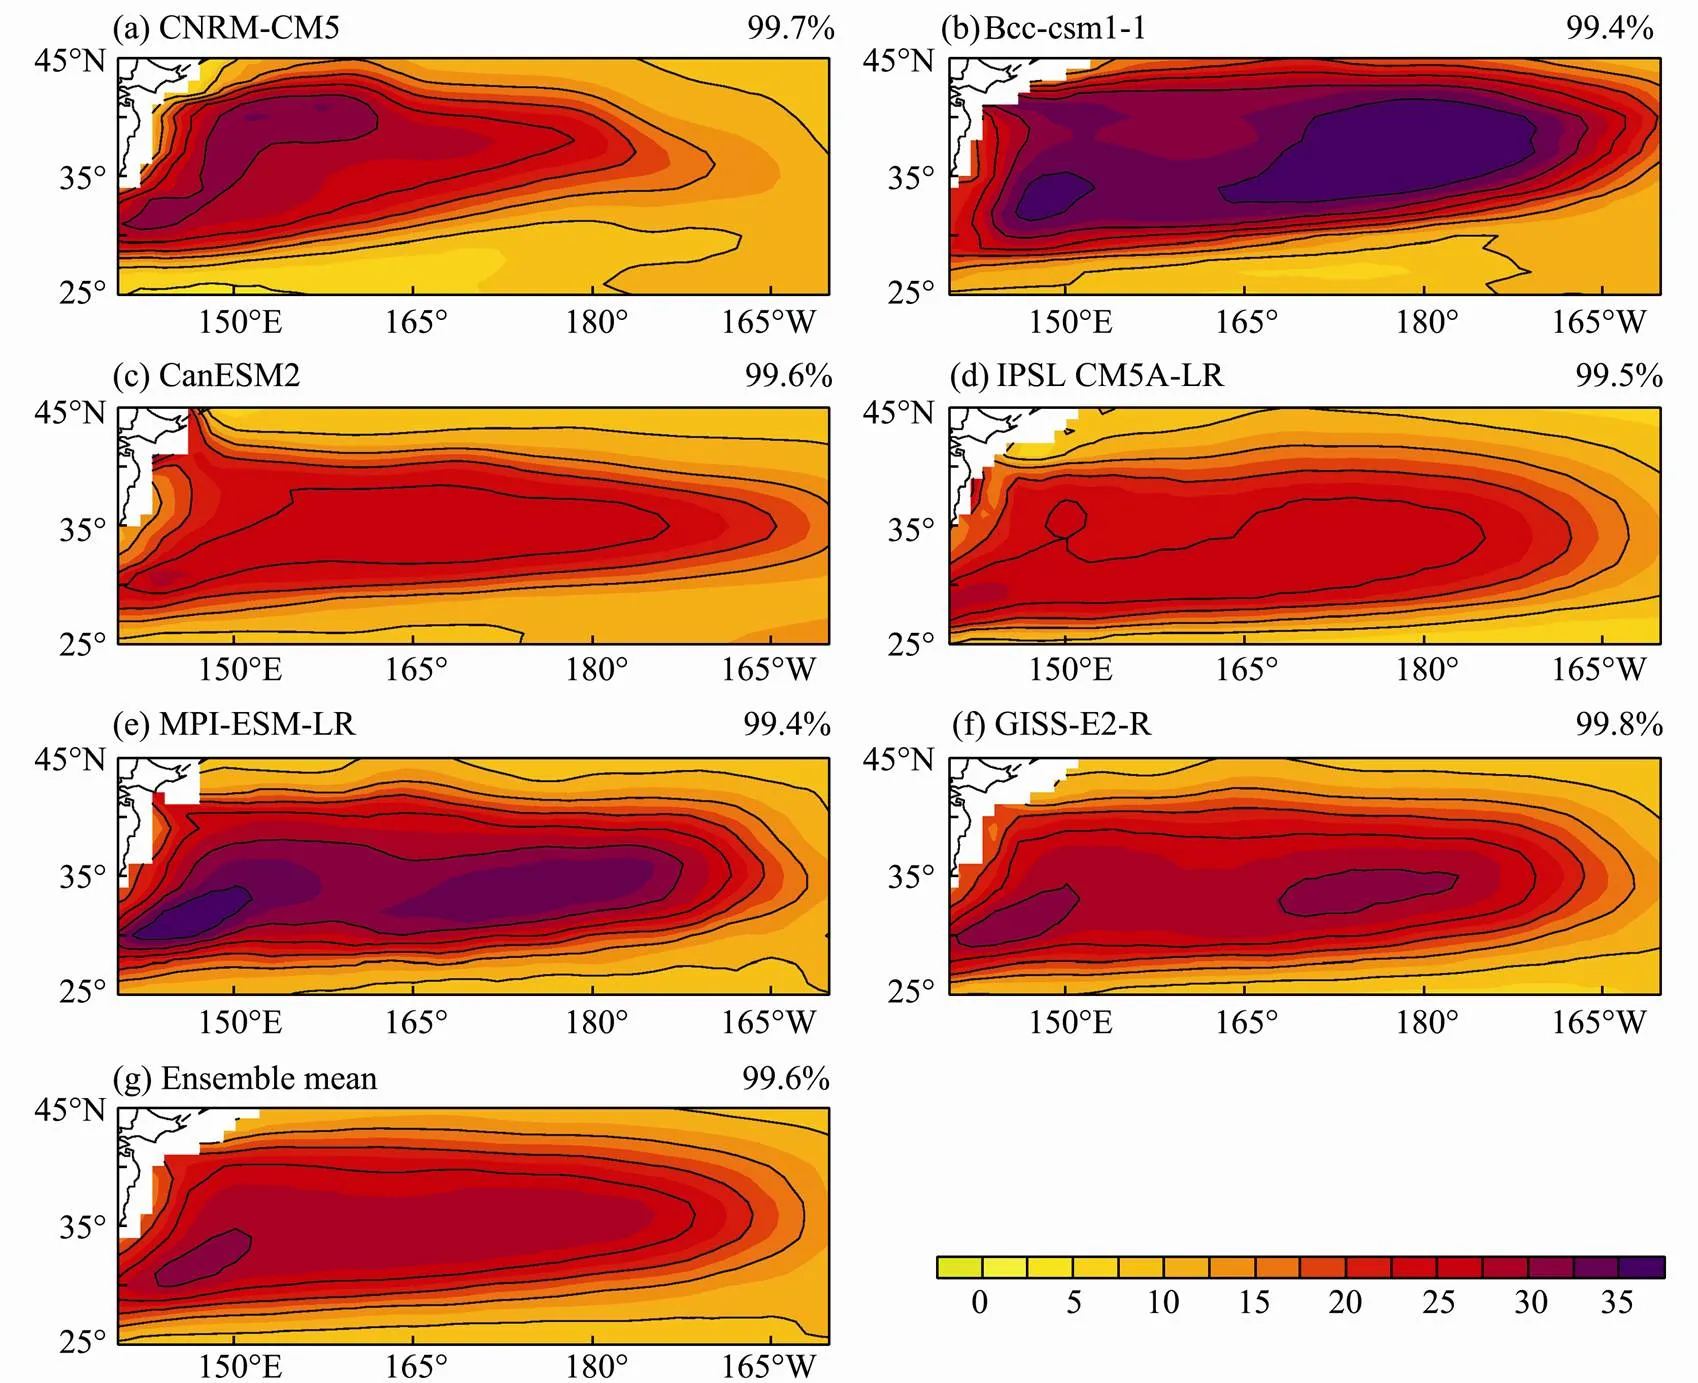
Fig.3 The first EOF mode of MLD (color shade in m) and the historical mean MLD (black contours in a 50minterval) in the Kuroshio Extension region (140˚E–170˚W, 25˚N–45˚N) for each of the CMIP5 models. The variance fraction explained by the EOF mode is printed at the top-right corner of each panel. The magnitude of the EOF patterns corresponds to a unit deviation of the PC in Fig.4.
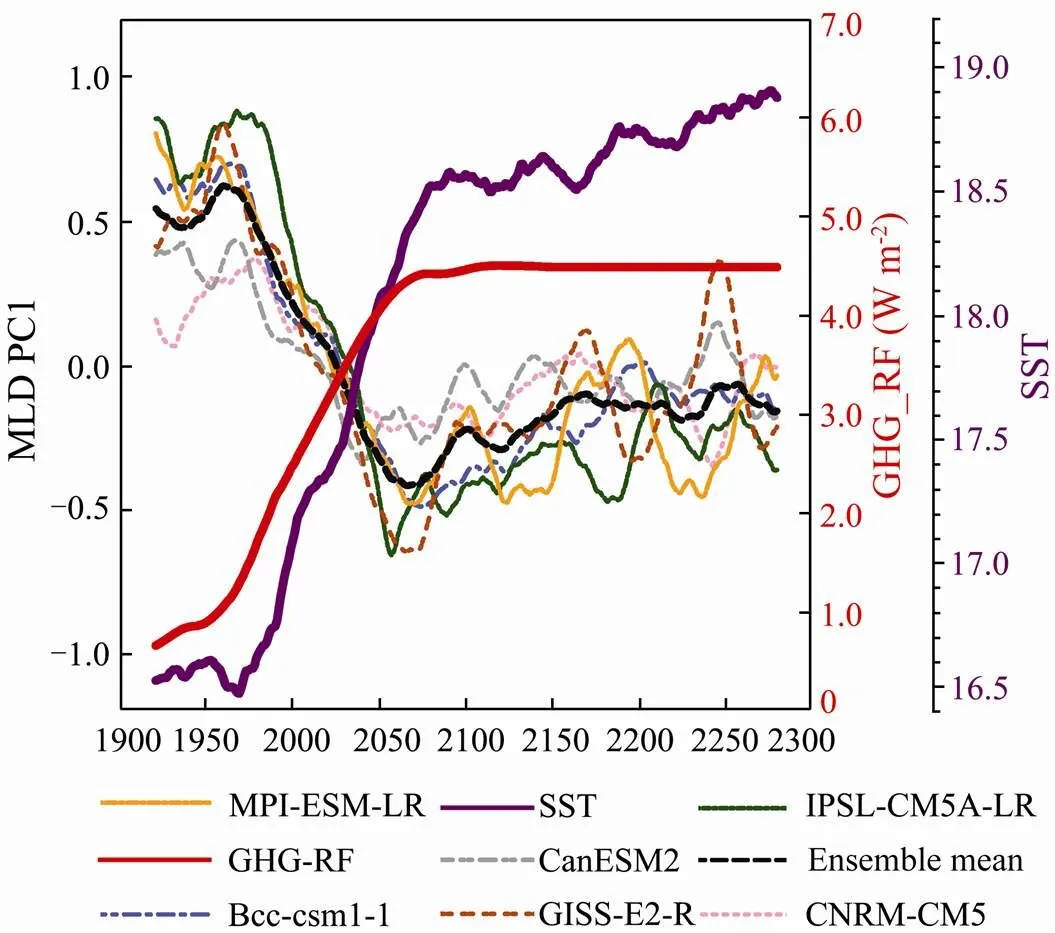
Fig.4 PC of the first EOF mode of MLD in the Kuroshio Extension region. The solid purple line is the area-averaged SST (℃) in the EOF domain (140˚E–170˚W, 25˚N–45˚N), and the solid red line represents the radiation forcing concentrations for historical and RCP 4.5 scenarios. The other lines displayed in the legend correspond to the results of six individual models, respectively.
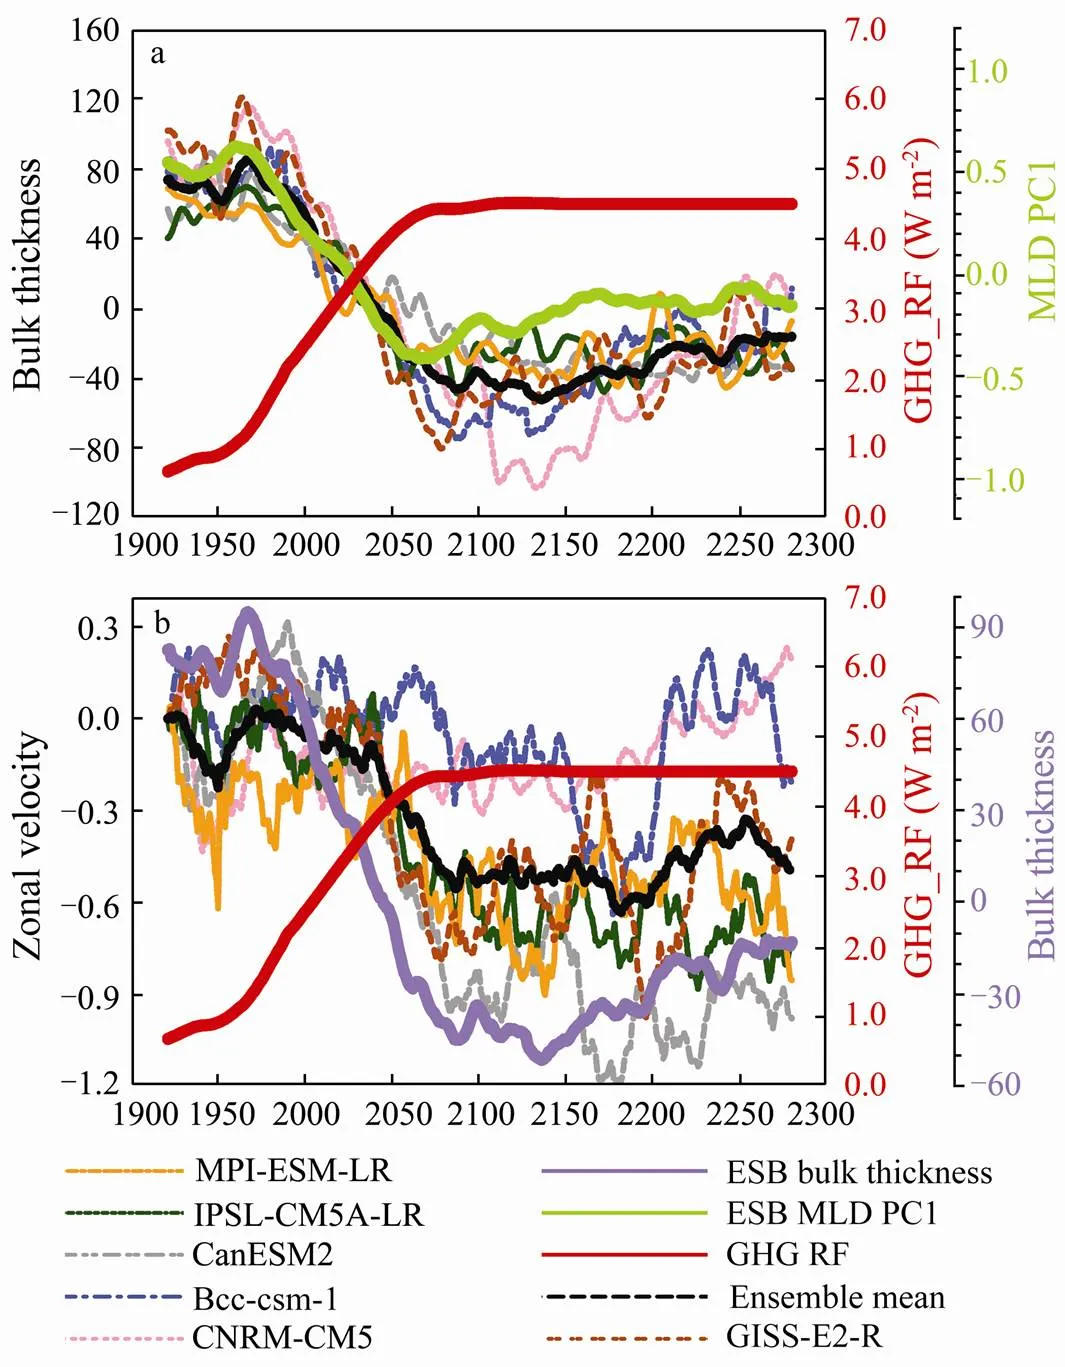
Fig.6 a) Bulk thickness anomaly (m) between 24.5σθand 26.6σθover the North Pacific (120˚E–140˚W, 20˚N–40˚N). The solid green line represents the ensemble mean of MLD PC1 as shown in Fig.4. b) Area-averaged 0–50m mean zonal velocity anomaly (cms-1) over the STCC (145˚E–145˚W, 22˚N–27˚N). The solid purple line represents the ensemble mean bulk thickness anomaly in a). The solid red line represents the radiation forcing concentrations for historical and RCP 4.5 scenarios. For each model the bulk thickness (zonal velocity) is subtracted from the 1900–1910 average to facilitate comparison. The other lines displayed in the legend correspond to the results of six individual models, respectively.
4 Summary
The evolutions of the mode water and STCC changes are examined based on the historical and RCP4.5 runs of the six CMIP5 models over 400 years from 1900 to 2300. The evolutions consist of two distinct stages: A fast response stage where the ocean mixed layer dynamics are in quasi-equilibrium with the increasing GHG concentrations, and a slow response stage after the GHG has stabilized. As climate warms, the mode water (in particular, the North Pacific STMW and CMW) first shows a fast weakening response to the increasing GHG concentrations, and then a slow intensification adjusting to the stabilized GHG forcing. Corresponding to the mode water to the north, the STCC also shows the distinct fast and slow responses: As the GHG forcing increases rapidly in RCP4.5 from 2001 to 2070, the surface warming is intensified, and so is the upper ocean stratification, which causes the reduction of the mode water and the deceleration of the STCC. After the GHG forcing is stabilized in the 2070s, the subsurface warming is stronger than the surface warming, and the upper ocean stratification is reduced, leading to a small volume increase in the mode water and the strengthening of the STCC.
Although the existence of ocean’s fast and slow responses is well known (Stouffer, 2004), the effect on the MLD response and mode-water ventilation is not. The surface warming directly induced by the GHG increase shoals the MLD, while the gradual subsurface warming weakens the ocean stratification and deepens the MLD. The latter effect becomes more apparent after the GHG forcing is stabilized. The results of the CMIP5 models also show that the distinct MLD changes corresponding to the fast and slow responses can have important consequence to the mode water ventilation and the STCC.
Acknowledgements
This work is supported by the National Basic Research Program of China (2012CB955602), National Key Program for Developing Basic Science (2010CB428904), and Natural Science Foundation of China (41176006 and 40921004). The work was carried out when the first author was a visiting student at the University of Hawaii and Scripps Institution of Oceanography on a fellowship from the China Scholarship Council. We acknowledge the Working Group on Coupled Modelling of the World Climate Research Program. We also thank the climate modeling groups (listed in Table 1 of this paper) of CMIP for producing and making the model output available.
Aoki, Y., Suga, T., and Hanawa, K., 2002. Subsurface subtropical fronts of the North Pacific as inherent boundaries in the ventilated thermocline., 32: 2299-2311.
Held, I. M., Winton, M., Takahashi, K., Delworth, T., Zeng, F., and Vallis, G. K., 2010. Probing the fast and slow components of global warming by returning abruptly to preindustrial forcing., 23: 2418-2427.
Kobashi, F., and Kubokawa, A., 2012. Review on North Pacific subtropical countercurrents and subtropical fronts: Role of mode waters in ocean circulation and climate.,68: 21-43, DOI: 10.1007/s10872-011-0083-7.
Kobashi, F., Mitsudera, H., and Xie, S. P., 2006. Three subtropical fronts in the North Pacific: Observational evidence for mode water-induced subsurface frontogensis., 111, C09033, DOI: 10.1029/2006JC003479.
Kubokawa, A., 1999. Ventilated thermocline strongly affected by a deep mixed layer: A theory for subtropical countercurrent.,29: 1314-1333.
Kubokawa, A., and Inui, T., 1999. Subtropical countercurrent in an idealized ocean GCM.,29: 1303-1313.
Luo, Y., Liu, Q., and Rothstein, L. M., 2009. Simulated response of North Pacific Mode Waters to global warming.,36,L23609, DOI: 10.1029/2009GL 040906.
Stouffer, R. J., 2004. Time scales of climate response., 17: 209-217.
Taylor, K. E., Stouffer, R. J., and Meehl, G. A., 2012. An overview of CMIP5 and the experiment design., 93: 485-498, DOI: 10.1175/ BAMS-D-11-00094.1.
Xie, S. P., Kunitani, T., Kubokawa, A., Nonaka, M., and Hosoda, S., 2000. Interdecadal thermocline variability in the North Pacific for 1958–1997: A GCM simulation., 30: 2798-2813.
Xie, S. P., Xu, L., Liu, Q., and Kobashi, F., 2011. Dynamical role of mode water ventilation in decadal variability in the central subtropical gyre of the North Pacific., 24: 1212-1225.
Xu, L. X., Xie, S.-P., and Liu, Q., 2012a. Mode water ventilation and subtropical countercurrent over the North Pacific in CMIP5 simulations and future projections., 117, C12009, DOI: 10.1029/2012JC008377.
Xu, L. X., Xie, S. P., Liu, Q., and Kobashi, F., 2012b. Response of the North Pacific Subtropical Countercurrent and its variability to global warming., 68: 127-137, DOI: 10.1007/s10872-011-0031-6.
Yamanaka, G., Ishizaki, H., Hirabara, M., and Ishikawa, I., 2008. Decadal variability of the Subtropical Front of the western North Pacific in an eddy-resolving ocean general circulation model., 113, C12027, DOI: 10.1029/2008JC005002.
(Edited by Xie Jun)
10.1007/s11802-013-2189-6
ISSN 1672-5182, 2013 12 (2): 216-221
. Tel: 0086-532-66782556 E-mail: liuqy@ouc.edu.cn
(October 25, 2012; revised January 21, 2013; accepted March 4, 2013)
© Ocean University of China, Science Press and Springer-Verlag Berlin Heidelberg 2013
杂志排行
Journal of Ocean University of China的其它文章
- Relationships of Interannual Variability Between the Equatorial Pacific and Tropical Indian Ocean in 17 CMIP5 Models
- Influence of Summer Monsoon on Asymmetric Bimodal Pattern of Tropical Cyclogenesis Frequency over the Bay of Bengal
- Formation Mechanism for the Anomalous Anticyclonic Circulation over Northeast Asia and the Japan Sea in Boreal Winter 1997/98 and the Spring of 1998
- Recent Changes of Northern Indian Ocean Summer Rainfall Based on CMIP5 Multi-Model
- Asymmetric Response of the South China Sea SST to El Niño and La Niña
- Southern Ocean SST Variability and Its Relationship with ENSO on Inter-Decadal Time Scales
