Asymmetric Response of the South China Sea SST to El Niño and La Niña
2013-07-28HUANGZhuo1DUYan1WUYanling1andXUHaiming3
HUANG Zhuo1), 2), 3), DU Yan1), *, WU Yanling1), and XU Haiming3)
Asymmetric Response of the South China Sea SST to El Niño and La Niña
HUANG Zhuo, DU Yan1), , WU Yanling, and XU Haiming
1),,,510301,2),530022,3),,210044,
The interannual variability of the sea surface temperature (SST) in the South China Sea (SCS) is investigated according to its relationship with El Niño/La Niña (EN/LN) using monthly products from ICOADS. The SCS SST bears two peaks associated with EN/LN and shows the asymmetric features. Coinciding with the mature phase of EN/LN, the first SST warming/cooling peaks in December(0)–February(1) (DJF(1)) and centers in the southern part. The major difference is in the amplitude associated with the strength of EN/LN. However, the SCS SST anomaly shows distinct difference after the mature phase of EN/LN. The EN SST warming develops a mid-summer peak in June–August(1) (JJA(1)) and persists up to September–October(1), with the same amplitude of the first warming peak. Whereas the LN SST cooling peaks in May(1), it decays slowly until the end of the year, with amplitude much weaker. Comparing with SST and atmospheric circulations, the weak response and early termination of the second cooling is due to the failure of the cyclonic wind anomalies to develop in the northwest Pacific during JJA(1).
SST; South China Sea (SCS); El Niño/La Niña; asymmetric responses; interannual variability
1 Introduction
ElNiño-SouthOscillation(ENSO)isthedominantmode of interannual variability in the tropical region and induces a series of global extreme climate events. When the warming/cooling phase of ENSO occurs, the equatorialeastern Pacific SST turns warmer/cooler, with lower/higher pressure and weaker/stronger trade winds. However, the El Niño (EN) and La Niña (LN) events are not mirror images. The studied of ENSO identifies the asymmetry in amplitude and the phase evolution. EN is often stronger than LN, but the latter persists longer (Jin, 2003; An and Jin, 2004; McPhaden and Zhang, 2009). The nonlinear dynamic heating is regarded as the key to intensify EN but weaken LN (Jin, 2003; An and Jin, 2004; Dong, 2005).
ENSO has a remarkable impact on the South China Sea (SCS) (Xie, 2003; Liu, 2004; Wang, 2006). During the mature phase of EN/LN, the East Asian winter monsoon becomes weaker/stronger. During the summer following EN/LN, the SCS monsoon is usually weaker/stronger (Chen, 2002). ENSO affects the onset of the SCS summer monsoon, which occurs later/earlier in the decay year of EN/LN (Wu and Wang, 2000; Lau and Nath, 2009; Zhou, 2008). The SCS sea surface temperatures (SSTs) have dramatically changes, with two warming peaks in the winter of the EN developing year and in the following summer (Wang, 2006; Du, 2009), such as the warming event in 1998 (Wang, 2002). Interesting questions are how the SCS acts in the cooling event and whether there are important diffenrences between the cooling event and the warming event.
This study addresses the asymmetric effect of ENSO on the SCS SST. A major asymmetry is found in the second warming/cooling, both in phase and amplitude. Our analysis shows that the difference in the response of atmospheric circulation is likely a major cause.
2 Data and Methods
We use the monthly products from the International Comprehensive Ocean-Atmosphere Data Set (ICOADS) provided by NOAA on a 1˚ latitude×1˚ longitude grid for the period from January 1979 to December 2006. Since we focus on the interannual variability associated with ENSO, monthly anomalies are calculated relative to the climatology. The linear trend over this period is removed and the data is filtered for 4–84 months band-passing. The Hadley Centre Global Sea Ice and Sea Surface Temperature (HadISST) is used to obtain the Niño3.4 index, averaged over (120˚W–170˚W, 5˚N–5˚S). The Simple Ocean Data Assimilation (SODA, version 2.1.6) products are applied for exploring the SCS upper ocean circulation. A SCS transection with 22 grids at different latitudes is selected according to the availability of the ICOADS data. Considering that the interannual variability of the ocean dynamic process mainly occurs near the boundary of the SCS (Xie, 2003; Liu, 2004), the transection is selected as close to the South Vietnam coast as possible (Fig.1).
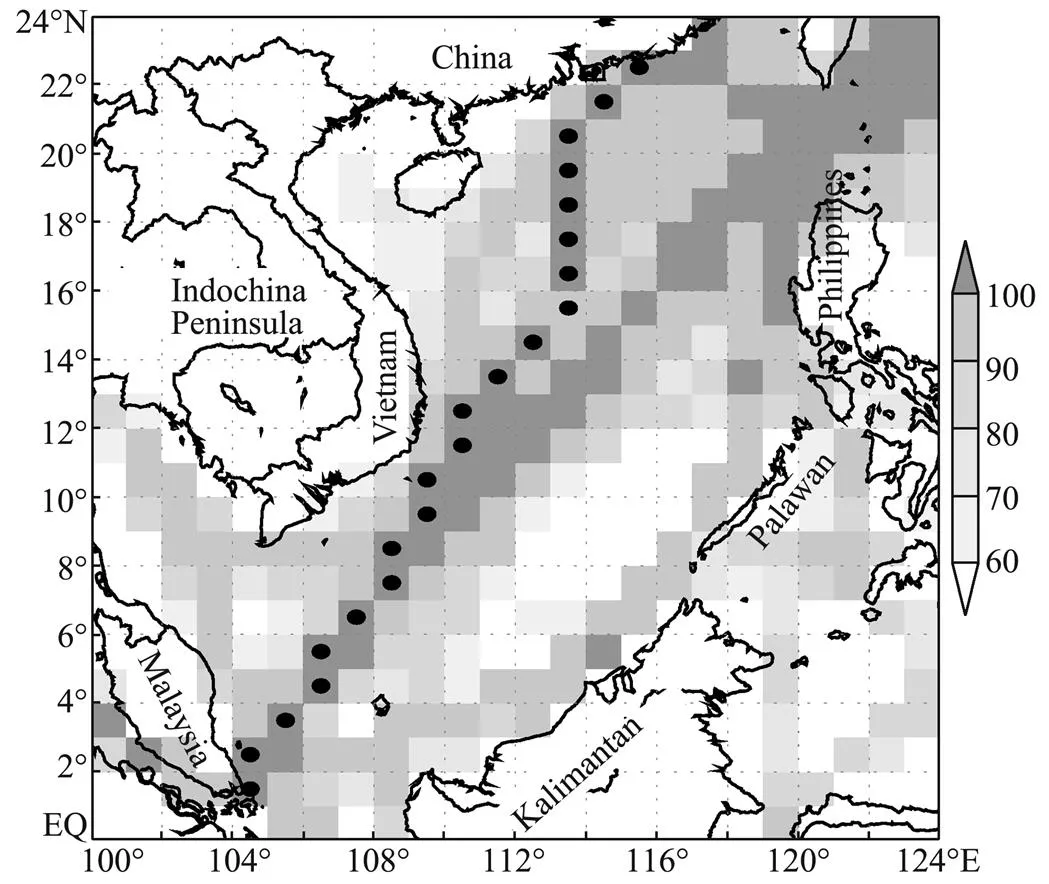
Fig.1 Distribution of ICOADS data and selected grids (closed circle) in SCS, shaded color showing the percentage of observation available (%).
Considering that the ICOADS dataset only provides latent heat parameterQ, the bulk formulas for latent heat flux (LHF) can be expressed as

,
whereρis the surface air density,Lthe latent heat of vaporization,Cthe transfer coefficient,the 10m wind speed, RH the relative humidity,qthe saturation specific humidity at the standard level,qthe saturation specific humidity at sea surface following the Clausius-Clapeyron equation,the gas constant for dry air,Rthe gas constant for water air,the pressure at sea surface,the relative humidity,Tthe surface temperature,the saturation vapor pressure at 273.16K, andthe constant. LHF can be divided into two parts, seasonal cycleand perturbation. The latter consists of the distinct atmospheric forcing and the oceanic response to the SST dependence on evaporation. The oceanic response may be cast as a Newtonian cooling term by linearizing the above bulk formula. Thus the LHF variability caused by the atmospheric forcing (AtF) is

which is mostly due to the wind speed, relative humidity, and air-sea temperature difference. Similar latent heat flux decomposition methods have been successfully used by many studies to study the SST changes caused by the atmospheric forcing (, de Szoeke, 2007; Du, 2009; Xie, 2010).
ENSO tends to be phase-locked to the seasonal cycle and its mature phase usually occurs in the boreal winter November-December-January (NDJ) (Trenberth, 1997). By taking 0.5℃ as the threshold of Niño3.4 NDJ index, eight warm events and nine cold events are revealed (Fig.2). The ENSO developing year is marked as year ‘(0)’, and the ENSO decaying year as ‘(1)’. Previous studies found that the SCS SST warms up twice, one in the mature phase of EN and the other in the following summer (Wang, 2006; Huang, 2009). With defining a new ‘year’ from October to September, the annual mean SST averaged along the transection is calculated from 1979 to 2006 (Fig.2). The figure clearly shows the SCS warming and cooling during the EN and LN events, respectively. Considering the impact of monsoon on the SST, the annual mean of wind speed anomalies is superimposed. The anomalous wind speed shows a negative relationship with SST, with a correlation coefficient of −0.84. The positive SST anomalies are accompanied by the negative wind anomalies, following the wind-evaporation-SST feedback (Xie and Philander, 1994).
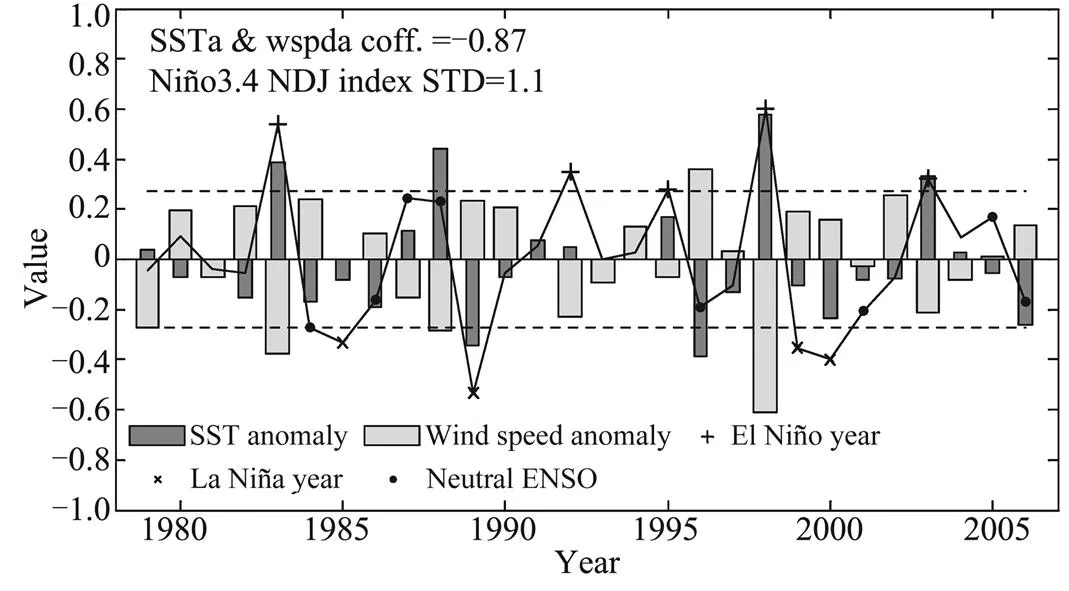
Fig.2 Annual mean (averaged from October to September) of SCS SSTa (dark bar, unit: ℃) and wind speed anomaly (light bar, unit: ms-1). Niño3.4 NDJ index (black line, detrended and divided by 4) is superimposed.
3 Results
3.1 General Feature
Considering the Niño3.4 index and local SST response in the SCS, we choose four significant EN/LN years for the composite analysis. The cases with weaker SST variations in the SCS during the ENSO have been neglected. Years 1982/1983, 1994/1995, 1997/1998, and 2002/2003 are selected for EN events and years 1988/1989, 1995/1996, 1999/2000, and 2005/2006 selected for LN. The effect of ENSO intensities are removed by dividing the each Niño3.4 NDJ index and multiplying its standard deviation. As shown in Fig.3, the SCS SSTa has double peaks in the mature and decay phases of ENSO.
The first SCS SST warming begins in October(0), and peaks in January(1). After the decay of EN in June(1), the SCS warms again with a peak in July–August(1) having an amplitude comparable to the first warming, and even stronger. The first cooling is the same as the first warming with comparable phase and amplitude. Without removing the effect of EN intensity, the first warming reaches 0.8℃, much stronger than the first cooling. With the fact of most EN being stronger than LN, the SCS SST variation depends on the ENSO intensity. The asymmetric response mostly appears in the second cooling, which peaks in May(1) with small amplitude. Besides, the variance of warming is smaller than that of cooling, implying more robust effect associated with EN.
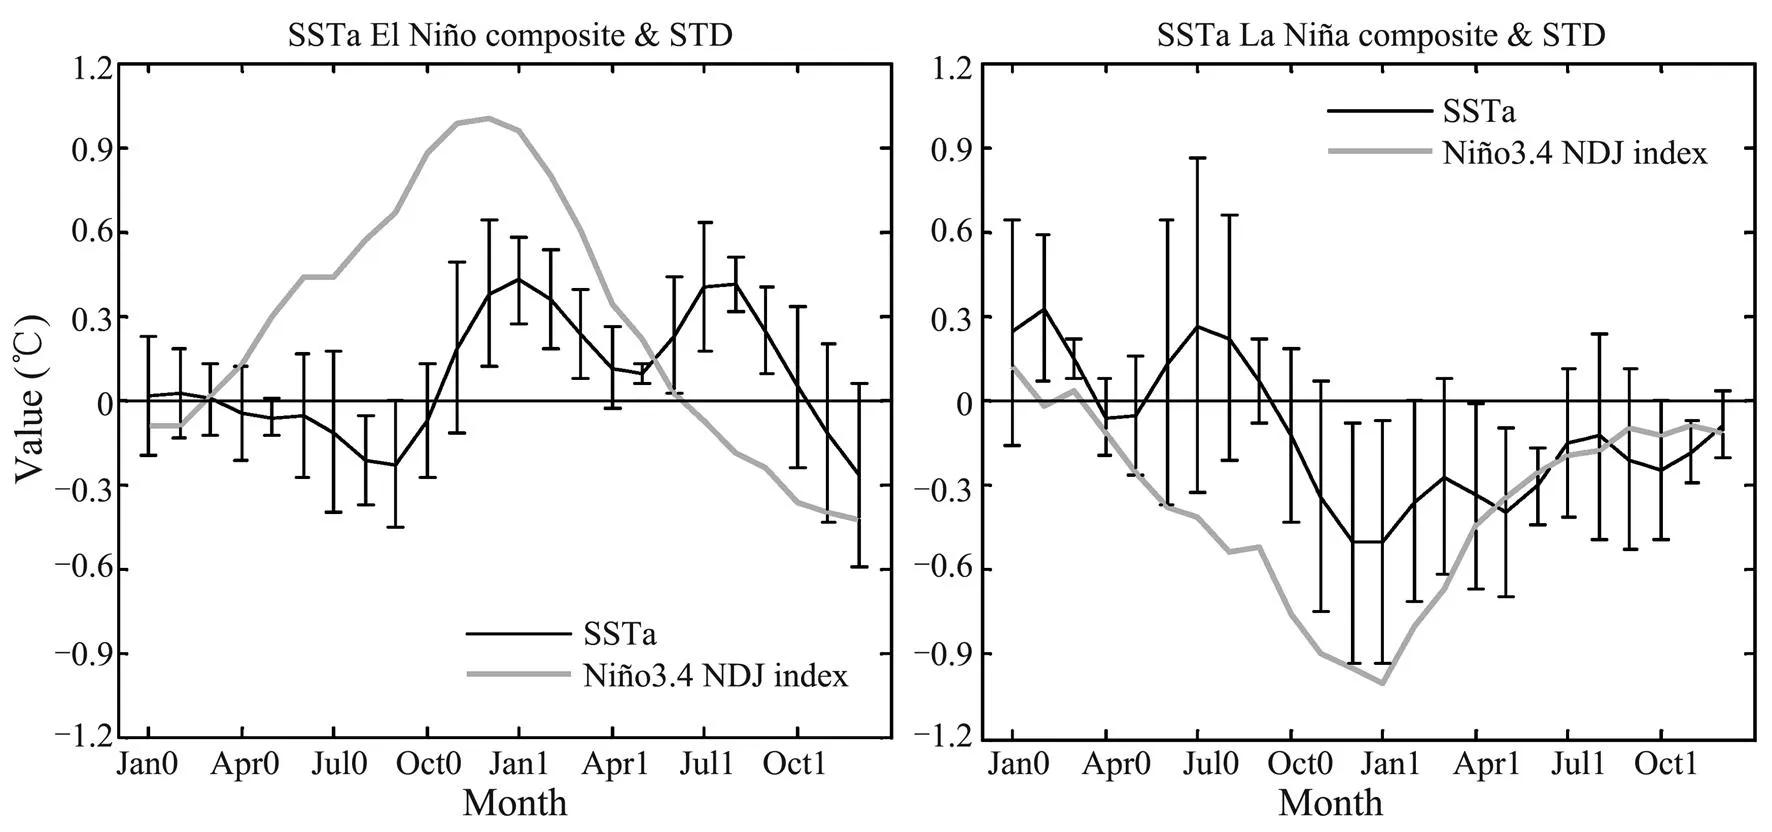
Fig.3 SSTa composite in the SCS (black line, from 3˚N to 20˚N, unit: ℃), standard deviation (error bar, unit:℃) and the normalized Niño3.4 index composite (grey line).
3.2 First Warming/Cooling
Month-latitude distributions of composites of SST, wind, cloudiness, and AtF are shown in Fig.4. In EN developing stage, the atmospheric adjustment, such as the off-equatorial anomalous anticyclone over the western North Pacific (WNPAC) (Wang, 2000; Wu, 2003; Wu, 2010a), slows down the SCS winter monsoon (Fig.4a) and suppresses the loss of latent heat (Fig.4b). The cloud cover is reduced to the minimum in Novem-ber(0) (Fig.4b), increasing the solar radiation. Those processes favor the SST warming. The SCS warming peaks one month lagging behind the cloudiness, for the reaction of the ocean to the atmosphere is usually slow. During LN, the above anomalies are opposite. The cloudiness increases momentously in December(0), benefiting the reduction of the radiation and the SCS cooling. The winds strengthen in November(0)–February(1). Both the increase in cloudi- ness and the intensitification in the winter monsoon over the SCS contribute to the decrease in SST.
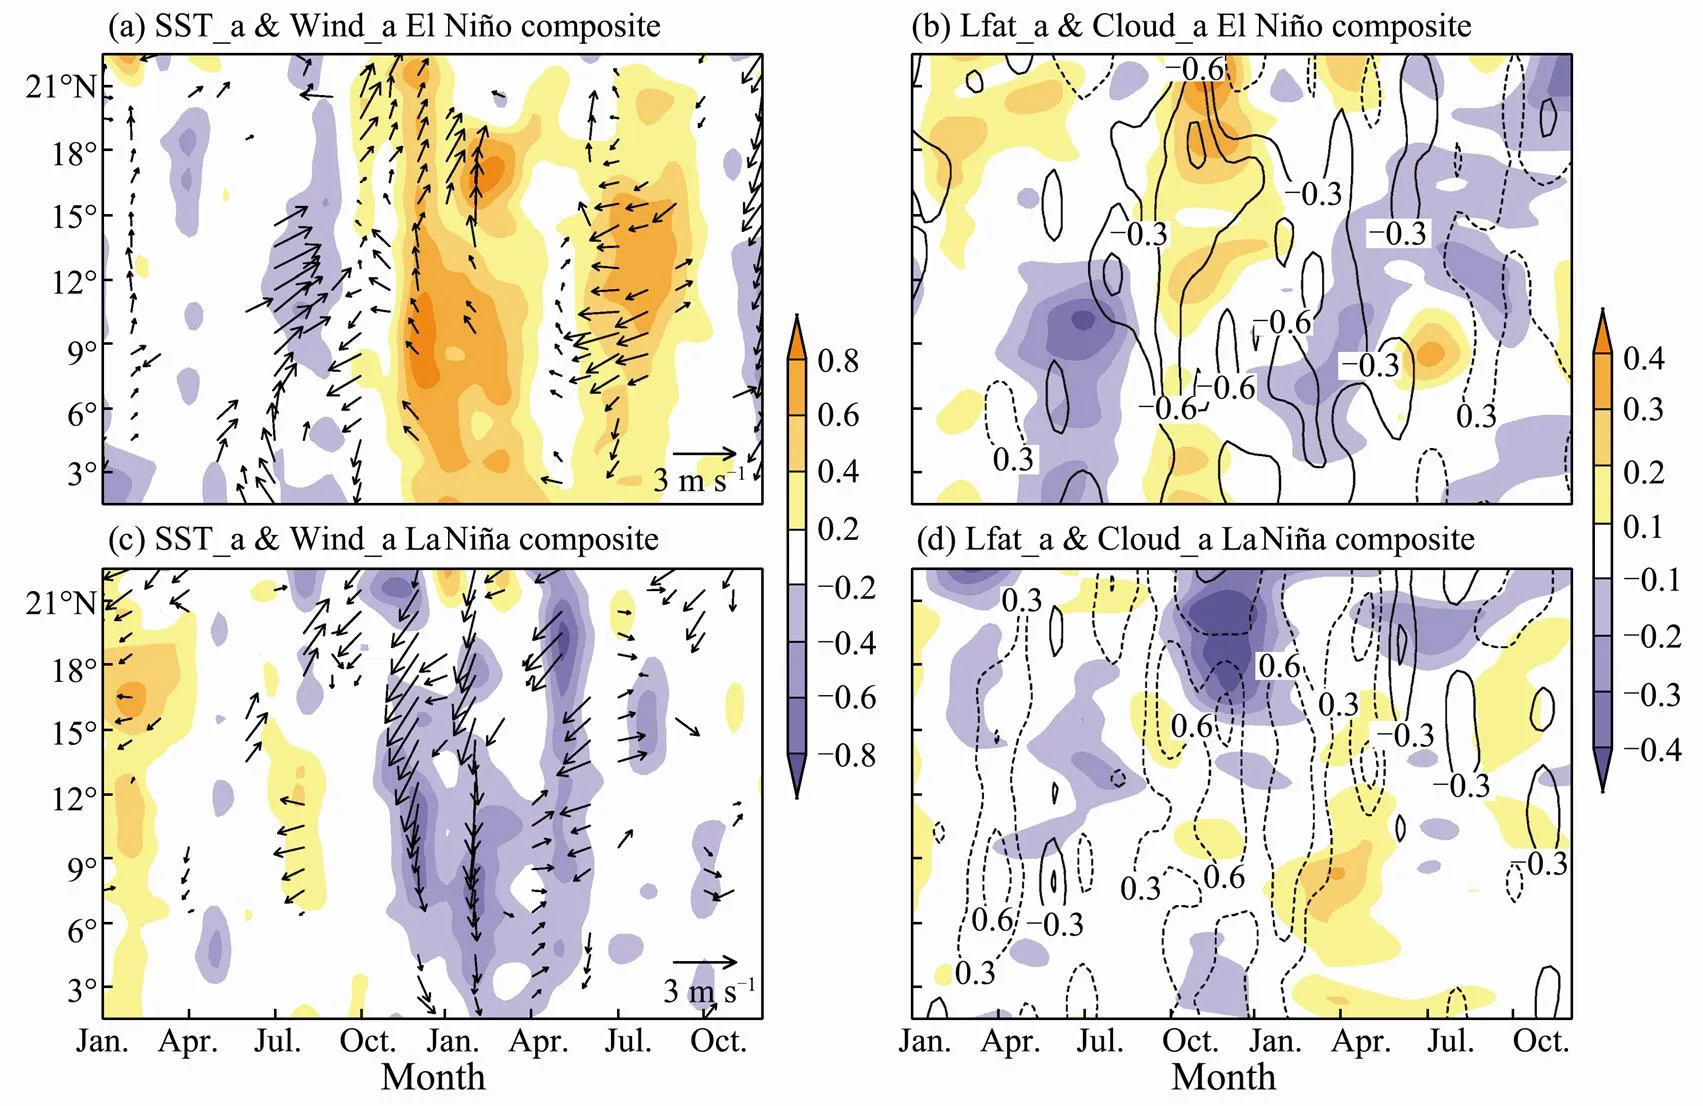
Fig.4 Composite of SCS atmospheric factors along north-south section. a. SCS SSTa (shaded, unit: ℃) and u, v components (vector, unit: ms-1, excluding wind speed<0.5) during EN; b. AtF (shaded, unit: (−102) Wm-2) and cloudiness (contour, unit: okta); c and d are the same as a and b but during LN, respectively.
Fig.4 shows that the SCS SST variation is smaller in the north than in the south, with large anomaly in the region south of Vietnam. The large SST variation in the south relates to the advection effect by the west boundary circulation, as demonstrated in the study by Liu(2004). Weakened/enhanced west boundary circulation inhabits the cold advection from the north during EN/LN, favoring the SST warming/cooling (Figs.5 and 6, Du and Qu, 2010). The additional dynamical effect, in addition to wind/evaporation and cloud/solar radiation, explains why SST variance maximum appears in the southern SCS in winter.
3.3 Second Warming/Cooling
During and after the decay of EN/LN, SCS SST bears a second warming/cooling. Regression and correlation analysis indicate that the change relates to indirect influence of ENSO through the capacitor effect of the Tropical Indian Ocean (Xie, 2009). Our composite analysis (Figs.4 and 7) confirms this point. Previous studies revealed the second warming related with the basin warming in the Indian Ocean (Xie, 2009; Du, 2009, 2011; Wu, 2010a; Wu and Yeh, 2010; Zheng, 2011). The change of cloud cover contributes to the increase/decrease of solar radiation in EN/LN. Weakened/enhanced easterlies decrease/increase the evaporation and favor the increase/decrease of SST anomaly, especially in the southern SCS. The change of SCS monsoon not only contributes to the change of evaporation and thus AtF, but also causes the change of ocean circulation and upwelling (Fig.6), which favor increasing/decreasing the SST during EN/LN, especially in the region southeast of Vietnam (Jing, 2011). Ocean dynamics contributes to the maximum variance of SST along the Vietnam coast in summer.
The phase and amplitude are different between the second warming and cooling. For the warming case, the basin wide warming in the tropical Indian Ocean (TIO) excites a tropospheric Kelvin Wave that propagates into the western Pacific. The Kelvin wave-induced surface divergence suppresses convection and induces an anomalous anticyclone over the northwest Pacific (Yang, 2007; Xie, 2009; Du, 2011). In the WNPAC exhibit abnormal easterlies over the SCS (Figs.8a and 8c). The local negative heating anomaly in the western North Pacific also contributes to the easterly anomalies in the late spring-early summer via stimulating an atmospheric Rossby wave and thus has impact on the WNPAC. The numerical experiments confirm that while the weakening of the local SSTa leads to a weakening of the WNPAC response, the remote TIO forcing strengthens from June to August (Wu, 2010b). For the cooling case, in the decay year of LN, the SCS SST decreases in March–April(1), and turns weak after May(1). Weak westerly form in southern SCS (Fig.7c). In the northern SCS, the wind anomaly is not clear and may not contribute to the SST cooling. In the large scale, the atmospheric circulation seems to have much noise and has no stable pattern. Especially, the cyclonic wind circulation and low sea level pressure anomalies are not found over the NWP (Figs.8b and 8d). Weak anomalies in LN JJA(1) are found in both the atmospheric circulation and SST, indicating their close relationship, which shows strong coupling in the warming case (Figs. 7, 8a and 8c).
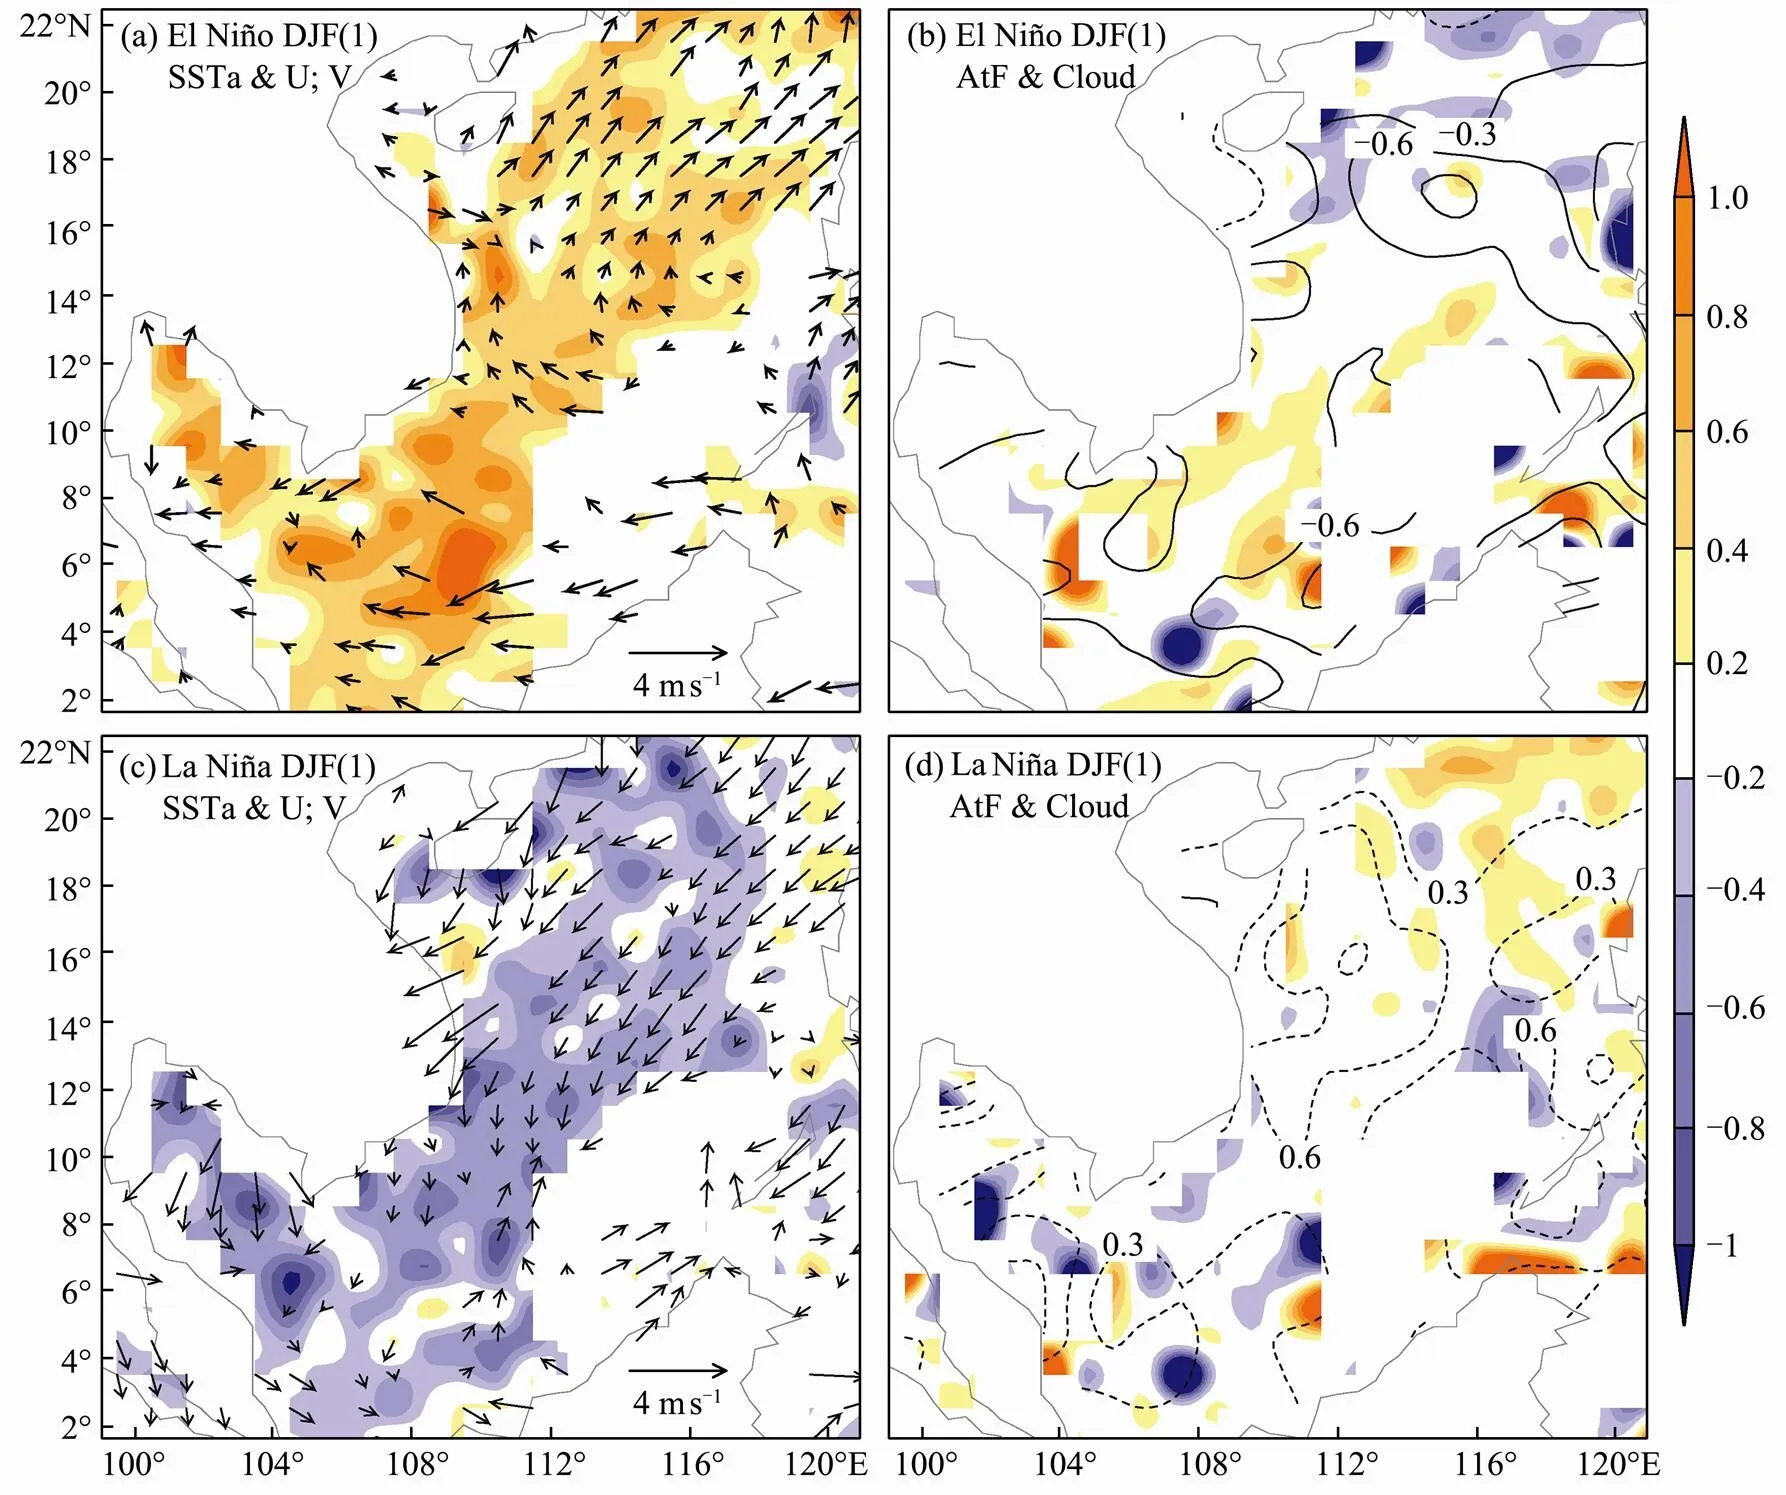
Fig.5 Composite of atmospheric factors. a. SCS SSTa (shaded, unit: ℃) and u, v component (vector, unit: ms-1, excluding wind speed<0.5) during EN DJF(1); b. AtF (shaded, unit: (−102) Wm-2), and cloudiness (contour, unit: okta); c and d are the same as a and b, but for the period of LN DJF(1).
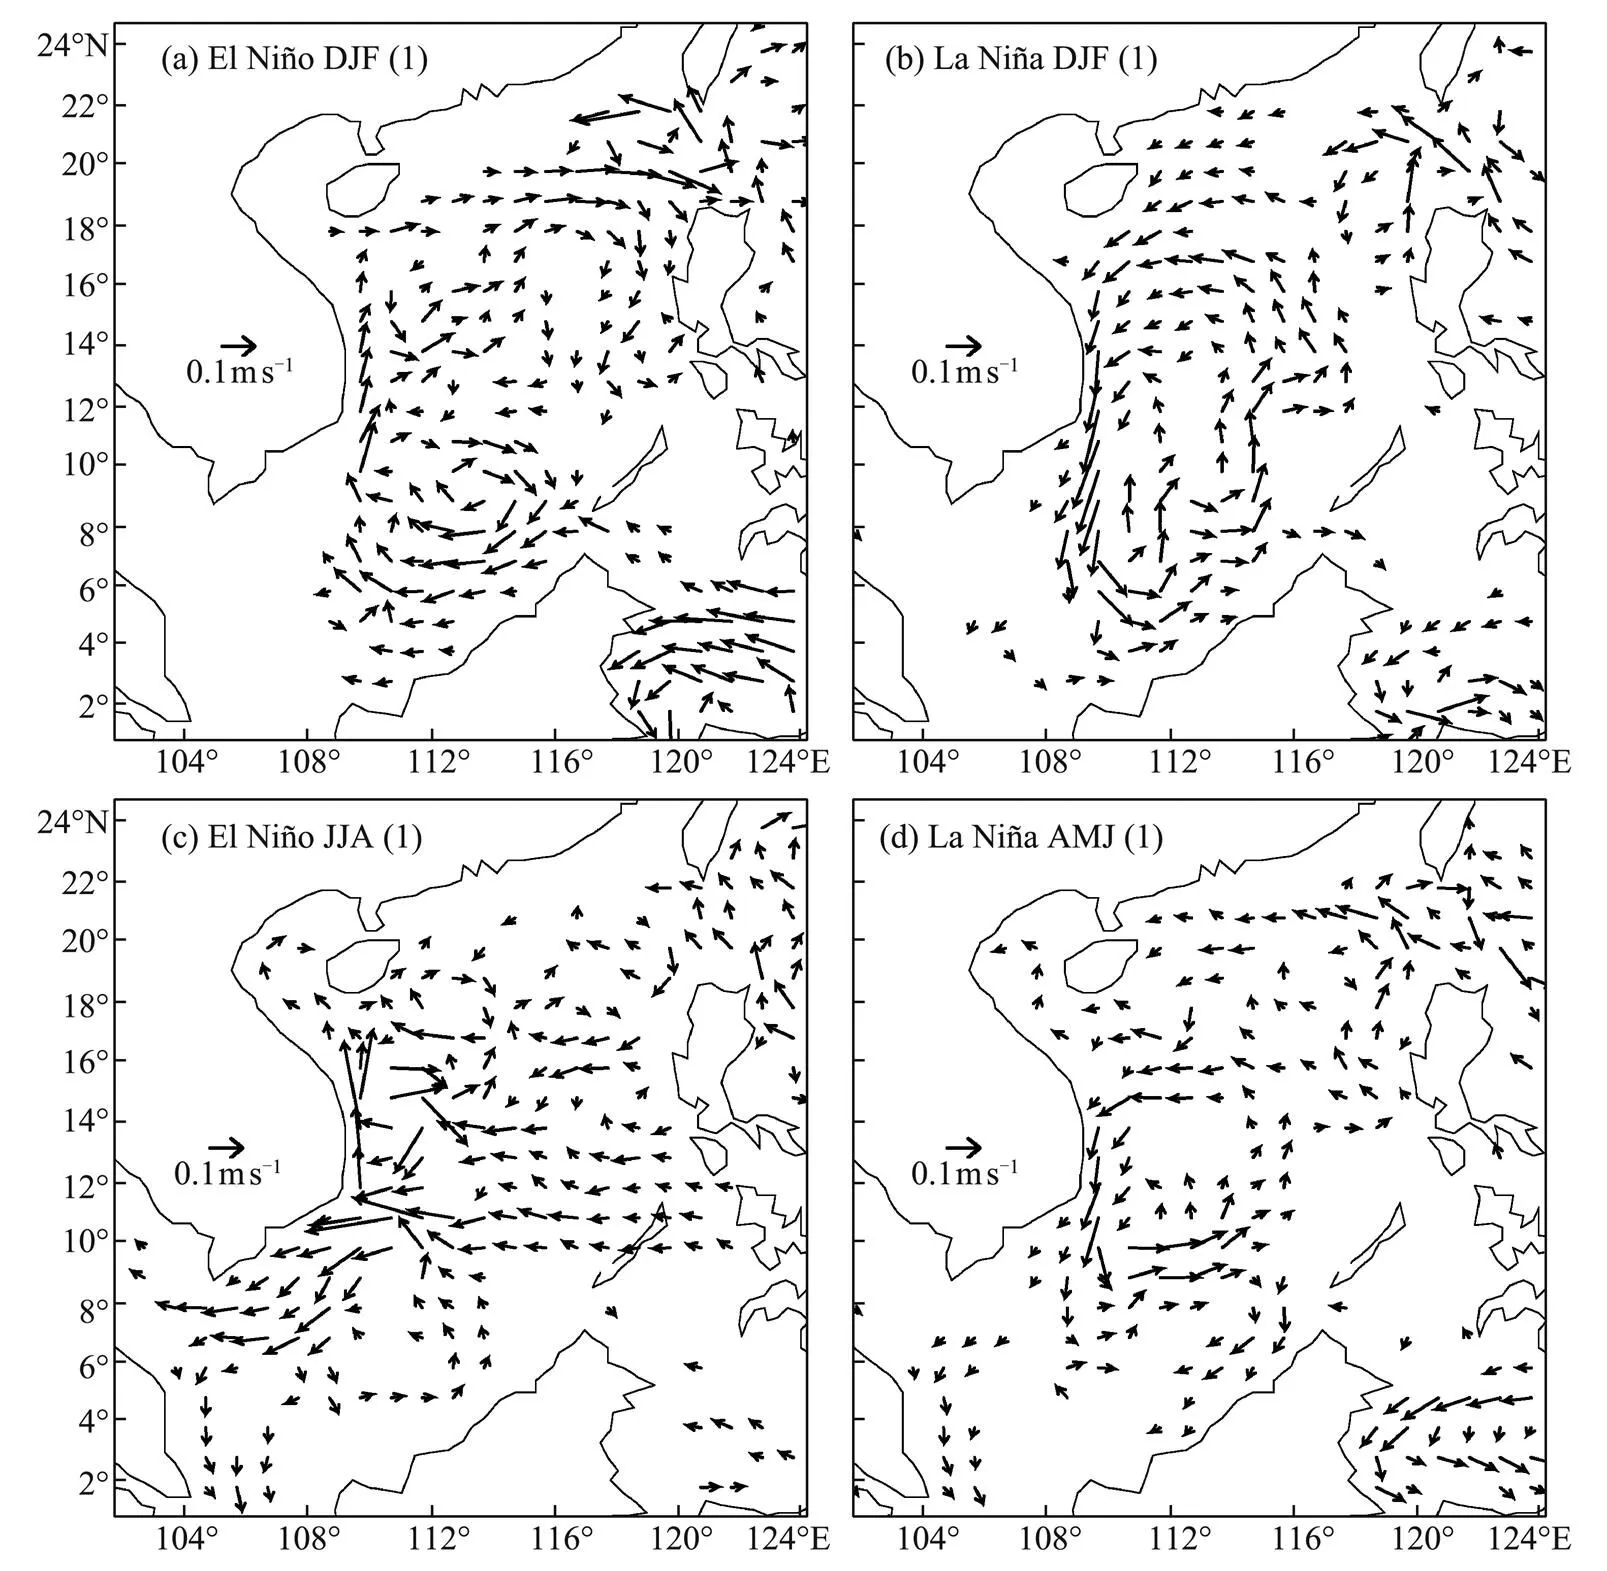
Fig.6 Surface anomaly current (in 5m depth; vector, unit: ms-1; excluded current speed<0.03) composite in the mature phase of ENSO DJF(1) and JJA(1)/AMJ(1). Left: EN; right: LN.
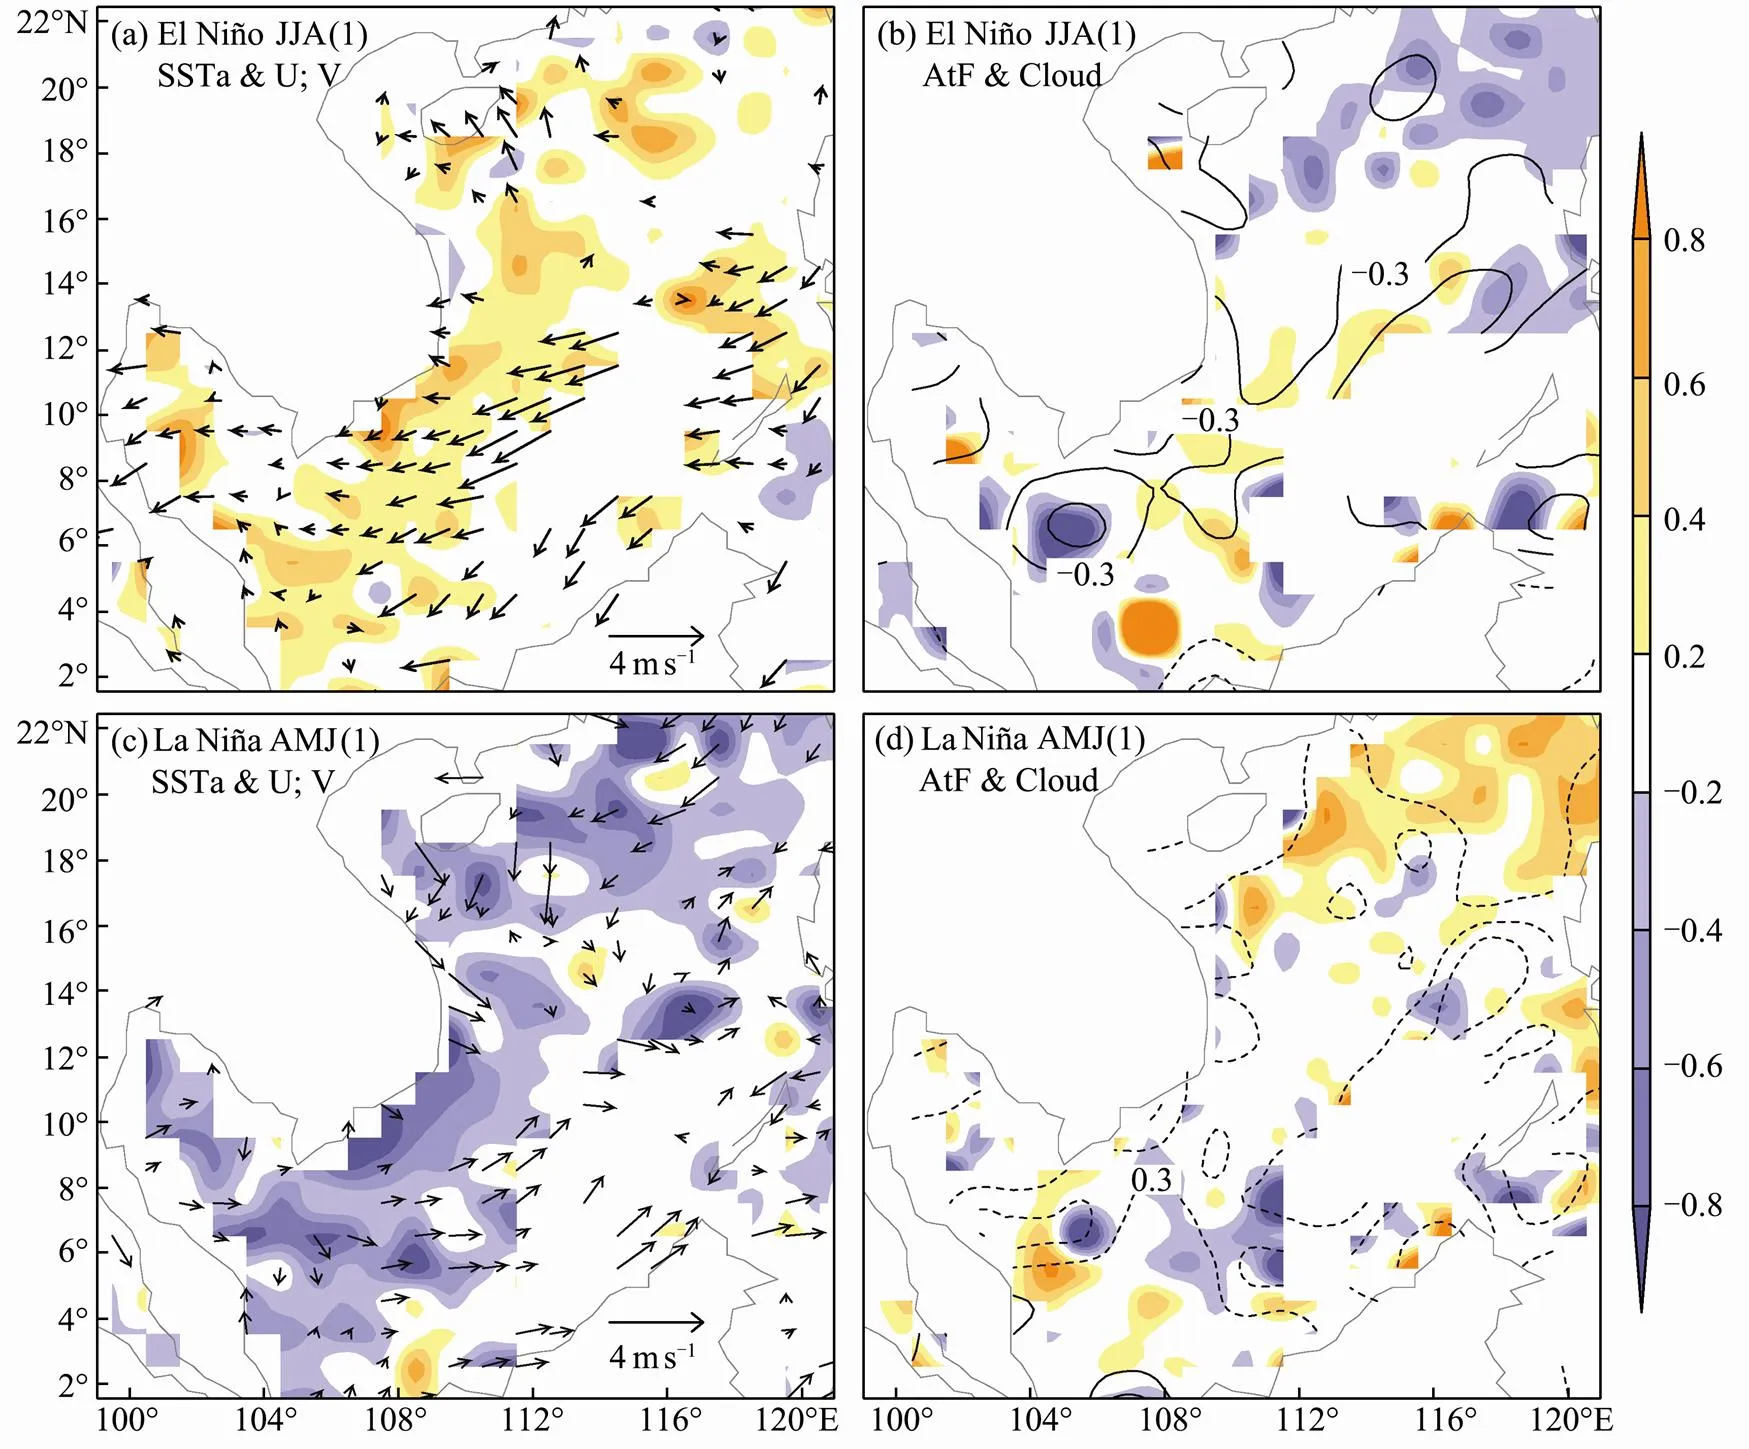
Fig.7 Same as Fig.5, but for the period of EN JJA(1) and LN AMJ(1), respectively.
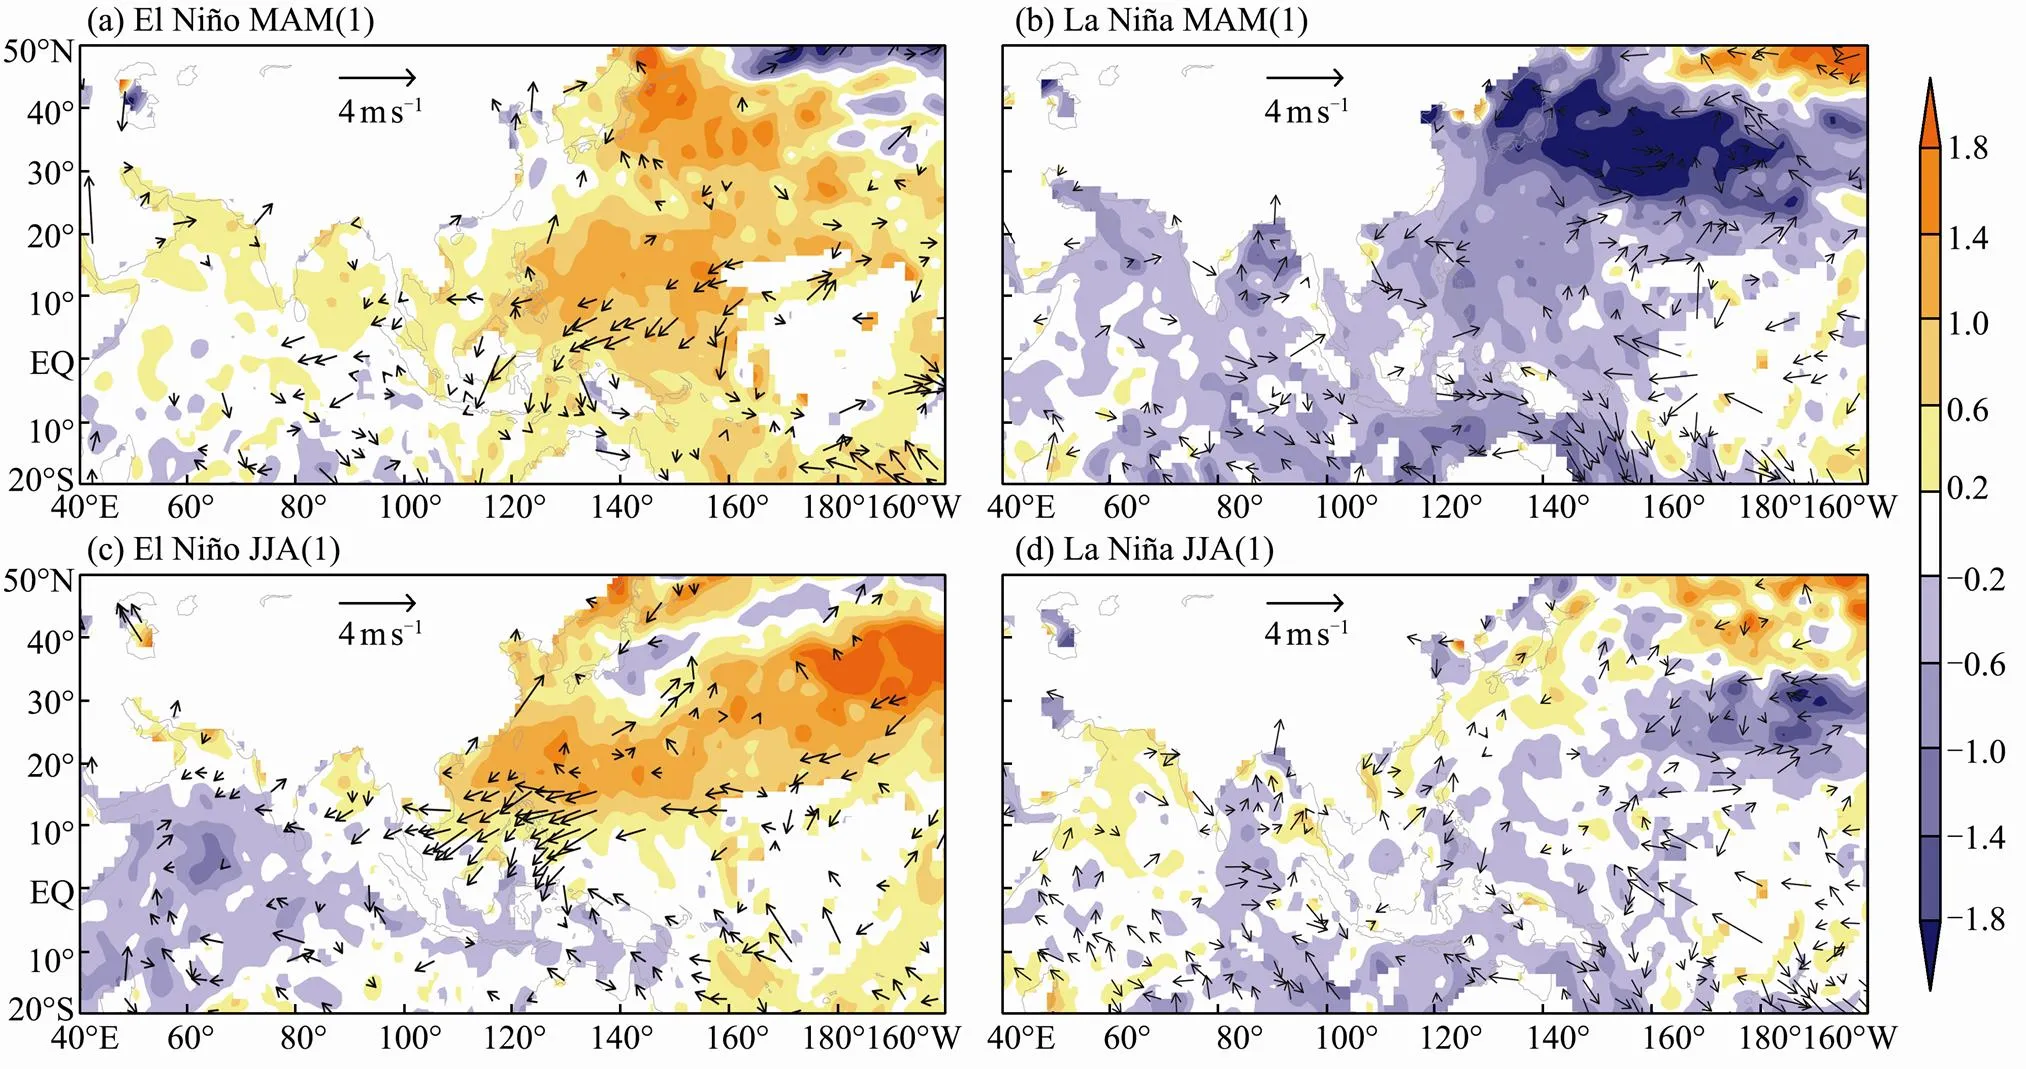
Fig.8 Composite of sea level pressure (shaded, unit: hPa) and wind (vector, unit: ms-1) anomaly in summer of EN (left) and LN (right) decay year. Top: MAM(1); bottom: JJA(1).
4 Summary and Discussion
This study investigates the processes associated with ENSO-induced warming and cooling in the SCS in the interannual time scale. ENSO affects the global ocean through the atmospheric bridges or teleconnections. As the South China Sea (SCS) locates between the western Pacific Ocean and eastern Indian Ocean, its interannual variation has two peaks, both of them related with ENSO, directly or indirectly. Based on the ICOADS surface observations, we discuss the asymmetric aspects of SCS SST warming/cooling during and after the EN/LN mature phase. Generally, the SCS SST variation associated with EN is more robust than the case associated with LN.
Considering the asymmetry intensity of the EN and LN, the ENSO has different effects on the atmospheric circulation. We choose the events with notable signals for composite analysis. The first warming and cooling occur during the mature phase of EN/LN, illustrating very similar pattern with different sign and different amplitude inherited from the EN/LN. During the EN mature phase, warming is caused by the anomalies of the winter monsoon, the cloudiness and the ocean circulation. For the asymmetry of EN and LN, the SCS does not show a significant cooling in every LN event. The results approve of Wang’s conclusion (Wang, 2006). The processes are quite different between the second warming and cooling. The second warming forms in May(1) and persists till September(1), while cooling forms in April(1) and decays after June(1). The amplitude of the second cooling is much weaker than that of the second warming. Our analysis confirms that the second warming/cooling is associated with the large scale atmospheric variation over the region, with different atmospheric circulations. The second warming is associated with the anticyclone wind circulation anomaly and high sea level pressure in JJA(1) in the NWP (Xie, 2009), which can explain the high correlation between the Indian Basin Mode and the Niño 3.4 SST index at 0.91with a 5-month lag (Yang, 2007). But the second cooling has no such atmospheric correspondence. The wind pattern over the SCS is noisy, and no cyclonic wind circulation develops over the NWP. The surface heat flux anomalies are considered as a major role by Wang’s study (Wang, 2006). The reason for this JJA(1) asymmetry is unclear but the noise level related with intraseasonal oscillation may be a factor. In the JJA(1) warming case, convection over the NW Pacific is reduced, and so is the atmospheric internal variability, allowing the TIO SST capacitor effect to be more strongly manifested than in JJA(1) cooling case.
Acknowledgements
This work is supported by the National Basic Research Program of China (2012CB955603, 2010CB950302), and the Chinese Academy of Sciences (XDA05090404, LT- 0ZZ1202).
An, S. I., and Jin, F. F., 2004. Nonlinearity and asymmetry of ENSO., 17: 2399-2412.
Chen, W., 2002. Impacts of El Niño and La Niña on the cycle of the east Asian winter and summer monsoon., 26 (5): 595-610.
de Szoeke, S. P., Xie, S. P., Miyama, T., Richards, K. J., and Small, R. J. O., 2007. What maintains the SST front north of the eastern Pacific equatorial cold tongue?, 20: 2500-2514.
Dong, B., 2005. Asymmetry between El Niño and La Niña in a global coupled GCM with an eddy-permitting ocean resolution., 18: 3373-3387.
Du, Y., and Qu, T., 2010. Three inflow pathways of the Indonesian throughflow as seen from the simple ocean data assimilation., 50 (2): 233-256, DOI: 10.1016/j.dynatmoce.2010.04.001.
Du, Y., Xie, S. P., Huang, G., and Hu, K. M., 2009. Role of air-sea interaction in the long persistence of El Niño-induced North Indian Ocean warming., 22: 1424-1445.
Du, Y., Yang, L., and Xie, S. P., 2011. Tropical Indian Ocean influence on Northwest Pacific tropical cyclones in summer following strong El Niño., 24: 315-322.
Huang, Z., Xu, H. M., Du, Y., and Xie, Q., 2009. Two sea surface temperature warming events during and after El Niño in the South China Sea., 28 (5): 49-55.
Jin, F. F., An, S. I., Timmermann, A., and Zhao, J., 2003. Strong El Niño events and nonlinear dynamical heating., 30 (3), 1120, DOI: 10.1029/2002GL016356.
Jing, Z., Qi, Y., and Du, Y., 2011. Upwelling in the continental shelf of northern South China Sea associated with 1997–1998 El Niño., 116: C02033, DOI: 10.1029/2010JC006598.
Lau, N. C., and Nath, M. J., 2009. A model investigation of the role of air-sea interaction in the climatological evolution and ENSO-related variability of the summer monsoon over the South China Sea and western North Pacific., 22: 4771-4792.
Liu, Q. Y., Jiang, X., Xie, S. P., and Liu, W. T., 2004. A gap in the Indo-Pacific warm pool over the South China Sea., 109: C07012, DOI: 10.1029/2003JC002179.
McPhaden, M. J., and Zhang, X. B., 2009. Asymmetry in zonal phase propagation of ENSO sea surface temperature anomalies., 36: L13703, DOI: 10.1029/ 2009GL038774.
Trenberth, K. E., 1997. The definition of El Niño., 78: 2771-2777.
Wang, B., Wu, R. G., and Fu, X. H., 2000. Pacific-East Asian teleconnection: How does ENSO affect East Asian climate?, 13: 1517-1536.
Wang, Q., Xie, Q., Du, Y., Wang, W., and Chen, J., 2002. The 1997–1998 warm event in the South China Sea., 47 (14): 1221-1227.
Wang, C. Z., Wang, W. Q., Wang, D. X., and Wang, Q., 2006. Interannual variability of the South China Sea associated with El Niño., 113: C03023, DOI: 10.1029/2005JC003333.
Wu, B., Li, T., and Zhou, T., 2010a. Asymmetry of atmospheric circulation anomalies over the Western North Pacific between El Niño and La Niña., 23: 4807-4822, DOI: 10.1175/2010JCLI3222.1.
Wu, B., Li, T., and Zhou, T., 2010b. Relative contributions of the Indian Ocean and local SST anomalies to the maintenance of the Western North Pacific anomalous anticyclone during the El Niño decaying summer., 23: 2974-2986, DOI: 10.1175/2010JCLI3300.1.
Wu, R. G., and Wang, B., 2000. Interannual variability of summer monsoon onset over the Western North Pacific and the underlying processes., 13: 2483-2501.
Wu, R. G., and Yeh, S. W., 2010. A further study of the tropical Indian Ocean asymmetric mode in boreal spring., 115: D08101, DOI: 10.1029/2009JD-012999.
Wu, R. G., Hu, Z. Z., and Kirtman, B. P., 2003. Evolution of ENSO-related rainfall anomalies in East Asia., 16: 3741-3757.
Xie, S. P., and Philander, S. G. H., 1994. A coupled ocean–atmosphere model of relevance to the ITCZ in the eastern Pacific., 46A: 340-350.
Xie, S. P., Deser, C., Vecchi, G. A., Ma, J., Teng, H., and Wittenberg, A. T., 2010. Global warming pattern formation: Sea surface temperature and rainfall., 23: 966-986.
Xie, S. P., Hu, K. M., Jan, H., Tokinaga, H., Du, Y., Huang, G., and Sampe, T., 2009. Indian Ocean capacitor effect on Indo-western Pacific climate during the summer following El Niño., 22: 730-747.
Xie, S. P., Xie, Q., Wang, D. X., and Liu, W. T., 2003. Summer upwelling in the South China Sea and its role in regional climate variations., 108 (C8), 3261, DOI: 10.1029/2003JC001867.
Yang, J. L., Liu, Q. Y., Xie, S. P., Liu, Z. Y., and Wu, L. X., 2007. Impact of the Indian Ocean SST basin mode on the Asian summer monsoon., 34: L02708, DOI: 10.1029/2006GL028571.
Zheng, X. T., Xie, S. P., and Liu, Q. Y., 2011. Response of the Indian Ocean basin mode and its capacitor effect to global warming., 24: 6146-6164, DOI: 10.1175/2011JCLI4169.1.
Zhou, T., Yu, R., Li, H., and Wang, B., 2008. Ocean forcing to changes in global monsoon precipitation over the recent half century., 21 (15): 3833-3852.
(Edited by Xie Jun)
10.1007/s11802-013-2169-x
ISSN 1672-5182, 2013 12 (2): 272-278
. Tel: 0086-20-89023180 E-mail:duyan@scsio.ac.cn
(October 16, 2012; revised November 26, 2012; accepted February 5, 2013)
© Ocean University of China, Science Press and Springer-Verlag Berlin Heidelberg 2013
杂志排行
Journal of Ocean University of China的其它文章
- Relationships of Interannual Variability Between the Equatorial Pacific and Tropical Indian Ocean in 17 CMIP5 Models
- Influence of Summer Monsoon on Asymmetric Bimodal Pattern of Tropical Cyclogenesis Frequency over the Bay of Bengal
- Formation Mechanism for the Anomalous Anticyclonic Circulation over Northeast Asia and the Japan Sea in Boreal Winter 1997/98 and the Spring of 1998
- Recent Changes of Northern Indian Ocean Summer Rainfall Based on CMIP5 Multi-Model
- Subtropical Air-Sea Interaction and Development of Central Pacific El Niño
- Southern Ocean SST Variability and Its Relationship with ENSO on Inter-Decadal Time Scales
