Improvements of model-test method for cavitation-induced pressure fluctuation in marine propeller*
2013-06-01LEEJeungHoonHANJaeMoonPARKHyungGilSEOJongSoo
LEE Jeung-Hoon, HAN Jae-Moon, PARK Hyung-Gil, SEO Jong-Soo
Samsung Ship Model Basin (SSMB), Marine Research Institute, Samsung Heavy Industries, Science Town, Daejeon 305-380, Korea, E-mail: jhope.lee@samsung.com
Improvements of model-test method for cavitation-induced pressure fluctuation in marine propeller*
LEE Jeung-Hoon, HAN Jae-Moon, PARK Hyung-Gil, SEO Jong-Soo
Samsung Ship Model Basin (SSMB), Marine Research Institute, Samsung Heavy Industries, Science Town, Daejeon 305-380, Korea, E-mail: jhope.lee@samsung.com
(Received November 17, 2012, Revised March 15, 2013)
Although the prediction of propeller cavitation-induced pressure fluctuation strongly depends on the model-scale measurement in a cavitation tunnel, there is still a lack of correlation with full-scale data. This paper deals with the enhancement of such a correlation deficiency by improving the conventional model-test technique, two majors of which are in the following. One is to take into account the boundary layer effect of wooden fairing plate at the ceiling of water cavitation tunnel. The other is to avoid the resonance frequency range of model-ship via adjusting the revolution speed of model propeller. Through a case study, for which both model and full-scale test data are available, the improved method in this study shows its validness, and furthermore a close correlation with full scale measurement.
cavitation, boundary layer, resonance
Introduction
Marine propellers operating in the non-uniform wake field experiences a fluctuation of inflow velocity, resulting in periodic occurrences of cavitation[1], and consequently hull excitation at the orders of blade rate frequency. Due to its violent and implosive process[2,3], propeller cavitation is treated as the main source of noise and vibration in ship structures. To prevent or control this harmful effect, various prediction methods for the unsteady cavitation and its provoked pressure fluctuation have been investigated extensively. But analytical and numerical approaches[4,5]are still laborious to achieve sufficient accuracy because of the complexity of cavitation phenomena. Thus prediction of cavitation-induced pressure fluctuation mostly depends on the model-scale measurement in cavitation tunnels. In this case, yet, a close correlation between full- and model-scales is a prerequisite.
Much of work for the correlation improvement was already conducted by several authors. For the container vessel “Sydney Express”, wherein both fulland model-scale data are available, the cavitation characteristics in several test facilities were discussed with the different factors, i.e., mainly nuclei content, the flow quality of test section and the scale effects[6]. Recently, Schuiling et al.[7]focused on a difference on the wake characteristics between full- and model-scales, and proposed a “smart dummy” concept, a geometrically non-similar ship model with full-scale wake field resemblance.
Up to now, we have accumulated over several cases of pressure fluctuation measurements in full scale, which are summarized in Table 1. For the cases of crude oil tanker, we could have a good correlation between full- and model-scales. But the model-scale measurement for container-vessels consistently overpredicts the pressure-amplitude by several tens of percent. In more detail, it becomes large as the mounting draught decreases, and as the RPM of model propeller increases. It is noteworthy that the over-prediction moderates for further increases of model propeller RPM.
Although there might be several influential factors treated in previous researches, such as air contents and scale-effects, two major considerations have been made by referring the results in Table 1.
First, uniformity of velocity distribution was studied under the empty-tunnel configuration, which revealed the existence of boundary layer arisen from thewooden fairing plate necessarily employed for a suppression of the free water surface. For the cases of container vessels possessing a shallow draught rather than crude-oil tankers, thus, the boundary layer effect tends to be apparent in propeller disk of the model ship. Hence the first strategy for the correlation enhancement was to immerse the model-ship deeper than its scaled design draught so that the boundary layer effect of wooden fairing plate can be minimized in the area of propeller disk.

Table 1 Model test history and comparison with full-scale hull pressure amplitude
Second, the increase of prediction error for a specific range of model propeller RPM encouraged the authors to consider the resonance characteristics associated with model-ship. If the rotational speed of model-propeller places within resonance frequency ranges of model-ship, excessive vibration induces unsteady pressure around the hull-surface. Thus, measured pressure amplitude is able to exhibit an abnormally amplified value. An appropriate selection method for the propeller RPM, therefore, was proposed as avoiding the resonance frequencies of model-ship. The influence of hull vibration on the measured pressure amplitude were already elaborated in previous researches, which were well-summarized in ITTC report[8]. Thus, one needs to consider its significance to improve the correlation deficiency.
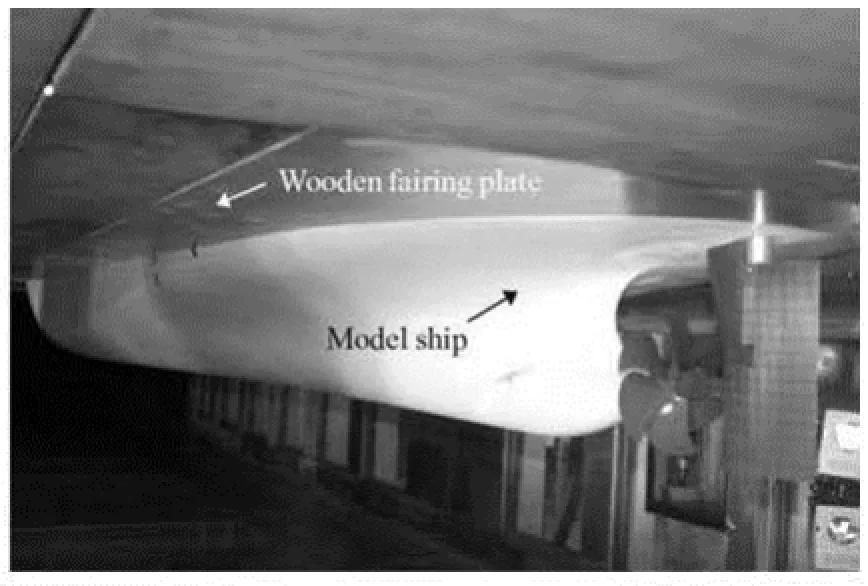
Fig.1 Complete model ship mounted in the water cavitation tunnel of Samsung Ship Model Basin (SSMB): Wooden fairing plates are installed between the tunnel wall and the model ship
1. Two considerations for correlation enhancement
1.1 Influences of the boundary layer of wooden fairing plate
As is shown in Fig.1 depicting the model-ship mounted in the cavitation tunnel, wooden fairing plates are positioned between the tunnel wall and the model ship at the height corresponding to the scaled draught to suppress free water surface. However, boundary layer arisen from the plate may distort the wake quality in the propeller plane. Thus, it is necessary to ensure the uniformity of the velocity distribution in the water tunnel. To this end, measurement of velocity profile was conducted under the configuration of empty tunnel condition. For reference, the empty tunnel refers that wooden plates entirely covers the ceiling of the tunnel, while the model-ship was removed from the tunnel.
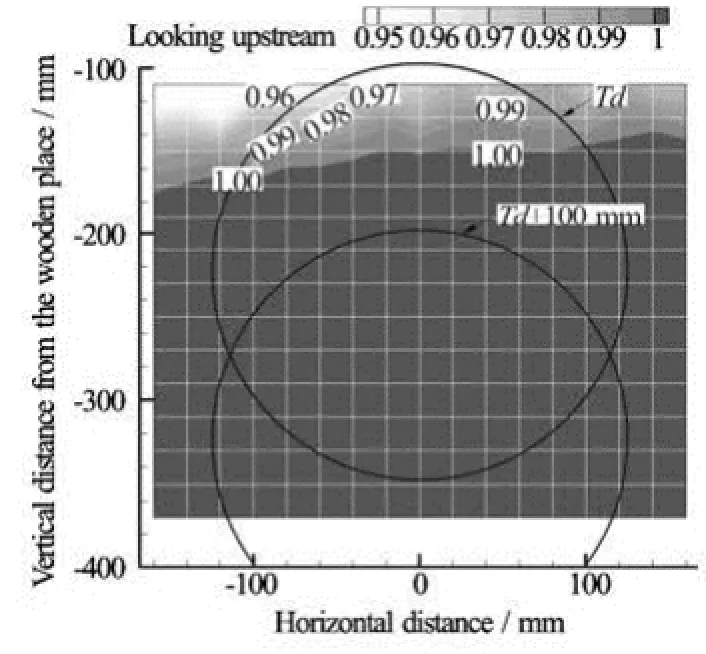
Fig.2 Axial velocity distribution at the propeller plane for an empty tunnel configuration. Values were normalized by inflow velocity 7.5 m/s. The circles depict the area of propeller disk at a specific mounting draught of modelship
Figure 2 shows the axial velocity measurement at the propeller plane, which was made by a pitot-tube system. Although uniform velocity distribution below 150 mm from the ceiling is clearly visible, tardy velocity region around ceil comes to appear due to theboundary layer interference of the wooden plates. When the propeller area of the model ship is located within the region of boundary layer, the decreased inflow velocity would result in the increase of angle of attack, and subsequently the increase of pressure fluctuation.
Circle depicted with “dT” in Fig.2 shows the model-scale propeller disk of the interested container ship. One can observe the existence of boundary layer around the top region of propeller area, where the cavitation occurs predominantly. This is also the cases for the other types of container-vessels because of similar draught specification. Thus, the model-ship needs to be installed at deeper draught than the actual one for keeping away from the boundary layer and for a desirable pressure measurement.
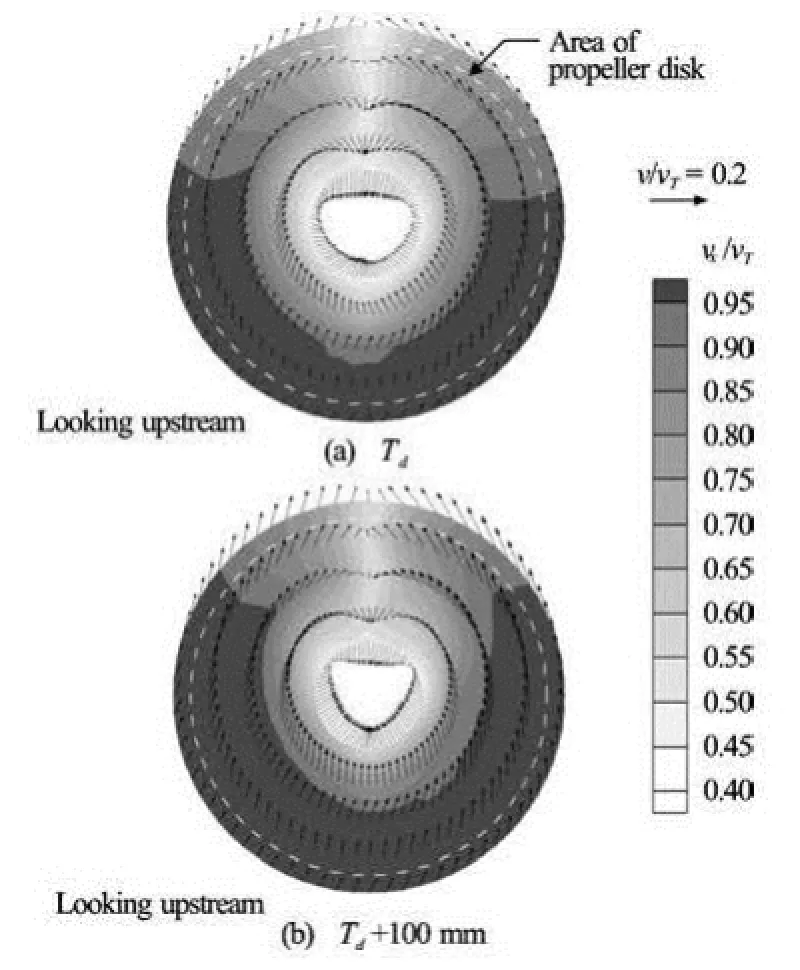
Fig.3 Nominal wake measurements for two different mounting conditions of model-ship. Values were normalized by inflow velocity 7.5 m/s
To confirm the boundary layer effect in the area of propeller disk, the model-ship without the propeller was set up in the cavitation tunnel for the following two conditions of mounting draught: (1) original design draught (Td), (2) Td+100mm . Then the nominal wake measurements were conducted for each mounting condition. As is shown in Fig.3, the value around wake peak zone (i.e., top region of the propeller disk) for a deeper mounting draught increases because the influence of boundary layer is diminished. Based on these measurements, we can see the boundary layer effect in the propeller disk once again.
1.2 Influences of a resonance of model-ship
Both the thrust coefficienttK and the cavitation numbernσ are the non-dimensional numbers to be satisfied for the cavitation test

where T denotes the thrust force of propeller, ρ the density of water, n the rate of revolution of propeller (rps), D the diameter of propeller,ap the atmospheric pressure, g the gravitational acceleration, h the vertical distance between the water surface and the center of propeller, andyp the vapor pressure depending on temperature. To reach the propulsion point, the water flow speed in the tunnelTV as well as the propeller rps n can be controlled to yield the desired thrust coefficient on the basis of thrust identity. After achieving the thrust identity, the tunnel was depressurized to satisfy the prescribed cavitation number.
In achieving the desired thrust coefficient, yet, infinite number of combinations forTV and n are theoretically available. Practically, the flow speed is firstly specified by considering the capabilities of water tunnel as well as the type of vessel under testing. For example, the flow speed is kept as 7.5 m/s for the container-vessels. Then rotational speed of modelpropeller can be determined accordingly. When one of the resonance frequencies of model-ship coincides with the propeller speed, however, an excessive vibration of ship-hull would impose an abnormal amplification of measured pressure amplitude as stated in Introduction. Obviously, the rotational speed of model-propeller should be chosen so that the resonance frequencies of model-ship are avoided. Following sub-sections describe available methods for an identification of the resonance frequencies.
1.2.1 Motor RPM run-up test
As one of the excitation methods for vibration modal testing, one can exploit the propeller driving motor as a vibration source[9]. Owing to the unbalance mass inside motor causing the rotational frequencyand its harmonic-components, the natural mode can be excited while increasing (or decreasing) the motor RPM within the interested frequency range. The frequency of local vibration rising, therefore, can be exploited as an evidence of resonance.
In this study, the water-proof accelerometer (Model: B&K 5958A) for vibration measurement was mounted on the model ship around the location of pressure measurement as shown in Fig.4. The hub with disassembled propeller blades, i.e., dummy hub, was also installed for a prevention of cavity-induced hull excitation. Except the propeller, the boundary conditions were configured to be exactly the same as the one of actual pressure measurement.

Fig.4 Water-proof accelerometer (Model:B&K 5958A) mounted on model-ship
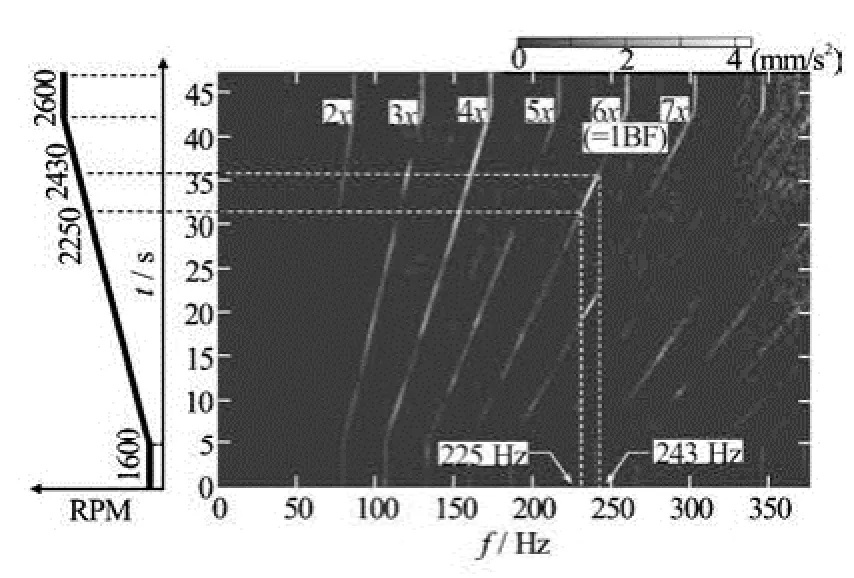
Fig.5 Vibration measurement for motor RPM run-up test; Local increase of vibration between 225 Hz and 243 Hz gives an indication of resonance
Then, the motor RPM was linearly increased from 1 600 to 2 600 during 40 s. Vibration measurement as shown in Fig.5 is represented with three-dimensional plot of frequency versus time, where contour coloring depicts the magnitude of vibration component. Excluding the rotational rate (1)x, other harmonic components up to the seventh were clearly observed. Several resonance frequencies can be found from the results. Specifically, the first blade frequency value (6xharmonics) shows a enlargement in the frequency range between 225 Hz and 243 Hz, where the presence of resonance is suspected. Even though exact frequency point of resonance is not fully identified within that range, the results provide a sufficient clue for selection of propeller RPM. Further analysis with zoom-transform technique[10]would give a frequency detail rather than the range, which will not be treated in this study.
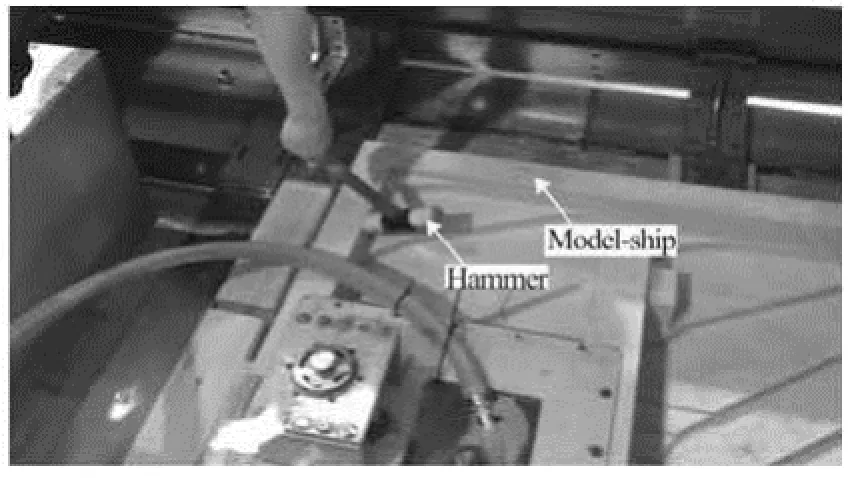
Fig.6 Hitting the model-ship for the impact-test. Although the top-hatch lid of tunnel is remained as opened for a excitation of the hull, the ship is fully immersed in the water to maintain the boundary condition as much as possible
1.2.2 Impact test
Because the impact-like signal in time-domain corresponds to a white-noise in the frequency domain, the impact scheme was also employed for an excitation method for modal testing[11]. On the contrary to the motor RPM run-up, the cumbersome of dummyhub installation could be relieved. However, hitting the model-ship as shown in Fig.6 should be conducted only under the condition of opening the top-hatch lid of tunnel. Therefore, the same boundary condition with motor RPM run-up test could not be maintained, which may results in the variation of resonance frequency by several Hertz.
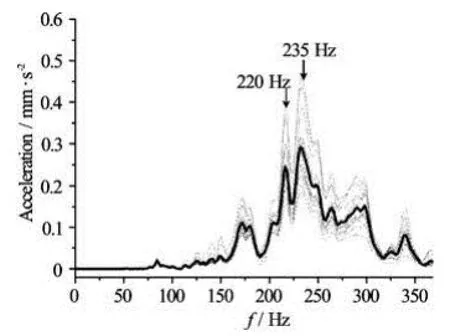
Fig.7 Vibration measurement for impact-test. Two distinct resonance peaks at 220 Hz and 235 Hz can be noticed
Ten individual vibration measurements were conducted by hitting the stern-part of the ship with a hammer, and represented in Fig.7 with overlaying their average as a thick line. Fine frequency resolution of 1 Hz was applied for the localization of resonance peak. Because of inadequate excitation power in low frequency range, the vibration shows little response below 100 Hz. On the other hand, the response has two distinct resonance peaks at 220 Hz and 235 Hz, both which are much alike to the ones of run-up test.From all the vibration measurements discussed above, the resonance frequencies of model-ship are considered to exist between 220 Hz and 243 Hz. Thus, corresponding propeller RPM from 2 200 to 2 430 needs to be avoided for a proper measurement of pressure fluctuation.
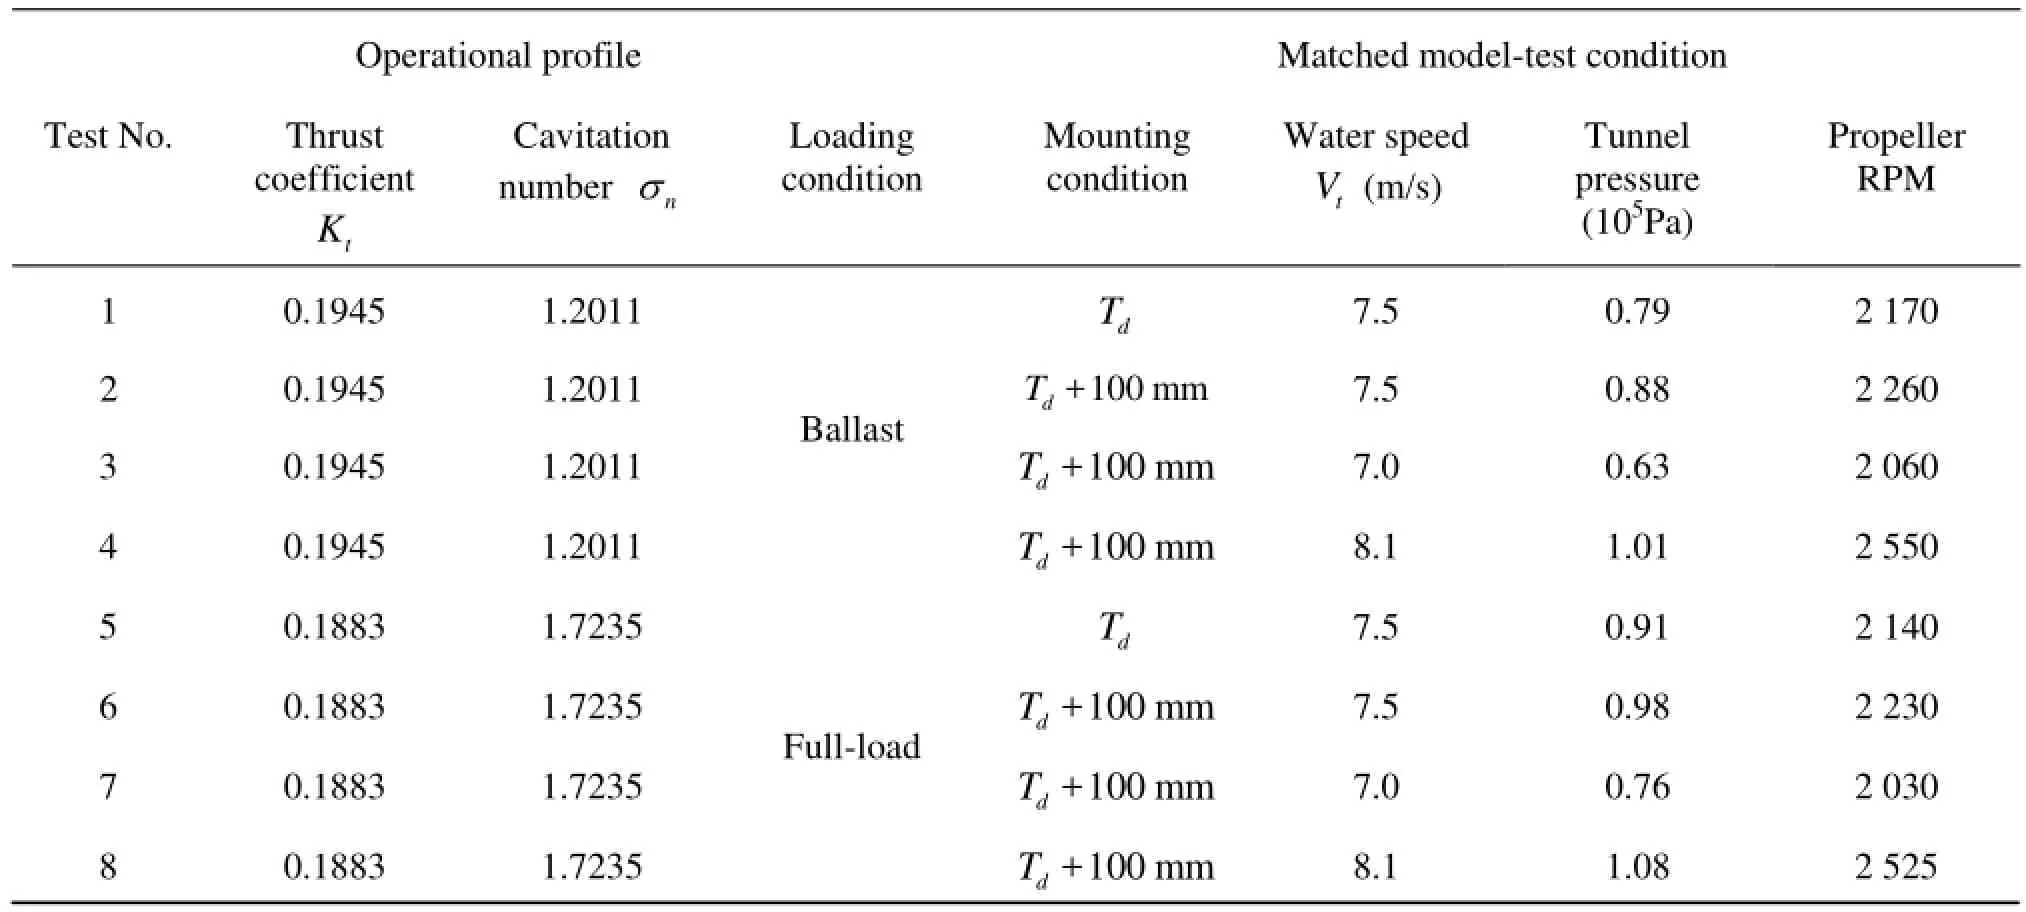
Table 2 Condition summary for the model-test

Fig.8 Location of pressure transducers in model-test, full-scale measurement location is depicted as triangle symbol
2. Experimental illustrations
The cavitation tests in the SSMB were performed to study the two considerations proposed in this study. As was mentioned in Section 1, the propeller was tested at a prescribed set of two non-dimensional numbers: thrust coefficienttK, and cavitation number n. Values of the two non-dimensional numbers are determined from the powering performance tests in the towing tank in advance. Detailed procedure for the cavitation tests in the SSMB can be found in Ref.[12].
Two mounting conditions of model-ship which are the same as cases of nominal wake measurements were examined to explore the effect of the boundary layer of wooden fairing. Then, in each mounting condition, the RPM of model-propeller was varied to study resonance effects on the pressure measurement. Under the combinations of two factors summarized in Table 2, the propeller was tested for both the ballastloading and the full-loading conditions.
As is shown in Fig.8, seven pressure sensors (Model: Kulite XTL-190) were flush-mounted on the model-ship just above the propeller. The measuring location in full ship is also depicted in Fig.8 with a triangle symbol. The signals were recorded into the hard disk through the data acquisition board on a Pentium PC. Sampling rate in recording is high enough to include at least 360 sampled points per a revolution. The measured pressure signals are analyzed with the fast Fourier transform to produce amplitude spectrum in the frequency domain. The spectrum was estimated by applying the Hanning window to minimize the “leakage” problem with an ensemble average of 50 times[13]. The amplitudes at several orders of blade rates were read to estimate the dimensionless pressure coefficientpK in the following

where PΔ denotes the analyzed pressure-amplitude at blade rates. Then the full-scale prediction is based on the general assumption that thepK values be the same on both model- and full-scales.

In the above equation the suffixes m and s are usedfor designating the model- and full-ships respectively.
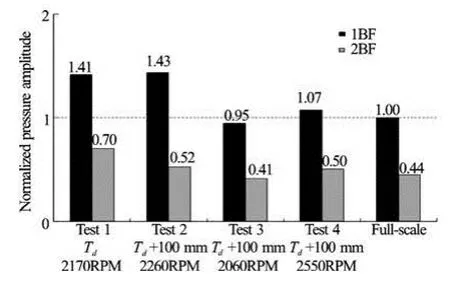
Fig.9 Pressure fluctuation measurements for ballast loading condition. The amplitudes were normalized by the firstorder values of blade frequency measured on full-scale

Fig.10 Cavity patterns for test No. 1- and No. 2- cases. The cavity extent is decreased after the deeper immersion of model-ship
For ballast loading condition, the set of pressure amplitude measured at No. 3 sensor is displayed in Fig.9, where the values are normalized by the firstorder component of blade frequency measured on full scale. First of all, the pressure amplitudes of test No. 1 over-predict the full-scale data by 41%. Among the two influential factors, boundary layer existing in the propeller disk is regarded as the cause of such an exaggeration, since the propeller RPM is out of the resonance frequency range. For the case of test No. 2, the boundary layer of fairing plate was avoided by lowering mounting draught of model-ship. However, the pressure amplitude of test No. 2, especially for the first-order value, does not show any significant change in spite of a deeper mounting draught. Besides, Fig.10 shows images taken by CCD camera to compare the cavity behaviors between test No. 1- and No. 2- cases, where the decrement of cavity extent can be noticed after the mounting draught change. That is, the resultant pressure measurement is scarcely varied despite of the change in the hydrodynamic behavior. By referring to Table 2, in fact, the flow speed of test No. 2 was kept as 7.5 m/s to follow the normal practice. Thus, the corresponding propeller RPM satisfying the thrust coefficient was 2 260. In other words, the first order of blade frequency 226 Hz turns to exist within the resonance frequency range of model ship. This explains the abnormalities of pressure measurement in test No. 2.
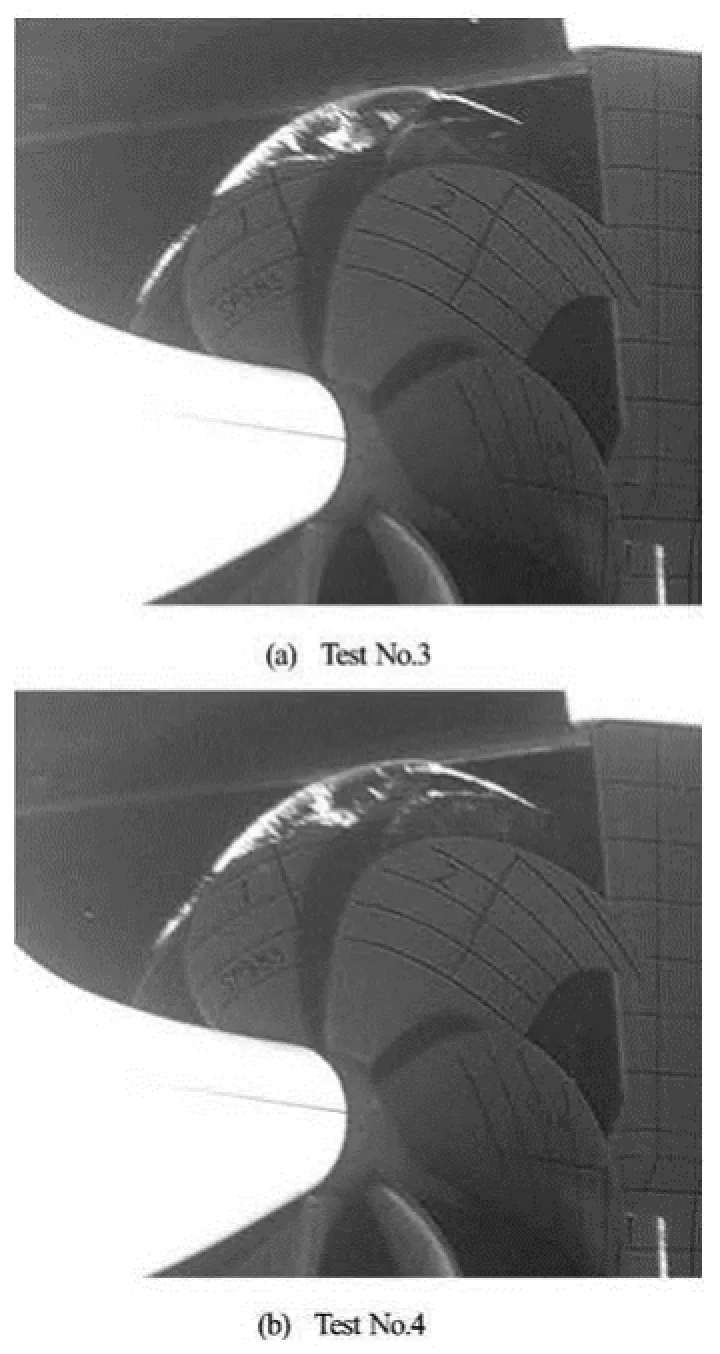
Fig.11 Cavity patterns for test No. 3- and No. 4- cases. The cavity behaviors are nearly similar with the one of test No. 2 case
When the propeller RPM was adjusted to avoid the resonance (accordingly the flow speed was varied also) las in the cases of test No. 3 or No. 4, pressureamplitude shows a close correlation with the full-scale data. It is noteworthy that the propeller RPM of test No. 3 and No. 4 are lower- and upper- than the resonance frequency range, respectively. Figure 11 compares cavity patterns of the test No. 3 and No. 4, both which exhibit nearly similar behaviors with test No. 2 case. Provided that non-dimensional numberstK and n are maintained for a certain mounting draught, visual observations themselves should be definitely identical between each other from the hydrodynamic viewpoint. Briefly, variation of testing RPM does not affect the hydrodynamic behavior, but affect structure-dynamic one, resulting in the amplification of measured pressure.
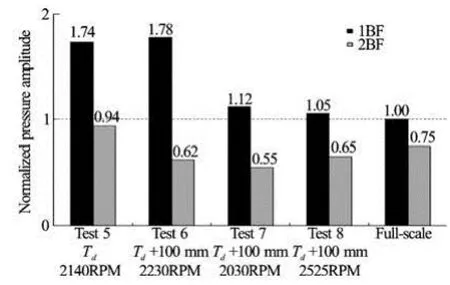
Fig.12 Pressure fluctuation measurements for full loading condition. The amplitudes were normalized by the first order values of blade frequency measured on full-scale
Figure 12 represents the results for full-loading conditions, exhibiting the same tendency with the ballast loading cases. In more detail, the pressure amplitude of test No. 6 is still higher than the full-scale value because of the propeller RPM existing on the resonance frequency range. As is shown in the results of test No. 7 and No. 8, where the resonance frequency of model-ship is avoided, diminished boundary layer appears to cause the reduction of pressure value with approaching to the full-scale data.
From the above demonstrations, boundary layer induced from fairing plate as well as the resonance of model-ship can be regarded as influential factors in model-test for a prediction of the full-scale pressure amplitude.
3. Concluding remarks
The objective of this study is to enhance the correlation deficiency between full- and model- scale pressure amplitudes, which is crucial in predicting hull vibration characteristics. To this end, two major considerations have been attempted for the conventional model test technique. One is to immerse the modelship deeper than its scaled design draught so that the boundary layer effect of wooden fairing plate can be minimized in the area of propeller disk. The other is to avoid the resonance frequency range of model-ship by adjusting propeller RPM. Furthermore, we could observe that both impact-test and/or motor run-up test can be necessarily employed for the identification of resonance frequency. Experimental demonstration exhibits their significant effects on pressure measurement. If the two requirements are satisfied, several tens of percentage errors could be decreased by a remarkable order.
Although there exist numerous uncertain factors which were not treated here, the approaches taken in this study would provide a systematic method for a full-scale correlation enhancement.
[1] CARLTON J. Marine propellers and propulsion[M]. 2nd Edition, Massachusetts, USA: Butterworth Heinemann, 2007.
[2] RICHARD P. Underwater acoustics[M]. New York, USA: John Wiley and Sons, 2010.
[3] MEDWIN H. Sound in the sea: From ocean acoustics to acoustical oceanography[M]. Cambridge, UK: Cambridge University Press, 2005.
[4] MORGUTM., NOBILE E. Numerical predictions of cavitating flow around model scale propellers by CFD and advanced model calibration[J]. International Journal of Rotating Machinery, 2012, 2012, ID:618180: 1-11.
[5] GAGGERO S., VILLA D. and BRIZZOLARA S. SMP workshop on cavitation and propeller performances: The experience of the University of Genova on the Potsdam propeller test case[C]. Second International Symposium on Marine Propulsors. Hamburg, Germany, 2011.
[6] WEITENDORF E. A., TANGER H. Cavitation correlation and nuclei investigations in two water tunnels–comparisons in the HYKAT and the medium size tunnel[C]. Proceedings of the Institution of Mechanical Engineers. 1992, C453/021:195-204.
[7] SCHUILING B., LAFEBER F. H. and PLOEG A. et al. The influence of the wake scale effect on the prediction of hull pressures due to cavitating propellers[C]. Second International Symposium on Marine Propulsors. Hamburg, Germany, 2011.
[8] ITTC. The Specialist committee on cavitation induced pressures[C]. 23rd International Towing Tank Conference. Venice, France, 2002.
[9] MCCONNELL K., VAROTO P. Vibration testing: Theory and practice[M]. 2nd edition, New York, USA: John Wiley and Sons, 2008.
[10] FOLLAND G.B. Fourier analysis and its applications[M]. New York: American Mathematical Society, 2009.
[11] EWINS D.J. Modal testing: Theory, practice and application[M]. 2nd edition, Letchworth, UK: Research Studies Press Ltd., 2000.
[12] LEE Jeung-Hoon, JUNG Jae-Kwon and, LEE Kyung-Jun et al. Experimental estimation of a scaling exponent for tip vortex cavitation via its inception test in full- and model-ship[J]. Journal of Hydrodynamics, 2012, 24(5): 658-667.
[13] BENDAT J. S., PIERSOL A. C. Random data: Analysis and measurement procedures[M]. 4th Edition, New York, USA: John Wiley and Sons, 2010.
10.1016/S1001-6058(11)60401-1
* Biography: LEE Jeung-Hoon (1978-), Male, Ph. D., Senior Research Engineer
杂志排行
水动力学研究与进展 B辑的其它文章
- The viscoelastic effects on thermal convection of an Oldroyd-B fluid in open-top porous media*
- Distribution features, transport mechanism and destruction of cuttings bed in horizontal well*
- Numerical research for contaminant release from un-suspended bottom sediment under different hydrodynamic conditions*
- Dynamic response of towed line array*
- The simulation of multiphase flow field in implantable blood pump and analysis of hemolytic capability*
- Diffusion of chemically reactive species in Casson fluid flow over an unsteady permeable stretching surface*
