Overall efficiency of a V-shaped nylon net fence in preventing sand damage to the Mogao Grottoes
2012-12-09GuoShuaiLiJianJunQuWanFuWangWeiYang
GuoShuai Li , JianJun Qu , WanFu Wang , Wei Yang
1. Key Laboratory of Desert and Desertification, Cold and Arid Regions Environmental and Engineering Research Institute,Chinese Academy of Sciences, Lanzhou, Gansu 730000, China
2. The Conservation Institute of Dunhuang Academy, Dunhuang, Gansu 736200, China
3. The Economic Research Institute of Hong Kong and Macao Special Administrative Region, Jinan University, Guangzhou,Guangdong 510632, China
Overall efficiency of a V-shaped nylon net fence in preventing sand damage to the Mogao Grottoes
GuoShuai Li1*, JianJun Qu1, WanFu Wang2, Wei Yang3
1. Key Laboratory of Desert and Desertification, Cold and Arid Regions Environmental and Engineering Research Institute,Chinese Academy of Sciences, Lanzhou, Gansu 730000, China
2. The Conservation Institute of Dunhuang Academy, Dunhuang, Gansu 736200, China
3. The Economic Research Institute of Hong Kong and Macao Special Administrative Region, Jinan University, Guangzhou,Guangdong 510632, China
A V-shaped nylon net fence installed in 1990 on top of the Mogao Grottoes is shown to be effectively resisting aeolian sand damage to the grottoes. The structure guides and causes deposition of sand from westerly wind (the primary hard wind), but to some extent hinders the inverse function of easterly wind carrying sand away from the grottoes toward Mount Mingsha. The gobi side by the fence experiences higher wind speed, so that on which are easily formed undercutting pits, and the deposited sands on it generally form double-peak structures due to abundant sand sources. If the earth surface characteristics in gobi areas by both sides of the fence are quite varied, the erosion and deposition features of the accumulating sand section are similar in different seasons; however, if the earth surface characteristics are similar,the features become irregular in different seasons. Sand depositions with long slope feet are formed along the south and north sides of V-shaped nylon net fence. Disrupted by strong westerly wind and northwesterly wind, sand accumulations by north of the fence are in form of single peaks. Although the operation duration of the V-shaped nylon net fence has exceeded its design life (10 years), our observations indicate that it is still effective in reducing wind-driven sand damages to the Mogao Grottoes, so it should not be withdrawn.
nylon net; sand prevention; gobi; Mogao Grottoes
1. Introduction
The Mogao Grottoes are known as the "Art Corridor of the World". The artistry of their interior and exterior painted murals is highly valued in China and even in the world. The grottoes are more than 1,600 years old but have been threatened by the effects of wind-driven sand during all of that time. Historical records indicated that in the 1940s the lowest grottoes of the Mogao Grottoes were nearly buried in sand. Adobe walls were built to resist sand incursion in 1950s and high vertical fences were established on top of the grottoes in the early 1960s. Prior to the 1980s about 3,000 to 4,000 m3of sand per year were removed from the grottoes area, and this was very costly.
The outdoor murals and the rock caves are constantly under threat of wind-blowing erosion and abrasion by wind-driven sand. Wind erosion has become one of the main causes of rock collapse and mural fading. Also,accumulating sand not only constantly threatens to bury the grottoes, but also creates great pressure on top of them. In October 1990, the Dunhuang Cultural Research Institute, the former Institute of Desert Research of Chinese Academy of Sciences, and the Getty Conservation Institute in the United States corporately carried out experimental studies on prevention of sand damage by the use of a nylon net (provided by America) on top of the grottoes. Statistical analysis of the regular climate observation data on top of the grottoes combined with observations of the patterns of aeolian sand movement in gobi area, led to the design of a V-shaped nylon net to prevent sand movement and accumulation (Stone, 2008) (Figure 1). Previous field observations (Manohar and Bruun,1970; Hagen and Skidmore, 1971; Willetts and Phillips,1979; Muraiet al., 1990; Zaghloul, 1997) have proven this to be the optimal protective structure. Nylon netting is resistant to weathering, relatively inexpensive to produce, and easy to build fences with it. All of these factors make nylon netting advantageous in controlling aeolian sand damage, and it is expected to be even more widely used in the future.

Figure 1 Geographical location of the Mogao Grottoes in China. The Mogao Grottoes lies in the Dunhuang City (94°48′E, 40°02′N), Gansu Province in China. The V-shaped nylon net fence, a comprehensive protective system against aeolian sand, is clearly visible.
2. Field observation and methods
2.1. Climatic features
The Mogao Grottoes is located in the southeastern edge of the Kumtag Desert in northwestern China. The climate there is controlled by high atmospheric pressure from Mongolia all the year round. The average annual temperature is 10.9 °C, the average annual relative humidity is 28.5%, and the average annual rainfall is 39.9 mm. This region situates in dry climate area of the warm temperate zone. The general climate characteristics are strong solar radiation and plenty of sunlight, dry weather and lack of rain, a short frost-free period, great differences in temperature between day and night, high evaporation, an extremely arid climate, and frequent sandstorm disasters.
2.2. Features of the aeolian sand environment
In the Mogao Grottoes area, the wind comes from different directions, mainly the south, the northwest and the northeast (Figure 2). The multi-year average wind velocity is 4.27 m/s. Within the wind speed range of ≥5 m/s and <8 m/s, the dominant south wind accounts for 55.7% of all dynamic wind frequency; the northwest and the northeast account for 8.5% and 9.5%, respectively. Within the wind speed range of ≥8 m/s and <10 m/s, the south wind,northwest wind, and northeast wind account for 16.9%,12.9%, and 31.6%, respectively. When the wind speed is≥10 m/s, which enables more sand transport, the frequency of the south wind accounts for only 3.6%, the northwest wind was 9.5% and the northeast wind was 37.8%. When the wind speed was ≥5 m/s, the frequency of the south wind reaches as high as 53.1%, the northerly wind which generally parallels the surface of the grottoes has a frequency of 6.5%, the westerly wind is the dominant wind that damages the cave, accounting for 7.2%, and the easterly wind accounts for 3.3%, it can erode the head of the Mogao Grottoes’ cliff and carry the deposited sand off the top of grottoes toward Mount Mingsha.
Analysis of meteorological data during 1992-2008 indicates that the yearly maximum wind speed mostly appears between May and July, and changes in a range of 16.29-20.17 m/s; Most of the maximum are easterly wind,accounting for 58.8%, followed by westerly wind and northeast wind. On an average, during 1992-2008, the south wind accounted for 36.85%, the northeast wind for 14.62%, and the northwest wind for 12.43%. Besides the northwest wind, the primary harm winds are westerly wind (8.35%) and southwest wind (7.77%) from Mount Mingsha to the grottoes (Figure 2).
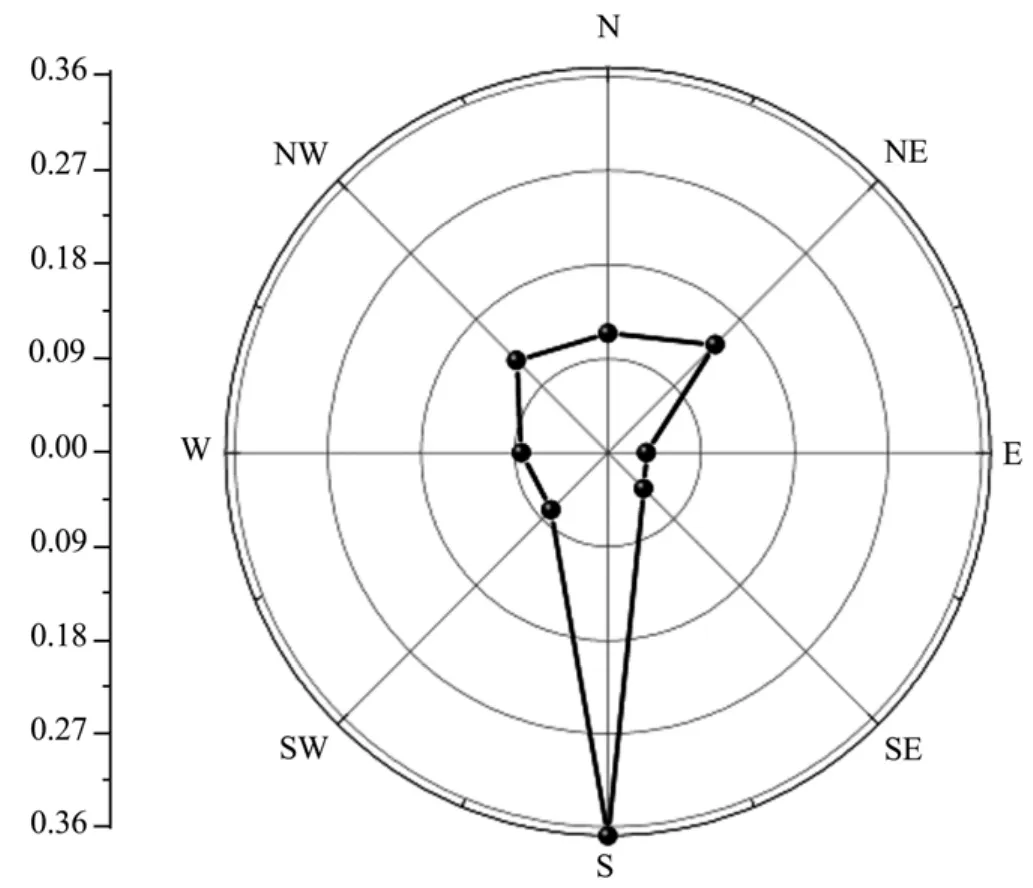
Figure 2 Wind rose over the Mogao Grottoes during 1992-2008
2.3. Research methods
2.3.1 Fence design
The initial design principle of the V-shaped nylon net was that the V-shape acme would point against the primary harm wind (W) and the two legs would face the secondary harm wind directions (WN→SE and SW→NE). Its main functions were to guide sand in the primary wind direction (W) and to capture sand originating from Mount Mingsha. The two parallel transverse north-south nylon netting fences were mainly used for protecting gobi from sand-driving wind in situ(Quet al., 1993; Linget al., 1996; Wanget al., 2005).Divided by the two parallel transverse north-south fences,landscape on top of the Mogao Grottoes is characterized by sandy gobi, sand gravel gobi, and gravel gobi in direction of W→E (Figure 3).
The length of the south leg of the V-shaped nylon net is 797 m, the north leg is 1,038 m, and the net height is 1.8 m. No. 45 angle-iron rods, which were erected on 20cm×30cm×30cm cement bases in soil and were set at 3-m intervals, were used as supporting poles for construction of the fence. No. 8 iron wires connect the poles in directions of upper line, ground surface line, and diagonals.Then the nylon nets were fixed to the wire frame (Figure 4). Net has a porosity of 20%, with drag coefficient of 1.5.When the wind speed is 11 m/s, the bearing pressure on the fence was 170 Pa.
A simple, economical and widely used inserted-pole observation method (Zachar, 1982; Jungerius and Van der Meulen, 1989; Lal, 1994; Saynoret al., 1994; McDermott and Sherman, 2009) was applied to monitor the sand erosion and deposition along the V-shaped nylon net. Though its accuracy is not high due to influence of natural and artificial factors, this is still an effective method in long-term scale.

Figure 3 Sketch map of the observation sections along the V-shaped nylon net
There were seven observation sections (Figure 3): sections I and II at the two parallel transverse fences, sections III, IV, and VII at the south leg, and sections V and VI at the north leg. Each section is perpendicular to net trend(Figure 4).
2.3.2 Research periods
Aeolian sand erosion and deposition data on sections I and II were obtained from 1992 to 2008, and on sections III, IV, V, VI, and VII from 2001 to 2008. The process of preventing wind-driven sand by combined engineering and biological measures can be divided into three phases based on prevention efficiency. Phase 1:from 1992 to 1998, during the period a sand-fixation forest belt by 950 m long and 12 m wide was built in front of the Mount Mingsha. Phase 2: from 1999 to 2003,during this period the forest belt was expanded into two belts by 2,000m×12m; five domestic psammophyte plants (Tamarix ramosissimaLedeb.,Chenopodiaceae,Hedysarum scoparium,Calligonum mongolicunl, andCaragana korshinskiiKom.) were chosen and drip irrigation technology was introduced in forest belt construction. Phase 3: from 2003 to 2008, different types of mechanical barriers (e.g., a straw checkerboard barrier, a cotton stem horizontal barrier, and a high vertical-style barrier) were installed in the mobile sand dune area in front of Mount Mingsha. Also, gravel paving was spread in the gobi area on top of the grottoes. These mechanical engineering and biological measures were the preliminary elements of a multi-level, multi-functional comprehensive protection system.
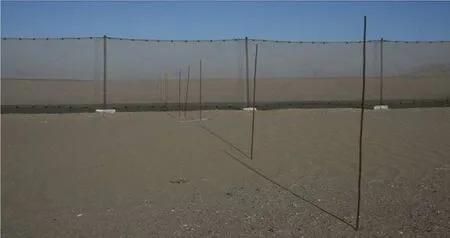
Figure 4 Monitoring section perpendicular to net trend
3. Results and analysis
3.1. The relationship between monitoring points and primary harm wind
Primary harm winds against the two legs of the V-shaped fence are SW and NW. Sections III, IV, and VII on the south net fence leg monitored mainly the erosion and accumulation of aeolian sand in the SW→NE direction; sections V and VI on the north leg monitored that in the WN→SE direction. The easterly east wind, to some extent, plays a role in alleviating wind-driven sand damages to the grottoes from the Mount Mingsha, although it is weak (Figure 5).
3.2. Seasonal variations of sand erosion and deposition
3.2.1 Observation on the two transverse fences
Observation of sand erosion and deposition varied in space-time. Section I was on the boundary between sand gravel gobi and gravel gobi. Sand accumulation on the sand gravel gobi reached the highest at 0.5 m distance to the fence due to more sand sources and in function of strong westerly wind blowing. When the sand-carrying wind climbed over the fence, shallow undercutting pits were formed behind the accumulation area because of abrupt change of wind shear function. During Phase 1 of comprehensive protection, the maximum of sand deposition reached 30.3 cm in summer, followed by autumn and spring; the minimum value was 20.4 cm in winter.During Phase 2, the maximum deposition reached 43.3 cm in summer, followed by autumn, spring, and winter;the values in spring and winter were almost equal. During Phase 3, there was little difference of observation values among in spring, autumn, and winter; and the value in summer was slightly less than the other values.Overall, the seasonal sand erosion accumulation shapes during these three phases were basically similar except for differences in height or width (Figure 6).
Section II was on the boundary between sandy gobi and sand gravel gobi, and much closer to the acme of the V-shape. On the one hand, the westerly wind became weak when it arrived at section II area because of the wind-channeling effect of the V-shaped fence. On the other hand, the easterly wind reinforced after travelling for 205 m distance from the east transverse fence. So, the easterly wind speed became stronger than the westerly wind within the triangle area between the west transverse fence and the V-shape fence. Consequently, undercutting pits formed on the west side of this transverse net fence.However, the highest sand accumulation still occurred at 2 m to west of this net fence because of richer sand sources in sandy gobi. The seasonal observations at 2 m to west fence in sandy gobi showed little difference in the three stages; also because of richer sand sources the erosion and deposition shape appeared a double-peak mode (Figure 7).
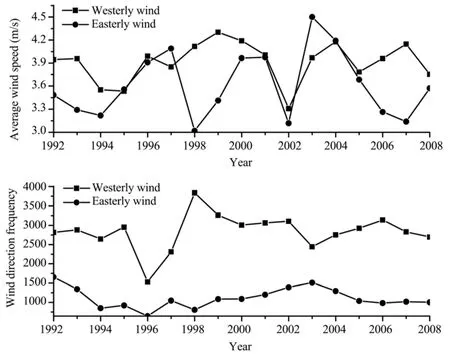
Figure 5 Yearly variation of average wind speed and frequency of easterly and westerly winds during 1992-2008
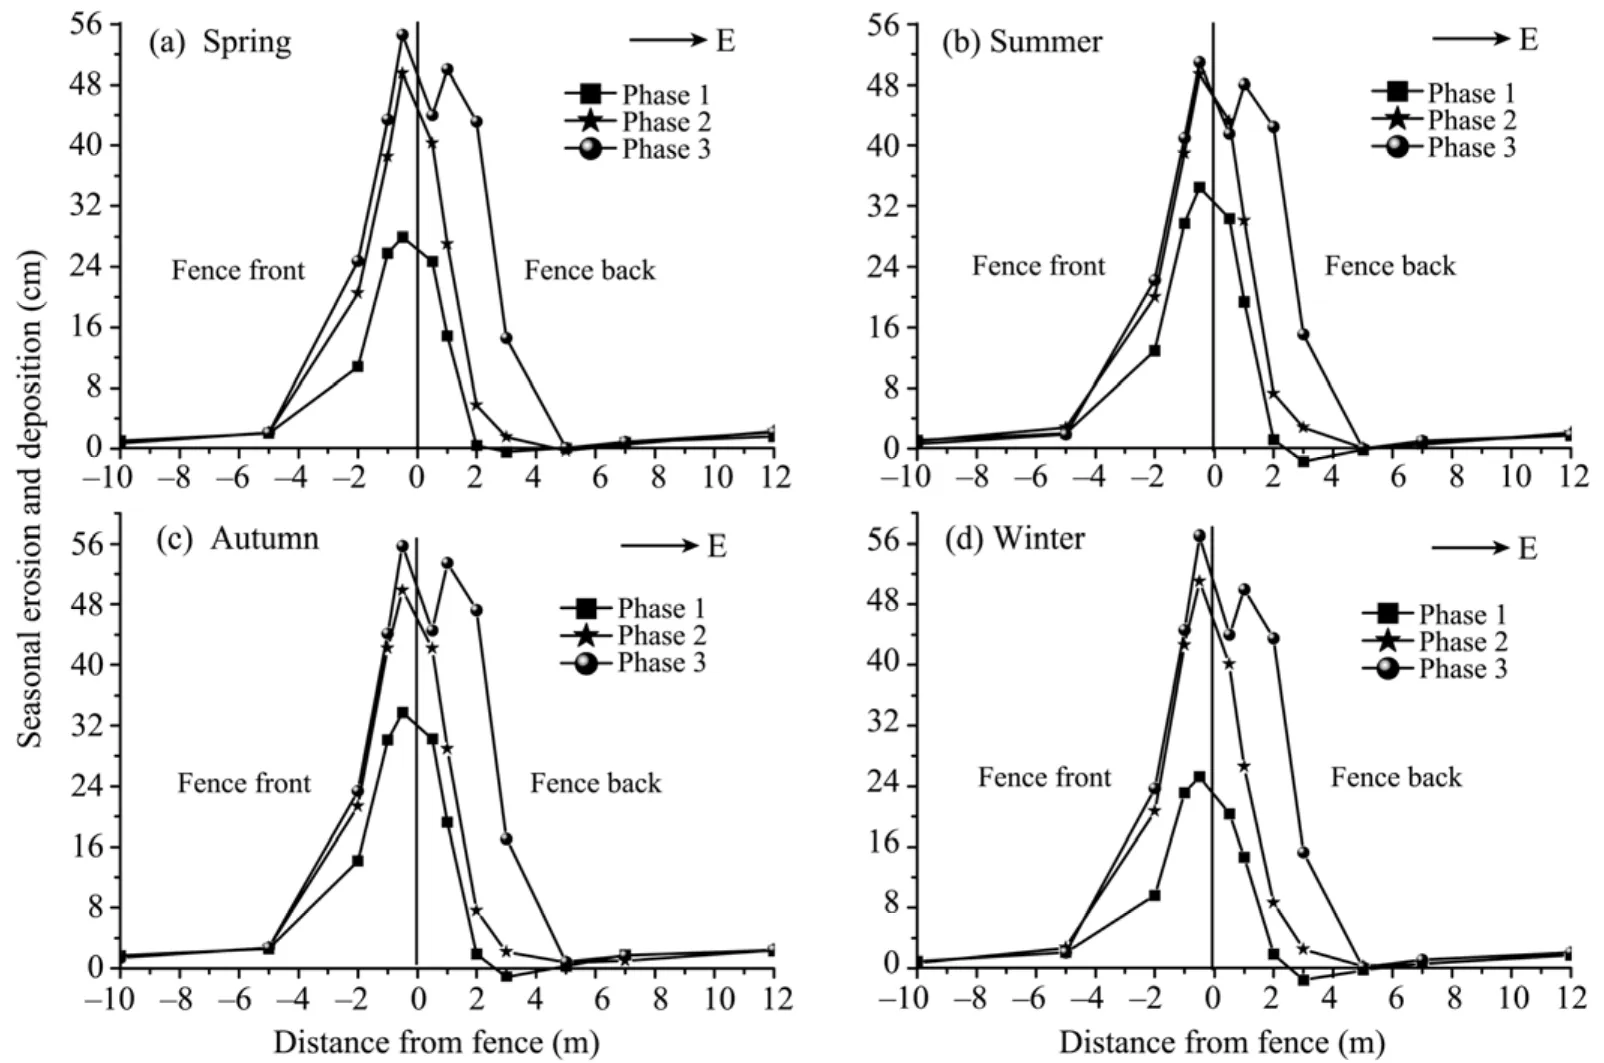
Figure 6 Seasonal variation of the form of erosion and deposition in section I during different phases

Figure 7 Seasonal variation of the form of erosion and deposition in section II during different phases
3.2.2 Observation on the south leg of the V-shaped fence
Sections III, IV, V, VI, and VII were reestablished in January of 2001 after accumulated sand was cleared away along the V-shaped nylon net fence. Here, 2001-2002 was defined as Phase 2 and 2003-2008 as Phase 3. Sections VII, IV, and III were located on the south leg of the V-shaped fence, and section VII was close to the acme. In the process of the westerly flow diverging along the V-shape, sand carried by wind gradually deposited in W-E direction under the friction effect of gobi surface. Generally, the form of erosion and deposition of accumulating sand decreased in height and width from section VII to section III (Figures 8, 9, 10).
During Phase 2, the highest accumulation point on sections III, IV, and VII moved beside the south leg of the V-shaped fence in the alternation of dominant southwest wind with northeast wind in different months. During Phase 3, the former destroyed gobi surface has re-obtained its structural stability after two years of restoration. Thus,the forms of erosion and deposition on these sections were similar in different months. Simultaneously, the engineering and biological protective measures (mechanical sand barriers, gravel paving, shelter-belt forests) constructed in Phase 3 have increased the roughness of the underlying surface and the starting wind speed of sand particles, thus the sand load in wind became less. In comparison, the quantity of erosion and deposition at 2 m northeastward from the fence was less than in Phase 2 during the same months.
Especially, the erosion and deposition form of accumulating sand on section IV was lower and narrower under the effect of strong northeast wind. Because of less sand sources and controlled by both northeast wind and southwest wind, staggered undercutting appeared at section IV area. The greatest undercutting depth in Phase 2 was 8.5 cm in January and, in Phase 3, was 7.8 cm in July, which was attributed to the construction of the comprehensive protection system on top of the grottoes(Figure 9).
The accumulation on section III was broader and higher than that on section IV during the same period.This was related to the accumulated sand with longer slope feet by the southwest wind. In addition, the sand carried by the northeast wind couldn’t pass through the downstream current of diverged wind all the time, and the unload sand deposited at the northeast side of the fence. Thus, double-peak accumulation formed beside the fence (Figure 10).
3.2.3 Observation on the north leg of the V-shaped fence
Sections V and VI situated on the north leg of the V-shaped net fence and were perpendicular to the SW-NE fence. Influenced by the strong westerly wind,there were long sand accumulation slope feet along both sides of the fence, but the accumulated sand volume was larger in northwest side than in southeast side because of difference in combination of wind force. In comparison, the sand accumulation on section VI was higher than on section V, and its sand slop was also more steep (Figures 11, 12).
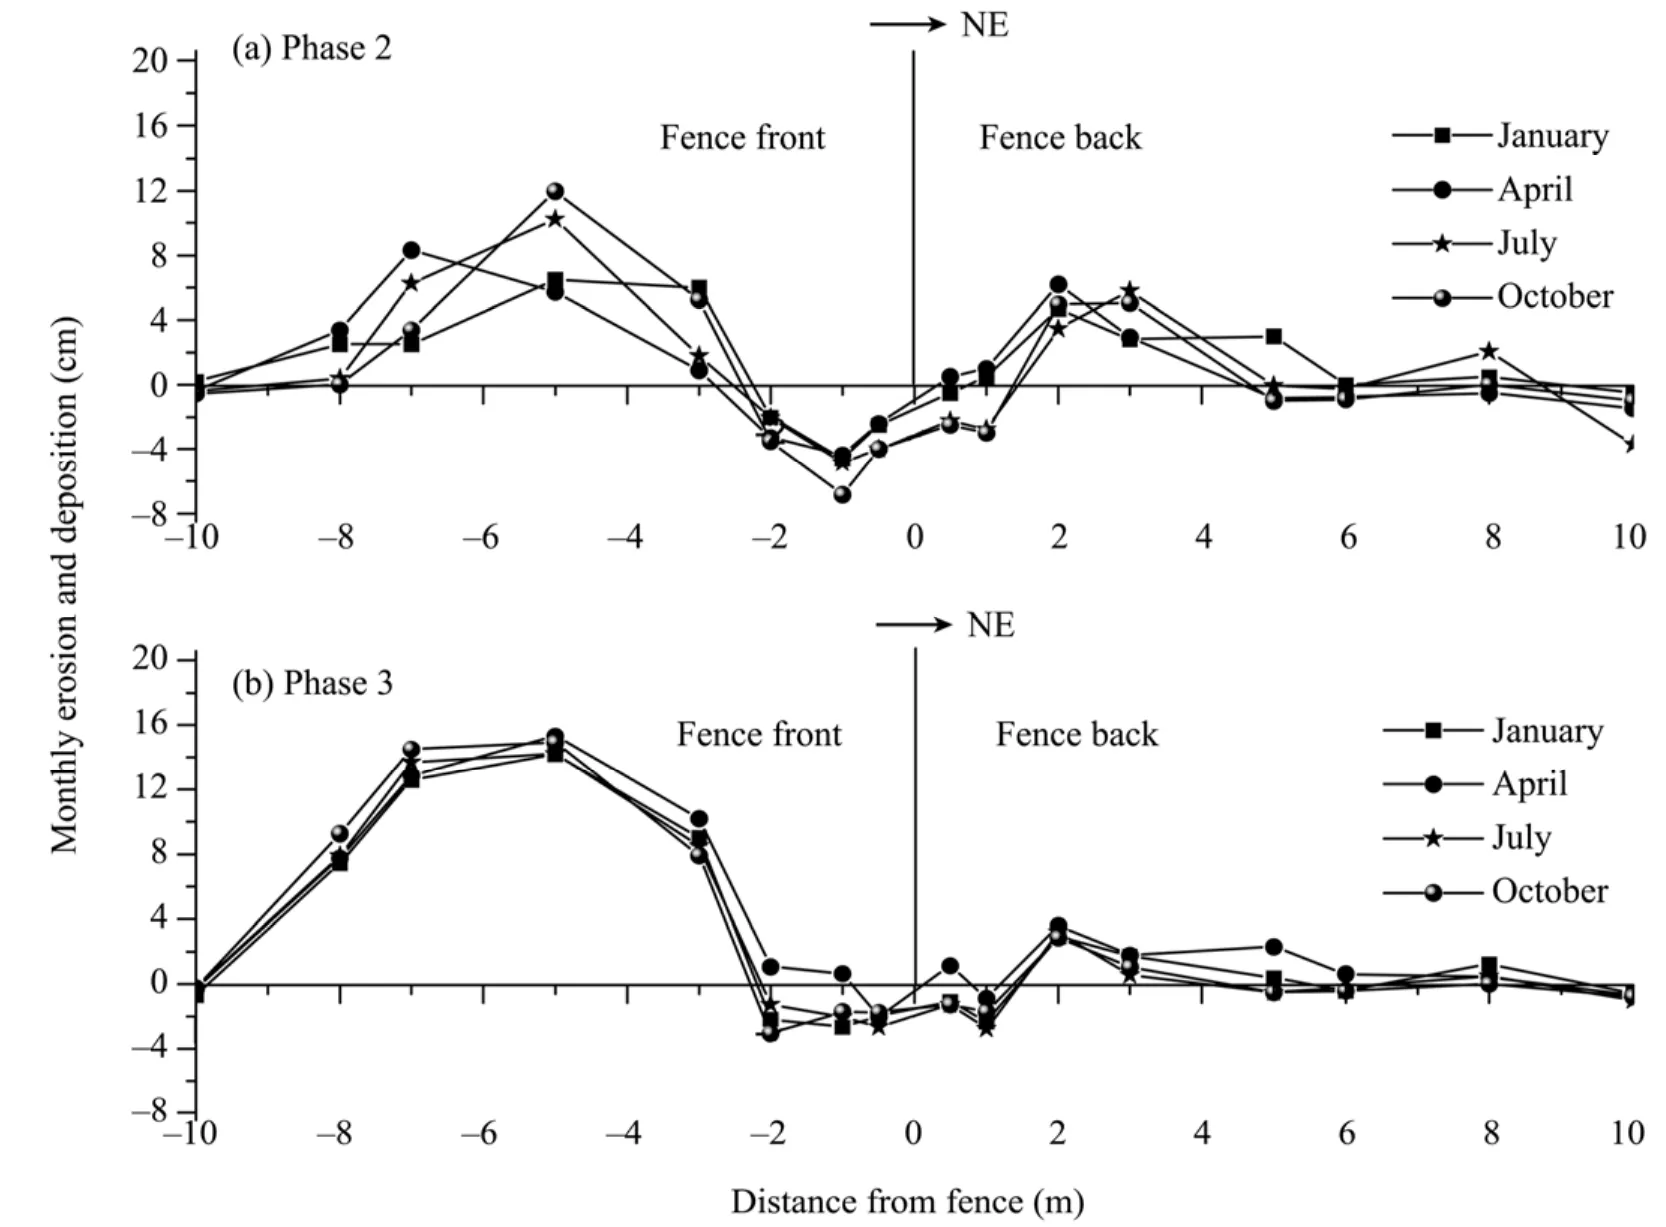
Figure 8 Monthly variation of the form of erosion and deposition in section VII during different phases
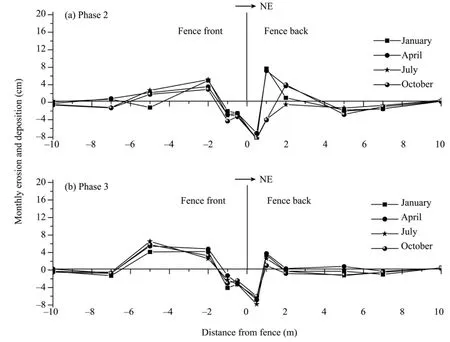
Figure 9 Monthly variation of erosion and deposition in section IV during different phases

Figure 10 Monthly variation of erosion and deposition in section III during different phases

Figure 11 Monthly variation of erosion and deposition on section V during different phases

Figure 12 Monthly variation of erosion and deposition on section VI during different phases
On section V, sand accumulation reached its maximum at about 4.5 m southeast to the net fence in both Phase 2 and Phase 3; wind erosion occurred at 3-4 m northwest to the fence. The seasonal variation of the quantity of erosion and deposition in Phase 2 was from 14.5 cm in January, to 14.7 cm in April, to 20.8 cm in July, and to 23.5 cm in October; that in Phase 3 showed no significant difference(Figure 11).
On section VI, sand accumulation showed single peak,which was reasonably explained by that the protective effect of the fence was somewhat destroyed by intense combined actions of the west wind and the northwest wind(Figure 12).
3.3. Inter-annual variation of sand accumulation
3.3.1 Variation on different sections
The yearly average quantity of observation of sand erosion and deposition on different sections during 1992-2008 showed that accumulation was the main state and in some years erosion was dominant (Figure 13). Influenced by integrated wind field, the observation value on sections increased from west to east and from south to north.
Table 1 showed the inter-year growth variation of average quantity of observation of sand erosion and deposition on different sections from 1992 to 2008. The statistical results proved that the growth rate on section I changed in an order as: in Phase 1 (1992-1998) > in Phase 2 (1999-2003) > in Phase 3 (2003-2008), indicating a generally accumulation trend. The growth rate on section II was about 62% in Phase 1, only 2.8% in Phase 2, and about 9% in Phase 3, suggesting that to some extent sand erosion happened in this area during Phase 2.The inter-year growth variation on sections III, IV, V, VI,VII during Phase 3 showed a change trend of "increase first but decrease then" because of the effect of comprehensive protective system, and the difference among the changing processes may be related with protective system’s asynchronous function.
3.3.2 Variation on three kinds of gobi surfaces
The surface land forms within the V-shaped net fence include sandy gobi, sand gravel gobi, and gravel gobi,with two transvers fences as divider. Observation of the quantity of aeolian sand erosion and deposition during 1992-2008 showed that the value on gravel gobi was the biggest, followed by sand gravel gobi, then by sandy gobi(Figure 14). This may be explained that as the gravel diameter increased in order of sandy gobi → sand gravel gobi → gravel gobi, the sand coverage became smaller and the interspace became bigger. As consequence, sand particles were deposited into the gravel interspaces and they can’t be easily eroded again in the protection of the vortex area formed by gravels themselves.
3.3.3 Variation along north and south legs of the V-shaped fence
The average speed and its frequency of southwest wind against the south leg of the V-shaped fence were all lower than those of the northwest wind against the north leg, and the latter brought more sand from the sand source region-- Mount Mingsha. So the average sand accumulation volume along the north leg was obviously higher than that on the south leg from 2001 to 2008. It was estimated that the average sand accumulation volume along the north leg increased at a rate of 297.2 m3/yr and that along the south leg increased at a rate of 57.9 m3/yr during 2001-2008 (Figure 15). The abrupt increase at the north in 2008 was resulted from spread gravel pavement that destroyed the original gobi surface, causing more sand activities; the abrupt decrease at the south in 2008 was the result of decreased wind speed and wind frequency.
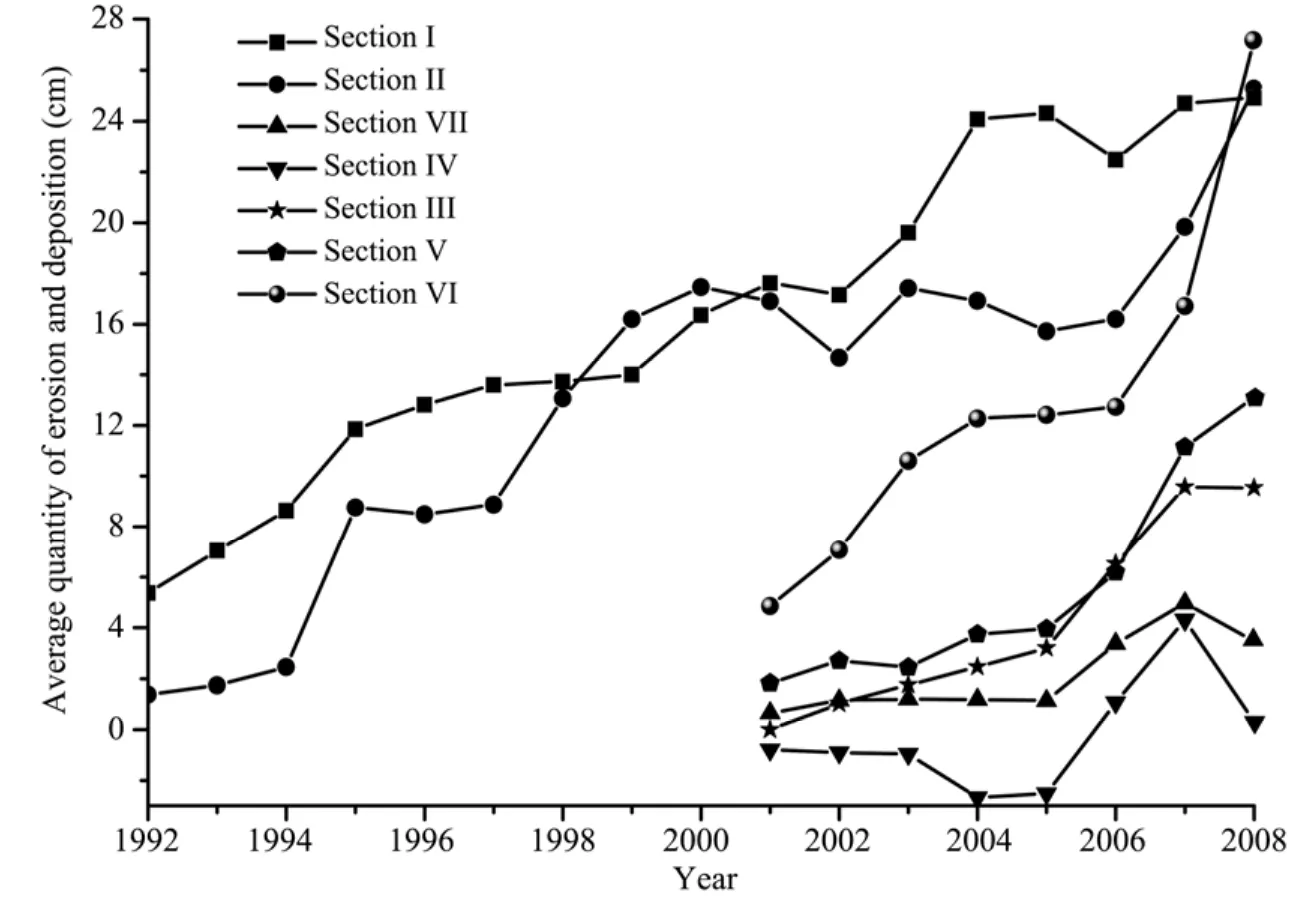
Figure 13 Yearly variation of average quantity of erosion and deposition on different sections from 1992 to 2008

Table 1 The change of average quantity growth of erosion and deposition on different sections during 1992-2008

Figure 14 Yearly variation of average quantity of erosion and deposition in the three kinds of gobi surfaces within the V-shaped fence from 1992 to 2008
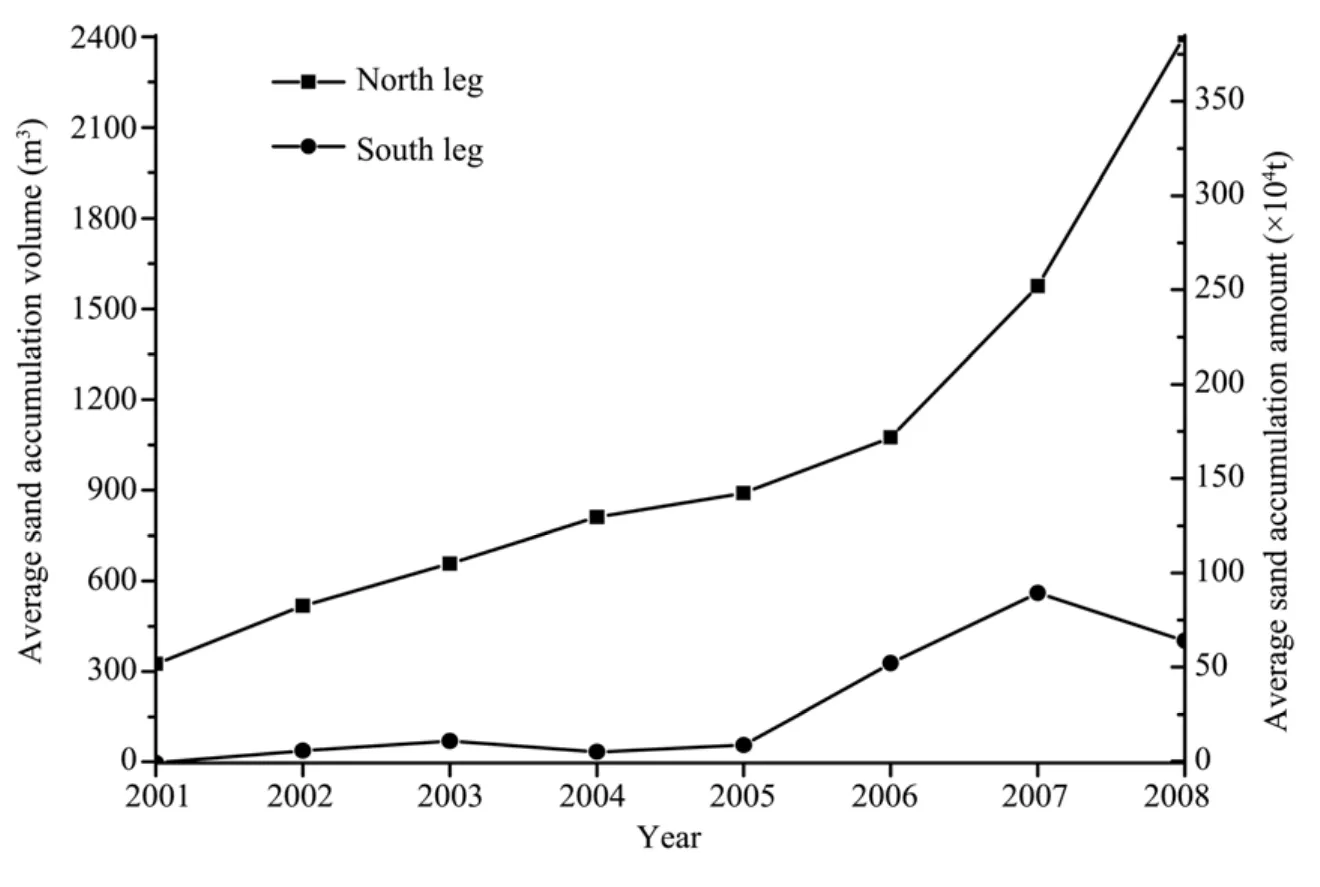
Figure 15 Yearly variation of the average sand accumulation volume along the south and north legs of V-shaped fence during 2001-2008
4. Conclusions
The V-shaped nylon net fence installed in 1990 is a key part in the comprehensive protection system of the Mogao Grottoes; it has effectively reduced sand transport from Mount Mingsha to the grottoes. This unique V-shaped structure not only directly prevents primary harm winds from different directions, but also effectively guides these sand-load winds going around the Mogao Grottoes from both sides. But enough attention has not been paid to the inverse sand transportation function of the easterly wind in the construction of the comprehensive protection system, and the V-shaped fence construction destroyed the air current over the original landforms.In the short term the threat to the grottoes has indeed been lessened, but in the longer term sand damages to the Mogao Grottoes perhaps will be deteriorating. So, to seek long-term effective protection measures of the Mogao Grottoes is our research emphases in the future.
This research was supported jointly by the National Science and Technology Support Program (2012BAC08B07),the Natural Science Foundation of China (Nos.2009BAC54B01-1 and 40930741) and the Knowledge Innovation Program of the Chinese Academy of Sciences(KZCX2-EW-313). We are grateful to GuoBin Zhang,Fei Qiu, HongTao Zhan, XiangRu Lin and Rui Li for their assistance with experiments. We also thank YuQuan Ling, WanYin Luo and Qiang Zhu for comments on this manuscript.
Hagen LJ, Skidmore EL, 1971. Turbulent velocity fluctuations and vertical flow as affected by windbreak porosity. Transactions of the ASAE, 14(4): 634-637.
Jungerius PD, van der Meulen F, 1989. The development of dune blowouts, as measured with erosion pins and sequential air photos.CATENA, 16(4-5): 369-376.
Lal R, 1994. Soil Erosion Research Methods. CRC Press, Boca Raton.
Ling YQ, Qu JJ, Fan JS, Li YH, Agnew N, Lin PM, 1996. The effect analysis of sand control engineering on the cliff top of Mogao Grottoes. Journal of Desert Research, 16(1): 13-18.
Manohar M, Bruun P, 1970. Mechanics of dune growth by sand fences.Dock and Harbour Authority, 51: 243-252.
McDermott JP, Sherman DJ, 2009. Using photo-electronic erosion pins for measuring bed elevation changes in the swash zone. Journal of Coastal Research, 25(3): 788-792.
Murai H, Al-Afifi MA, Haffar I, Yoshizaki S, 1990. Use of date-fronds mat fence as a barrier for wind erosion control. 1. Effect of barrier density on sand movement stabilization. Agriculture, Ecosystems and Environment, 32(3-4): 273-282.
Qu JJ, Zhang WM, Ling YQ, 1993. Experimental research of nylon fence off sand on roof of Dun Huang Mogao Cave. Arid Zone Research,10(3): 16-20.
Saynor MJ, Loughran RJ, Erskine WD, Scott PF, 1994. Sediment movement on hillslopes measured by caesium-137 and erosion pins.IAHS Publications-Series of Proceedings and Reports Intern. Assoc.Hydrological Sciences, 224: 87-94.
Stone R, 2008. Shielding a Buddhist Shrine from the Howling Desert sands. Science, 321(5892): 1035.
Wang WF, Wang T, Fan JS, Zhang WM, Qu JJ, Agnew N, Lin BM,2005. Effect of nylon net fence on preventing blown sand at top of Mogao Grottoes, Dunhuang. Journal of Desert Research, 25(5):640-648.
Willetts BB, Phillips CJ, 1979. Using Fences to Create and Stabilise Sand Dunes. ASCE Press, Alexander Bell Drive Reston.
Zachar D, 1982. Soil Erosion. Elsevier Science Ltd., Amsterdam.
Zaghloul NA, 1997. Sand accumulation around porous fences.Environmental Modelling & Software, 12(2-3): 113-134.
10.3724/SP.J.1226.2012.00163
*Correspondence to: GuoShuai Li, Key Laboratory of Desert and Desertification, Cold and Arid Regions Environmental and Engineering Research Institute, Chinese Academy of Sciences. No. 320, West Donggang Road, Lanzhou, Gansu 730000,China. Tel: 86+931-4967570; Email: liguoshuai@lzb.ac.cn
August 21, 2011 Accepted: December 15, 2011
杂志排行
Sciences in Cold and Arid Regions的其它文章
- Research progress in monitoring and simulating stem radius growth: an overview
- A model test system with a dynamic load device for geotechnical engineering in cold regions
- Analysis on mechanisms of anomalous variations of tropopause pressure over the Tibetan Plateau during summer in Northern Hemisphere
- Quantitative characteristics of microorganisms in permafrost at different depths and their relation to soil physicochemical properties
- Application study of the awning measure to obstruct solar radiation in permafrost regions on the Qinghai-Tibet Plateau
- Trend of snow cover fraction over East Asia in the 21st century under different scenarios
