CO2 Capture by Vacuum Swing Adsorption Using F200 and Sorbead WS as Protective Pre-layers*
2012-02-14XUDong徐冬PennyXiaoLIGang李刚ZHANGJun张军PaulWebleyandZHAIYuchun翟玉春
XU Dong (徐冬)**, Penny Xiao, LI Gang (李刚), ZHANG Jun (张军), Paul Webley and ZHAI Yuchun (翟玉春)
1 Guodian New Energy Technology Research Institute, China Guodian Corporation, Beijing 100034, China
2 Department of Chemical Engineering, Monash University, Melbourne 3186, Australia
3 School of Material and Metallurgy, Northeastern University, Shenyang 110004, China
1 INTRODUCTION
CO2capture by vacuum swing adsorption (VSA)from its emission resources is a promising technology for greenhouse gas mitigation [1-3]. It has been found that 13X zeolite is one of the best commercial adsorption materials to date for CO2capture from flue gases[4-6]. However, the adsorption capacity of CO2on zeolite 13X is affected significantly by water vapour[7, 8]. In running power plants, there are normally 10%-15% CO2and almost 10% water vapor contained in flue gas streams. Conventional approaches using a pre-treatment/drying apparatus to remove moisture from flue gas would considerably increase the overall cost. Consequently, multi-layered VSA adsorption system using water resistant adsorbents as a protective layer in combination with 13X is envisaged.
Activated alumina has been widely used in industries for removing moisture in vacuum swing adsorption (VSA) systems [9]. Also, Sorbead WS with its high resistance against hydrothermal aging and low regeneration temperature is getting popular in air separation apparatus [10]. In this paper, because of different micro-structures for the two adsorbents, LBET(extended Langmuir-BET) model and extended CMMS(cooperative multimolecular sorption) equation were introduced respectively to describe water loading at different temperature and different relative humidity(RH) on F200 and Sorbead WS. The double-layered VSA process was simulated by our in-house simulator,MINSA (Monash Integrator for Numerical Simulation of Adsorption), which was based on the conservation of mass and energy within an adsorption. According to the water holding capacities of Sorbead WS and F200,nine-step VSA cycle was designed with a three-bed unit using the two water resistant adsorbents as prelayers and 13X as main-layer.
2 EXPERIMENTAL
2.1 Materials characterization
The pre-layer materials used in this study were activated alumina F200 and BASF Sorbead WS. The two adsorbents are usually applied in the adsorptive drying industry, and have excellent mechanical properties and high water adsorption capacity. The main layer material employed in this work was commercial grade 13X zeolite adsorbent from UOP [11].
Surface area, pore volume and pore size distribution of the adsorbents were measured on an ASAP 2010 Gas Adsorption Analyzer (Micromeritics, USA)at the temperature of 77 K (liquid nitrogen). The samples were degassed under vacuum at 350 °C for 12 h.The BET method was used to calculate the specific surface areas (SBET) over the P/P0range of 0.05-0.25 and the Density Functional Theory (DFT) model based on cylinder pore geometry was used to calculate pore size distributions. Physical properties of 13X,F200 and Sorbead WS are shown in Table 1. The adsorption isotherms for CO2and N2on those adsorbents were measured with the same apparatus over the pressure range 0-118 kPa, however, the adsorption temperature on the analyzer is regulated to 20-90 °C.
The water isotherms on the three adsorbents were measured under the temperature range of 25-60 °C with a custom built gravimetric apparatus termed the binary isothermal adsorption unit (BIAU). Saturated water vapor was obtained by passing nitrogen through a small-scale water tank. Relative humidity and waterpartial pressure were measured byin situhumidity analyzer (HMT330, ±0.05% full scale, VAISALA,Finland). Physical properties of 13X zeolite and Sorbead WS are listed at Table 1.

Table 1 Physical properties of 13X zeolite, F200 and Sorbead WS

Table 2 Parameters of the dual site Langmuir equation for CO2 adsorption isotherm
2.2 Process simulation
Simulations of a nine-step VSA cycle with a packed bed of conventional adsorbents and the structured adsorbents were performed using the adsorption simulator MINSA (Monash Integrator for Numerical Simulation of Adsorption), which numerically solved the coupled partial differential equations of mass and energy balances using the finite volume method with flux limiters as described previously [12, 13]. The linear-driving force model was employed to model mass transfer. The pressure drop across the adsorbent beds was calculated using the Ergun equation for the case of a packed bed. The equations used in MINSA simulation are given below.
Mass balance:

The simulator mimics the operation of an actual VSA process in that control valves regulate the flows to/from a bed according to desired end-of-step conditions (e.g., pressure, purity). Total 20 nodes are set within the mass transfer zone for this simulation including five nodes in the pre-layer and 15 nodes in the main layer. The positions of nodes in the pre-layer are in 0.0138, 0.0413, 0.0825, 0.138 and 0.193 m. The positions of nodes in the main layer are in 0.251,0.314, 0.377, 0.440, 0.503, 0.566, 0.629, 0.691, 0.754,0.817, 0.880, 0.943, 1.01, 1.05 and 1.08 m. The parameters in the boundary of each layer are also calculated such as at length of the bed of 0, 0.22 and 1.1 m.
The experimentally recorded adsorption isotherms for CO2and N2over a range of temperatures were fit to a dual-site Langmuir isotherm [11]. The fitted parameters are calculated according to the following equations:
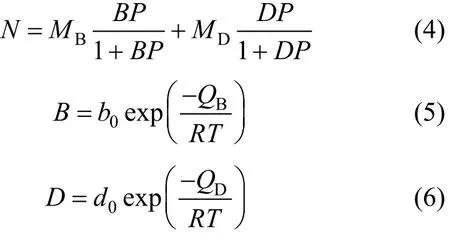
wherePis the gas pressure, andB,D,b0andd0are constants.QBandQDare the heats of adsorption for adsorption on the two types of sites,Rthe gas constant andTthe temperature.MBandMDrepresent the maximum monolayer adsorption on the two types of sites. The units for the above parameters are listed in Table 2 along with the fitting results of the model.
The isotherm of H2O on Sorbead WS (adsorption type IV) can be fitted by extended CMMS model [Eqs.(7-11)] [14].

On the other hand, the isotherm of H2O on F200(adsorption type II) can be described by LBET model[Eqs. (12-15)] [15-17]. The parameters for the two models are listed in table 3.

Table 3 Parameters in extended CMMS and LBET models

Table 4 Operational conditions of the VSA process

Figure 1 Schematic diagram of 9-step cycle of VSA process

The isosteric heat of water adsorption onto F200 and Sorbead WS was calculated by applying the Clausius-Clapeyron equation [18]:
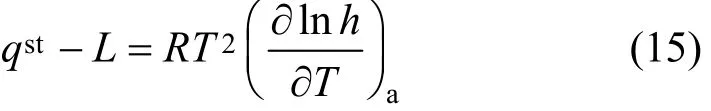
whereqstis the isosteric enthalpy of adsorption andLis the enthalpy of water condensation.
2.3 Cycle design
According to adsorption behaviour of H2O on Sorbead WS and F200, a nine-step VSA cycle was designed. Fig. 1 shows detailed description of the nine step cycle.
(1) Adsorption. When feed gas entered the adsorption bed, CO2and water vapour were adsorbed in the solid phase and exhausted gas with less CO2exited from top of the bed; (2) Equalisation. The gas flowed from a bed with a high pressure bed to another one with a low pressure until pressures were same between the two beds; (3) Desorption. CO2and water adsorbed in the solid were released into a gas phase as operating pressure decreased into vacuum level; (4) Receiving Equalisation. Same as equalisation, one bed received from another bed until pressure equalisation for the two beds; (5) Repressurisation. The feed gas flowed into the bed until the pressure of the bed equaled to the feed gas; (6) Product purge. The enriched product gas was sucked back to the adsorption bed to purge the bed. Blow away the air staying in the gap space of the bed, and replace the N2in the adsorbent. Then improve the product purity.
Sorbead WS can hold more water so that the length of Sorbead WS was less than that of F200 in the pre-layer.The ratio of the Sorbead WS to 13X was 1∶4 and of F200 to 13X was 1∶3. The physical size of adsorption column is ID of 76 mm and length of 1.1m. The synthetic feed gas containing 12% CO2and 10% water vapor at 60 °C balanced with air was fed into the adsorption column with the operational conditions in Table 4.
3 RESULTS AND DISCUSSION
3.1 Equilibrium isotherms
The adsorption isotherms for CO2and N2on 13X(Fig. 2) are essentially linear within the pressure range investigated. The high CO2adsorption capacity for 13X zeolite and the quite low N2adsorption indicate excellent adsorption selectivity between CO2and N2.Thus, the amount of CO2and N2on 13X explains the reason why 13X is the super adsorbent candidate for CO2separation from flue gas. The measured CO2isotherms are also well characterized by the Dual site Langmuir equation that can be applied into our in-house simulator to simulate adsorption behaviour of CO2onto 13X.

Figure 2 Isotherms of CO2 and N2 on 13X zeolite at different temperatures(Solid spots are experimental data; lines are model fitted data)■ CO2 at 20 °C; ● CO2 at 40 °C; △ CO2 at 29 °C; ▼ N2 at 20 °C;◇ N2 at 40 °C; CO2 at 90 °C
Water vapor isotherms on 13X [Fig. 3 (a)] show a steep rise of water adsorption at low partial pressure(0.2 kPa) followed by the characteristic plateau indicative of the high microporosity and low mesoporosity. Condensation in the mesopores eventually results in a slight rise at near saturation pressure [19].The desorption curve exhibits a small hysteresis loop throughout the adsorption region as it is difficult to desorb water vapor only through vacuum and a small chemisorbed portion remains. Even if at high temperatures [Fig. 3 (b)], the isotherms of water adsorption on 13X are still rather steep with high water adsorption amounts. That is why it is necessary to deal with the moisture before feed gas flows into 13X zone.
The adsorption isotherms for CO2and N2on F200 and Sorbead WS are shown in Fig. 4. Clearly,compared with 13X, the two sorbents can only adsorb a small quantity of CO2. Therefore, they do not provide much ports of CO2separating capability. However, it is important to note that while the CO2capacity is low,it is not zero and hence some small amount of CO2capture is provided. Especially in terms of Sorbead WS, the N2adsorption amount on it is too small to not be neglect, and thus Sorbead WS can provide super good separation selectivity between N2and CO2.

Figure 3 Isotherms of water vapor onto 13X at (a) 25 °C(P0=3.166 kPa) and (b) 40 and 60 °C

Figure 4 Isotherms of CO2 and N2 onto Sorbead WS and F200 at different temperatures
For water adsorption on activated alumina F-200[Fig. 5 (a)], it shows that F200 has great potential in H2O adsorption at high water partial pressure (around 25 mol·kg-1at saturated pressure). However, there is a small water adsorption capacity when the water partial pressure is relative low. Such sort of shape (type II)means excellent candidate applied in vacuum swing adsorption process in which adsorption and desorption steps occur in turns at different pressure. The mechanism of water adsorption on activated alumina is quite clear. The adsorption is mainly due to hydrogen bonding with the surface hydroxyl groups and some fraction of chem-sorption or quasi-chemisorption by compensating surface ionic defects [20-22].
On the other hand, the water isotherm on Sorbead WS adsorbent [Fig. 5(b)] is of type IV and shows a steady and quick increase of water loading as the increase of pressure. From the shape of the isotherm it is known that Sorbead WS is also a good desiccant in water removal by VSA. The difference from F200 is the water adsorption trend towards stability as water partial pressure approaches to the saturated values,since it is much steeper in F200. Therefore, both two adsorbents are in principle suitable to be as pre-layers for water removal.
Another comparison between the two water resistant adsorbents in Fig. 5 (c) shows that Sorbead WS has higher adsorption capacity than F200 at low temperature, but the water holding ability decreases a little when temperature increases. Moreover, H2O loading on Sorbead WS decreases as the increase of adsorption temperatures, while H2O isotherms on F200 almost merge to one line at different adsorption temperatures.
Most importantly, the two models can be well applied into our in-house simulator MINSA to simulate the double-layered CO2capture from flue gas containing high level of moisture.
3.2 Temperature migration inside the bed

Figure 5 Isotherms of water vapor on (a) Sorbead WS and (b) F200 at different temperatures (Solid spots: experimental data;Hollowed line: model fitted data), and (c) A comparison by putting the isotherms together with dimensionless P/P0 as abscissa
The thermal profile contour plot of feed time and dimensionless column length of Sorbead WS double-layer case drawn by MATLAB is shown in Fig. 6. Because the temperature migration in F200 case has similar profiles as the Sorbead WS one, it is no need to show another figure of F200 here.
A quick temperature rise can be seen at the very first 120 s adsorption step. There is no any huge temperature rise at the bottom bed that corresponds to the position of pre-layer. Thus, it can be concluded that water vapor has been successfully stopped at the pre-layer zone. To be mentioned, a part of distinguished temperature increase occurs at the cycle of 450 s that corresponds to the product purge step. Product purge in VSA process is crucial for the purity improvement.During the last 300 s desorption and equalization step,the whole column is cooling down by the CO2and H2O desorption. Especially at the pre-layer zone, it shows the lowest temperature, indicating that water has been mostly desorbed from the bed.
3.3 CO2 and H2O distribution

Figure 6 Temperature swing profiles along the column during feed step within a 6-step CSS cycle
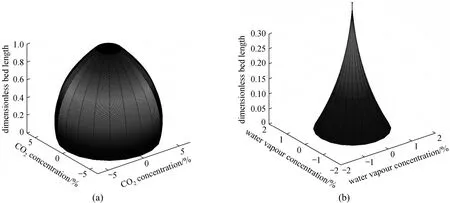
Figure 7 Three-D contour plot of (a) CO2 distribution along the adsorption bed, (b) H2O distribution at the pre-layer zone of the double layer experiment
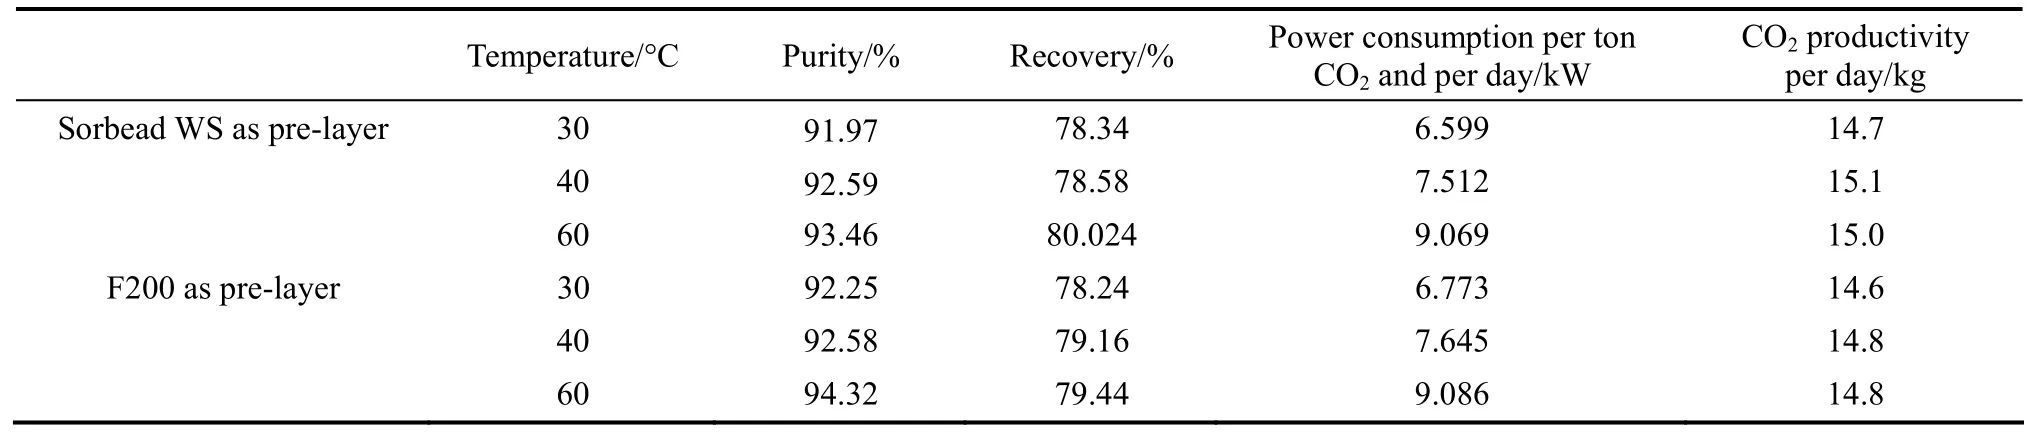
Table 5 Comparison of CO2-VSA processing performance by Sorbead WS and F200 as pre-layers
Two three dimensional cone shape CO2and H2O distribution figures along the adsorption bed drawn by MATLAB in the case of Sorbead WS double-layer VSA are depicted in Fig. 7. As shown in Fig. 7 (a),when the cycles reach to steady state, CO2concentration at pre-layer zone stays at around 12% with only a tiny decrease because of the trace amount of CO2adsorption by Sorbead WS. However, CO2dropped linearly at main-layer zone for the adsorption by 13X.The H2O distribution inside the pre-layer zone [Fig. 8(b)] also shows most of the water was stopped at the bottom of the bed. The F200 case has a similar distribution shape. Thus, our double-layered method is fabulous to solve the water issues by separating moistures and capturing CO2simultaneously.
3.4 Cyclic process results
Comparison of CO2capture performance by Sorbead WS and F200 as pre-layer is shown in Table 5. A high CO2capture performance (purity over 92% and recovery around 80%) has been obtained. Results under different temperature show that higher temperature is slightly beneficial for improving CO2purities, recoveries and productivity, but more power consumptions are needed. Compared with Sorbead WS, energy consumption using F200 as pre-layer is slight higher and more water-resistant adsorbent is required. Both of Sorbead WS and F200 is good candidate applied as pre-layer materials in the multi-layered CO2capture method.
3.5 Adsorption heat
Adsorption heat (calculated by Clausius-Claperyron model) for H2O adsorption on Sorbead WS (31000 J·mol-1) is similar to silica gel (28000 J·mol-1) [23]when H2O loading is 8.3 mol·kg-1. The adsorption heat for H2O on F200 at the same water loading is low(20000J/mol). However, adsorption heat is very high(55000 J·mol-1) on F200 compared with Sorbead WS(25000 J·mol-1) at a small amount of H2O loading.Also, calculations showed that the adsorption heat of water on Sorbead WS varies strongly with water loading from 49.4 to 58.6 kJ·mol-1as the water loading increases from 0 to 20 mol·kg-1.
4 CONCLUSIONS
In this work, multiple layered CO2-VSA processes were simulated to examine CO2capture performance from wet flue gas. Isotherms of CO2, N2on 13X showed excellent capacity in CO2separation, and H2O isotherms on 13X demonstrated the vital effect of moisture on 13X. At the same time, water adsorption equilibrium on Sorbead WS and F200 indicated perfect water removal capacity of them in a VSA system.Also, water isotherms on F200 and Sorbead WS can be well fitted by LBET model and extended CMMS equations, and most importantly, they can be added into MINSA to simulate water adsorption behaviours.Temperature profiles and water distribution inside the adsorption bed indicated that the water vapor has been successfully held in the pre-layer zone. Through simulated experiments, it was found that the double layered 9-step VSA process was capable of producing over 91% CO2purity with a recovery around 80%from a stream of 12% CO2and 10% H2O. Future challenges will reside in further optimization of the process to improve further the CO2capture performance and increase the CO2purity to exceeding 95%.
1 McKibbin W.J., Shackleton, R., Wilcoxen, P.J., “What to expect from an international system of tradable permits for carbon emissions”,Resource and Energy Economics, 21 (3), 319-346 (1999).
2 Anderson, S., Newell, R., “Prospects for carbon capture and storage technologies”, Annual Review of Environment and Resources, 29,109-142 (2004).
3 Zhang, Z., Ruan, H., Zhou, Y., Su, W., Sun, Y., Zhou, L., “A research note on the adsorption of CO2and N2”, Chin. J. Chem. Eng., 19 (5),733-737 (2011).
4 Li, G., Xiao, P., Webley, P., Zhang, J., “Capture of CO2from high humidity flue gas by vacuum swing adsorption with zeolite 13X”,Adsorption, 14, 415-422 (2008).
5 Saha, D., Deng, S., “Adsorption equilibria and kinetics of carbon monoxide on zeolite 5A, 13X, MOF-5, and MOF-177”, J. Chem.Eng. Data, 54, 2245-2250 (2009).
6 Wang, J., Zhang, Y., Ma, Y., Li, H., Tang, T., “adsorption equilibrium of ethylene-carbon dioxide mixture on zeolite ZSMS and its correlation”, Chin. J. Chem. Eng., 7 (2), 208-215 (1992).
7 Zhang, J., Xiao, P., Li, G., Webley, P., “Effect of flue gas impurities on CO2capture performance from flue gas at coal-fired power stations by vacuum swing adsorption”, Energy Procedia, 1, 1115-1122(2009).
8 Cortés, F.B., Chejne, F., Carrasco-Marín, F., Moreno-Castilla, C.,Pérez-Cadenas, A.F., “Water adsorption on zeolite 13X: comparison of the two methods based on mass spectrometry and thermogravimetry”, Adsorption, 16 (3), 141-146 (2010).
9 Serbezov, A., “Adsorption equilibrium of water vapor on F-200 activated alumina”, J. Chem. Eng. Data, 48, 421-425 (2003).
10 Yang, H.J., Fan, S.S., Lang, X.M., Wang, Y.H., Nie, J.H., “Economic comparison of three gas separation technologies for CO2capture from power plant flue gas”, Chin. J. Chem. Eng., 19 (4), 615-620(2011).
11 Takamura, Y., Narita, S., Aoki, J., Hironaka, S., Uchid, S., “Evaluation of dual-bed pressure swing adsorption for CO2recovery from boiler exhaust gas”, Sep. Purif. Technol., 24, 519-528 (2001).
12 Webley, P.A., He, J., “Fast solution-adaptive finite volume method for PSA/VSA cycle simulation; 1 single step simulation”, Comput.Chem. Eng., 23, 1701-1712 (2000).
13 Todd, R.S., Ferraris, G.B., Manca, D., Webley, P.A., “Improved ODE integrator and mass transfer approach for simulating a cyclic adsorption process”, Comput. Chem. Eng., 27, 883-892 (2003).
14 Rutherford, S.W., “Probing the mechanism of water adsorption incarbon micropores with multitemperature isotherms and water pre-adsorption experiments”, Langmuir, 22 (24), 9967-9975 (2006).
15 Li, G., Xiao, P., Webley, P., “Binary adsorption equilibrium of carbon dioxide and water vapor on activated alumina”, Langmuir, 25,10666-10675 (2009).
16 Siripatrawan, U., Jantawat, P., “Determination of moisture sorption isotherms of jasmine rice crackers using BET and GAB models”,Food Sci. Technol. Int., 12, 459-467 (2006).
17 Timmermann, E.O., Chirife, J., Iglesias, H.A., “Water sorption isotherms of foods and foodstuffs: BET or GAB parameters?”, Journal of Food Engineering, 48, 19-31 (2001).
18 Sircar, S., Cao, D.V., “Review: Heat of adsorption”, Chem. Eng.Technol., 25, 945-948 (2002).
19 Schoenab, M., Gunthera, G., “Capillary condensation in deformable mesopores: wetting versus nanomechanics”, Molecular Physics, 18,1-13 (2010).
20 Desai, R., Hussain, M., Ruthven, D.M., “Adsorption of water vapor on activated alumina, I—equilibrium behaviour”, Can. J. Chem.Eng., 70, 699-706 (1992).
21 Kotoh, K., Enoeda, M., Matsui, T., Nishikawa, M., “A multilayer model for adsorption of water on activated alumina in relation to adsorption potential”, J. Chem. Eng. Jpn., 26, 355-360 (1993).
22 Zheng, Z.Z., Ruan, H.Z., Zhou, Y.P., Su, W., Sun, Y., Zhou, L., “A research note on the adsorption of CO2and N2”, Chin. J. Chem. Eng,19 (5), 733-737 (2011).
23 Li, P., Tezel, F.H., “Equilibrium and kinetic analysis of CO2-N2adsorption separation by concentration pulse chromatography”, Journal of Colloid and Interface Science, 313, 12-17 (2007).
猜你喜欢
杂志排行

Chinese Journal of Chemical Engineering的其它文章
- Adsorption and Desorption of Praseodymium (III) from Aqueous Solution Using D72 Resin*
- Reactive Distillation for Producing n-Butyl Acetate: Experiment and Simulation
- One Step Bioleaching of Sulphide Ore with Low Concentration of Arsenic by Aspergillus niger and Taguchi Orthogonal Array Optimization*
- Adsorption of Chlortetracycline from Water by Rectories*
- Optimization of Fermentation Media for Enhancing Nitrite-oxidizing Activity by Artificial Neural Network Coupling Genetic Algorithm*
- Effect of Propanoic Acid on Ethanol Fermentation by Saccharomyces cerevisiae in an Ethanol-Methane Coupled Fermentation Process*