The Use of CT Perfusion to Determine Microvessel Density in Lung Cancer: Comparison with FDG-PET and Pathology
2011-07-18NingXingZulongCaiShaohongZhaoLiYangBaixuanXuFulinWang
Ning Xing, Zu-long Cai*, Shao-hong Zhao, Li Yang, Bai-xuan Xu, Fu-lin Wang
1Department of Radiology,2Department of Nuclear Medicine,3Department of Pathology, China PLA General Hospital, Beijing 100853, China
The Use of CT Perfusion to Determine Microvessel Density in Lung Cancer: Comparison with FDG-PET and Pathology
Ning Xing1, Zu-long Cai1*, Shao-hong Zhao1, Li Yang1, Bai-xuan Xu2, Fu-lin Wang3
1Department of Radiology,2Department of Nuclear Medicine,3Department of Pathology, China PLA General Hospital, Beijing 100853, China
Objective:To investigate the validity of CT perfusion in assessing angiogenic activity of lung cancer.
Methods:Fifty-six patients with lung cancer scheduled for elective surgical resection received 16-slice helical CT perfusion imaging. Time-density curve (TDC), blood flow (BF), blood volume (BV), mean transmit time (MTT) and permeability surface area product (PS) were calculated. 18F-deoxyglucose-positron emission tomography (FGD-PET) was carried out in 14 out of the 56 patients to calculate standardized uptake values (SUVs). Tumor microvessel density (MVD) was examined using CD34 immunohistochemical staining of the resected tumor tissue. Pearson’s correlation analysis was used to evaluate potential correlation between CT perfusion parameters and MVD or SUV.
Results:Average time to peak height (TPH) of the TDCs (including two types of TDC) was 24.38±5.69 seconds. Average BF, BV, MTT and PS were 93.42±53.45 ml/100g/min,93.42±53.45 ml/100g,6.83±4.51 s and 31.92±18.73 ml/100g/min, respectively. Average MVD was 62.04±29.06/HPF. The mean SUV was 6.33±3.26. BF was positively correlated with MVD (r=0.620,P<0.01) and SUV (r=0.891,P<0.01). PS was also positively correlated with SUV (r=0.720,P<0.05). A positive correlation was also observed between tumor MVD and SUV (r=0.915,P<0.01).
Conclusions:CT perfusion imaging is a reliable tool to evaluate the tumor neovascularity of lung cancer.
Computed tomography (CT); Perfusion; Positron-emission tomography (PET); Lung cancer; angiogenesis
INTRODUCTION
Tumor angiogenesis plays an important role in tumor growth and metastasis. Positron-emission tomography (PET) imaging, using18F-deoxyglucose (FDG), is useful in analyzing neoplastic angiogenesis[1]. However, PET is costly and timeconsuming. In the current study, we examined the feasibility of using CT perfusion imaging to assess cancer angiogenesis. Results obtained with CT perfusion and FDG-PET were compared to each other, and analyzed against microvessel density MVD in resected tumor samples.
MATERIALS AND METHODS
Patients
Fifty-six lung cancer patients (40 male and 16 female, mean age: 57.5 years, range: 18-90) scheduled for surgical resection111111were included in the study. Patients with diabetes or abnormal glucose tolerance test were excluded. A pathological diagnosis of lung cancer was established after the surgery in all cases: 16 patients had squamous cell carcinoma, 31 had adenocarcinoma, 6 had small cell carcinoma, and the remaining 3 had large cell carcinoma. Average lesion size was 2.4 cm (range: 1.8-3.0).
CT Perfusion and FDG-PET Imaging
After a preliminary scan that determined the optimal layer, dynamic CT scanning was carried out using a LightSpeed16 CT scanner. A high-pressure syringe was used to deliver 40 ml of a non-ionizing contrast agent (Ultravist 300, 300 mg I/ml) into the antecubital vein at a flow rate of 4 ml/s. The slice thickness was 5 mm. Exposure was carried out every 2 s, with four images for each exposure. The scanning began at 5 s after the contrast agent injection started. The entire scanning lasted for 2 min, with a total 240 images. The scanning was conducted at 120 kV and 50 mAs.
CT images were reconstructed using a 10-mm slice thickness. Data were transferred onto an AW 4.2 workstation (GEMS) and analyzed with the GE Perfusion 3 software. Time-density curves (TDC) were built. BF, BV, MTT, and PS were calculated.
Immunohistochemical Analysis
The expression of CD34 and MMP22 in tumor tissue samples was examined using a immunohistochemical method with a monoclonal mouse anti-human CD34 antibody (clone JH121) and monoclonal mouse anti-human MMP22 antibody (clone MAB903) from Beijing Zhongshan Biotechnology, respectively. Histostain TM2 plus kit was also provided by Beijing Zhongshan Biotechnology.
The number of CD34-positive cells was used to reflect MVD according to the Weidener method[2]. All single cells or cell masses stained by the CD34 antibody were counted as long as they were clearly separated from the surrounding microvessels, tumor cells, or connective tissue component, regardless of their location relative to the vessel lumen. The diameter of the vessels was 0.02-0.1 mm. Vessels with thick smooth muscle walls and lumen diameters in excess of eight red blood cells were excluded. For each sample, three fields with the highest number of microvessels were selected under low magnification (100x). The number of microvessels was then counted under 200x magnification. The average number of the three fields was used to reflect MVD.
Statistical Analysis
Perfusion parameters and MVD were analyzed using Student’s t-test. Potential correlation among the measures was analyzed with Pearson’s correlation test. P<0.05 was considered statistically significant. All statistical analyses were performed using a SPSS18 software.
RESULTS
Analysis of the TDC
The time to the peak height (TPH) of 56 lesions was 20.63±3.17 s (range: 15~29). There were two types of TDC. Type I (38 lesions) had a steep ascending phase, a peak, and a slow descending phase (Figure 1a); type II (18 lesions) had a steep ascending part, a peak, but no apparent descending phase (Figure 2a). The parameters and MVD of the lesions of the different TDC types are listed in Table 1.
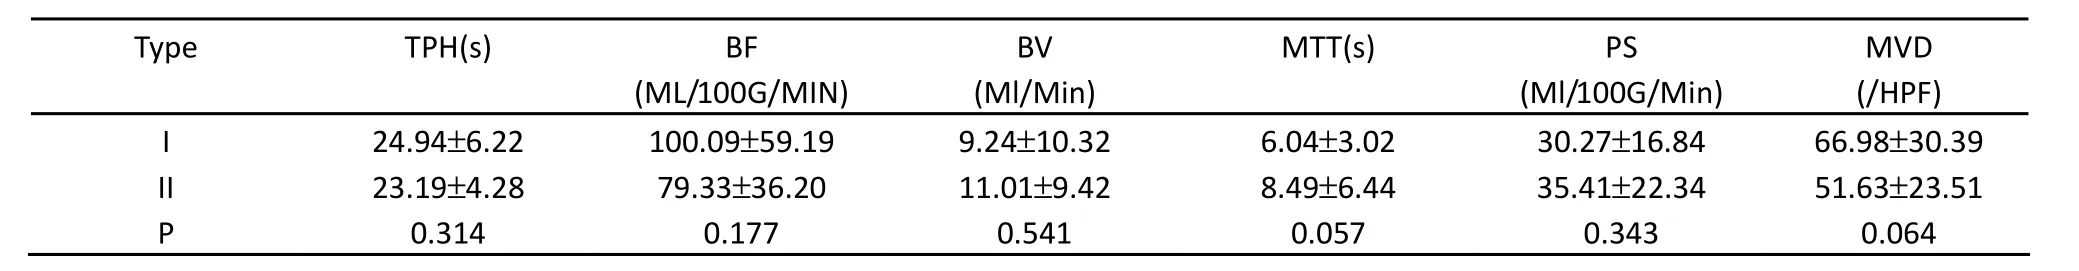
Table 1.TPH, erfusion parameters and MVD of lesions with different types of TDC.
The Perfusion Parameters and MVD
The perfusion parameters and MVD are shown in Table 2 and Figures 1b-f, 2b-f. MVD was significantly higher for adenocarcinoma than squamous cell carcinoma (73.89±28.06 /HPF vs. 52.68±27.08 /HPF, t=15.623,P<0.01; Figure 1g, 2g). The average SUV of the 14 lesions in the patients received FDG-PET imaging was 6.33±3.26 (range: 1.7~12.5; Figure 1h, 2h).

Table 2.Perfusion parameters and MVD in patients with different types of lung cancer
Correlations between Perfusion Parameters, SUV, and MVD
Correlations between perfusion parameters, SUV, and MVD are shown in Table 3. BF correlated positively with both MVD (r=0.620,P<0.01) and SUV (r=0.891,P<0.01). PS was also positively correlated with MVD (r=0.587,P<0.01) and SUV (r=0.720,P<0.05). Positive correlation was demonstrated between tumor MVD and SUV (r=0.915,P<0.01).

Table 3.Correlation coefficients between perfusion parameters and MVD/SUV
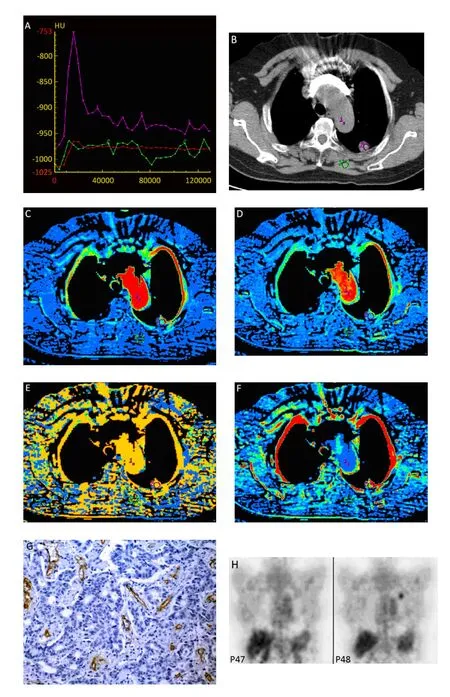
Figure 1.A 48-year-old female patient with mid-high differentiated adenocarcinoma in the left upper lobe. A, Type I TDC a steep ascending phase and slow descending phase. Curve 1: aorta; curve 2: the lesion; B, show the lesion in the left upper lobe in mediastinal window. C, BF=76.12 ml/100g/min; D, BV=8.92 ml/100g; E, MTT=6.92s; F, PS=22.8 ml/100g/min; G, FDG-PET, SUV=1.7; H, CD34 immunohistochemical staining (x200). Arrow: microvessels. MVD=47/HPF (0.74 mm2)

Figure 2.A 56-year old female patient with adenocarcinoma in the left upper lobe. A, type II TDC: a steep ascending phase with no descending phase. Curve 1: aorta; curve 2: the lesion; B show the lesion in the left upper lobe in mediastinal window. C, BF=97.45 ml/100g/min; D, BV=8.34 ml/100g; E, MTT=6.62 s; F, PS=40.50 ml/100g/min; G, FDG-PET showing increased FDG uptake (SUV=7.07). H, CD34 immunohistochemical staining (x200). Arrow: microvessels. MVD=97.6/HPF (0.74 mm2).
DISCUSSION
For solid tumors, angiogenesis is the basis for tumor growth, invasion, and metastasis[3,4]. Non-invasive functional imaging technology has become a routine means to improve clinical assessment and follow-up in lung cancer patients. SPECT and PET could be used to evaluate tumor metabolism and microcirculation, and therefore are useful in the diagnosis of lung cancer and lymph node metastasis. However, the spatial resolution of SPECT and PET is relatively low. In addition, these techniques are costly and time-consuming.
CT imaging of angiogenesis is based on transportation of intravascular iodine contrast agents into tumor tissues and the exchange of the contrast agents between the intra- and extra-space of blood vessels through diffusion. Enhancement of tissues and blood vessels can be achieved using currently available fast CT scanners[5]. Detailed distribution of contrast agents in the tissue could be obtained using small-time interval scanning[6].
For tumors with abundant neovessels, the contrast agent appears in mirovessels firstly, and then distributes to the extravessel space. As a result, the TDC consists of a fast ascending phase prior to the peak. The descending phase reflects circumfluence through the venules and lymphatic vessels. In a small but significant proportions of the lesions in the current study, TDC was devoid of a descending phase, possibly due to obstruction of the circumfluence venules and lymphatic.
Consistent with a previous study[6], we found significantly higher MVD in adenocarcinoma than in squamous cell carcinoma.
Increased MVD reflects increased perfusion and capillary permeability and is often associated with a significant enhancement of malignant nodules. In fact, several studies have shown that the enhancement of dynamic CT in lung cancer positively correlates with MVD[7-9]. In our study, BF of the lesions was positively correlated with MVD. Such a finding is consistent with previous reports by Ma et al[10].
Miles et al[11]have shown that the perfusion values of pulmonary nodules obtained from dynamic CT are positively correlated with SUV obtained from PET. Our results demonstrated that SUV is positively correlated with BV and PS. Tumor perfusion and glucose metabolism are distinct physiological processes with intimate interaction. The promotion of tumor angiogenesis and glucose metabolism by p53 tumor gene expression is often observed in many malignant tumors, including lung cancer[12]. Our results confirmed that SUV obtained from PET is positively correlated with MVD. With wide basement membrane space, tumor neovessels are highly permeable to macromolecules. Therefore, it is likely that perfusion and capillary permeability reflect the physiological changes in the microstructures that are associated with tumor angiogenesis. A previous study by Tateishi et al[13]demonstrated that SUV is positively correlated to peak enhancement of lung cancer, relative BF and MVD. Our findings added support to their conclusion.
In summary, the current study demonstrated CT perfusion parameters are highly correlated with MVD and SUV in patients with lung cancer. In addition, CT perfusion could provide accurate anatomical details than PET due to higher spatial resolution.
REFERENCES
1. Provenzale JM. Imaging of angiogenesis: clinical techniques and novel imaging methods. AJR Am J Roentgenol 2007; 188: 11-23.
2. Weidner N. Tumor vascularity and proliferation: clear evidence of a close relationship. J Pathol 1999; 189: 297-9.
3. Lee TY, Purdie TG, Stewart E. CT imaging of angiogenesis. Q J Nucl Med 2003; 41: 171-87.
4. Li Y, Yang ZG, Chen TW, et al. Whole tumor perfusion of peripheral lung carcinoma: evaluation with first-pass CT perfusion imaging at 64-detector row CT. Clin Radiol 2008; 63: 629-35.
5. Ng, QS Goh V. Angiogenesis in non-small cell lung cancer: Imaging with perfusion computed tomography. J Thorac Imaging 2010; 25: 142-50.
6. WU J, LI W, Tan Q, et al. The relationship among CT appearances and dynamic enhancement and microvessel density of peripheral lung cancer. Zhongguo Fei Ai Za Zhi (in Chinese) 2003; 6: 30-4.
7. Tateishi U, Nishihara H, Watanabe S, et al. Tumor Angiogenesis and Dynamic CT in Lung Adenocarcinoma: Radiologic- Pathologic Correlation. J Comput Assist Tomogr 2001; 25: 23-7.
8. Yi CA, Lee KS, Kim EA, et al. Solitary pulmonary nodules: dynamic enhanced multi–detector row CT study and comparison with vascular endothelial growth factor and microvessel density. Radiology 2004; 233: 191-9.
9. Ma SH, Le HB, Jia Bh, et al. Peripheral pulmonary nodules: Relationship between multi-slice spiral CT perfusion imaging and tumor angiogenesis and VEGF expression. BMC Cancer 2008, 8: 186.
10. Ma SH, Xu K, Xiao ZW, et al. Peripheral lung cancer: relationship between multi-slice spiral CT perfusion imaging and tumor angiogenesis and cyclin D1 expression. Clin Imaging 2007; 31: 165-77.
11. Miles KA, Griffiths MR, Fuentes MA. Standardized perfusion value: universal CT contrast enhancement scale that correlates with FDG PET in lung nodules. Radiology 2001; 220: 548-53.
12. Vermeulen PB, Roland L, Mertens V, et al. Correlation of intratumoral microvessel density and p53 protein overexpression in human colorectal adenocarcinoma. Microvasc Res 1996; 51: 164-74.
13. Tateishi U, Nishihara H, Tsukamoto E, et al. Lung tumors evaluated with FDG-PET and dynamic CT: the relationship between vascular density and glucose metabolism. Comput Assist Tomogr 2002; 26: 185-90.
10.1007/s11670-011-0118-z
patients
FDG-PET imaging using a Siemens ECAT EXACT HR+ PET scanner: three patients had squamous cell carcinoma, nine had adenocarcinoma, and theremaining two had small cell carcinoma. Patients were fasted for 4 h prior to FDG-PET scanning.18F-deoxyglucose was intravenously injected at a dose of 5.55 mBq/kg (0.15 mCi/kg). Image information was collected from 2-3 beds at 10 min/bed using 35% transmission scanning time. Image reconstruction was performed using an OSEM iterative method. Regions with increased FDG uptake were outlined as regions of interest (ROI), and used to calculate SUV. Abnormal foci were evaluated by three experienced radiologists.
Received2010-12-09;Accepted2011-03-23
This work was supported by grants from The National Key Technology R&D Program of China(No. 2009BAI86B00),Research in the Special Needs of Critical Care Technology and Equipment(No. 2009BAI86B05); PLA General Hospital Nursery Fund (No. 09KMM38).
*Corresponding author.
E-mail: caizl-l@163.net
©Chinese Anti-Cancer Association and Springer-Verlag Berlin Heidelberg 2011
杂志排行

Chinese Journal of Cancer Research的其它文章
- Effects of an Engineered Anti-HER2 Antibody chA21 on Invasion of Human Ovarian Carcinoma Cell In Vitro
- Reduction of Plasma MicroRNA-21 is Associated with Chemotherapeutic Response in Patients with Non-small Cell Lung Cancer
- Immediate Versus Delayed Treatment with EGFR Tyrosine Kinase Inhibitors after First-line Therapy in Advanced Non-small-cell Lung Cancer
- DNA Repair Gene Polymorphisms in the Nucleotide Excision Repair Pathway and Lung Cancer Risk: A Meta-analysis
- Clinical Impact of t(14;18) in Diffuse Large B-cell Lymphoma
- Over-expression of Metastasis-associated in Colon Cancer-1 (MACC1) Associates with Better Prognosis of Gastric Cancer Patients