Effect of Boundary Layers on Polycrystalline Silicon Chemical Vapor Deposition in a Trichlorosilane and Hydrogen System*
2011-05-15ZHANGPan张攀WANGWeiwen王伟文CHENGGuanghui陈光辉andLIJianlong李建隆
ZHANG Pan (张攀), WANG Weiwen (王伟文), CHENG Guanghui (陈光辉) and LI Jianlong(李建隆),**
Effect of Boundary Layers on Polycrystalline Silicon Chemical Vapor Deposition in a Trichlorosilane and Hydrogen System*
ZHANG Pan (张攀)1, WANG Weiwen (王伟文)2, CHENG Guanghui (陈光辉)2and LI Jianlong(李建隆)2,**
1Institute of Electronmechanical Engineering, Qingdao University of Science and Technology, Qingdao 266061, China2Institute of Chemical Engineering, Qingdao University of Science and Technology, Qingdao 266042, China
This paper presents the numerical investigation of the effects of momentum, thermal and species boundary layers on the characteristics of polycrystalline silicon deposition by comparing the deposition rates in three chemical vapor deposition (CVD) reactors. A two-dimensional model for the gas flow, heat transfer, and mass transfer was coupled to the gas-phase reaction and surface reaction mechanism for the deposition of polycrystalline silicon from trichlorosilane (TCS)-hydrogen system. The model was verified by comparing the simulated growth rate with the experimental and numerical data in the open literature. Computed results in the reactors indicate that the deposition characteristics are closely related to the momentum, thermal and mass boundary layer thickness. To yield higher deposition rate, there should be higher concentration of TCS gas on the substrate, and there should also be thinner boundary layer of HCl gas so that HCl gas could be pushed away from the surface of the substrate immediately.
boundary layer, polycrystalline silicon, numerical simulation, mass diffusion
1 INTRODUCTION
Chemical vapor deposition (CVD) is a synthesis process of the deposition of a solid on a heated surface from a chemical reaction in the vapor phase. With CVD, it is possible to produce most metals, many nonmetallic elements such as carbon and silicon as well as a large number of compounds including carbides, nitrides, oxides and many others. The CVD technology integrates several scientific and engineering disciplines including thermodynamics, plasma physics, kinetics, fluid dynamics, and of course chemistry. In order to understand the complex transport phenomena, various types of reactor configurations such as horizontal reactor [1], impinging jet and rotating disk reactor [2], pancake reactor [3], and vortex enhanced reactor [4] have been investigated. The effects of many factors on the deposition characteristics of a CVD reactor were also discussed, such as the choice of precursor gases and carrier gas [5], their respective flow rates [6], the total pressure in the reactor [7], the substrate temperature [8, 9], the substrate position [10], the substrate geometry [11, 12], the substrate rotation rate [13], and the tilted substrate [14, 15].
Many researchers paid more attention to the effects of the macroscopical structure of the reactors, but the effects of the boundary layer characteristics at the substrate in the deposition process were less addressed in the CVD reactor. The rate-limiting step of a CVD reactor is generally determined either by the surface reaction kinetics or by mass transport [16-18]. When the process is limited by mass-transport phenomena, the controlling factors are the diffusion rate of the reactant through the boundary layer and the diffusion out of the gaseous by-products through this layer. Thus the boundary layer characteristics have vital effect on the CVD of polycrystalline silicon.
It has been recognized that numerical models based on computational fluid dynamics (CFD), accounting for the interaction between gas flow, heat and mass transfer and chemical reactions, can be of great help in the optimization of CVD equipment and processes. Besides, CVD numerical models may provide fundamental insights into the underlying physico-chemical processes. In last few decades, many numerical studies of CVD processes have been performed, which can be roughly divided into tow categories: (1) CVD reactor studies (as those mentioned above), in combination with rather simple descriptions of the CVD chemistry; (2) CVD chemistry studies [19-22], in combination with simple 0-dimensional (0-D) or 1 dimensional (1D) hydrodynamic models. Recent years, enabled by the ever increasing computer performance, it has become possible to combine detailed descriptions of transport phenomena and reaction chemistry into a single computational model [23]. But for the trichlorosilane (TCS)-hydrogen system, it is still a challenge.
In this study, a two-dimensional model for the gas flow, heat transfer, and mass transfer was coupled to the detailed mechanism of gas-phase reaction and surface reaction for the deposition of polycrystalline silicon from TCS-hydrogen system. The model was used to study the boundary layer characteristics in three CVD reactors with a flat substrate, a tilted substrate and an additional rib placed on the upper wall, respectively, and investigate the effects of the boundary layer characteristics on the polycrystalline silicon deposition rate, and the uniformity of the deposited polycrystalline silicon in the TCS-H2system.
2 PHYSICAL MODEL
2.1 Reactor geometry
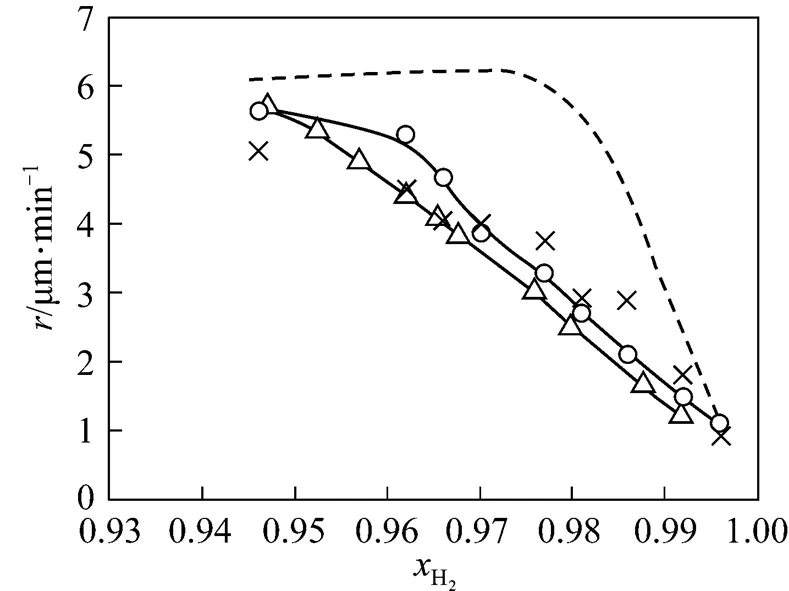
In view of computational costs, a two-dimensional (2-D) model coupled with gas phase reaction and surface reaction is considered for three CVD reactors illustrated in Fig. 1. The overall geometry of the model in Fig. 1 (a) is identical to that employed by Habuka[24]. In Fig. 1 (b), the substrate is tilted with an angle of 7°. In the third reactor in Fig. 1 (c), an additional rib is placed on the center of the upper wall. The dimension of the rib is 6 mm (width) ×10 mm (height). The three reactors have same overall dimensions, and the same conditions otherwise are imposed on them.

Figure 1 Geometry and internal structure of studied reactors
A mixture of TCS and H2enters the reactors at the top left corner and exits through the lower right corner. The substrate surface is held at a fixed temperature. The gases react in the reactors depositing the desired solid silicon film on the surface of the substrate. Finally, the reactant and product gases leave the reactors through the outlet, which is fixed at atmospheric pressure.
2.2 Transport models
As the deposition rate are strongly influenced by the complex transport phenomena of reacting mixtures in the CVD reactor, detailed computational modeling of the gas flow, temperature distribution and species transport in the reactor is of vital importance. The model of the three CVD reactors involves four primary governing equations: mass conservation (or continuity), momentum conservation, energy conservation, and species conservation. It describes the turbulent flow of an incompressible gas with properties that depend on the local temperature. With the above assumption, the governing equations can be expressed as follows:
Continuity equation:

Momentum equation:

Energy equation:

whereeffis the effective thermal conductivity coefficient (including the molecular and turbulent thermal conductivity). The effect of heat transfer by radiation on the substrate temperature is ignored. Since the concentrations of TCS and HCl are low, the effects of radiation heat on these gases are also assumed to be negligible. The last term on the right-hand side describes the consumption and production of heat due to the chemical reactions. Although for most CVD systems, especially when the reactants are highly diluted in an inert carrier gas, the heat of reactions has a negligible influence on the gas temperature distribution, the source term is accounted for in the simulation.
Mass equation:

whereis the diffusion flux of species. For thermal CVD, the relevant driving forces for diffusion are the concentration and temperature gradients. Since the mass fractions of all species must sum up to unity, this equation is solved for all species except the carrier gas H2. At steady-state, the transport of the reagent species to the substrate surface is balanced by the surface reaction rate. The deposition reaction is considered as a boundary condition on the species transport equation.
2.3 Chemical reaction
The knowledge of the detailed gas phase and surface chemistry involved in the deposition process is of fundamental importance. During the last years a great effort was devoted to the comprehension of the reactions involved in silicon deposition. We adopted TCS chemistry primarily because of the broad application of polycrystalline silicon [25-27]. TCS decomposition kinetics was compiled by Ho. [28], who pointed out that SiCl2has a high desorption rate and thus assumed TCS as the most important precursor. Valente. [29] analyzed the kinetics of the HCl and SiCl2adsorption and deposition, updating the original mechanism in Ref. [28]. The overall mechanism is taken from the literature and summarized in Table 1.
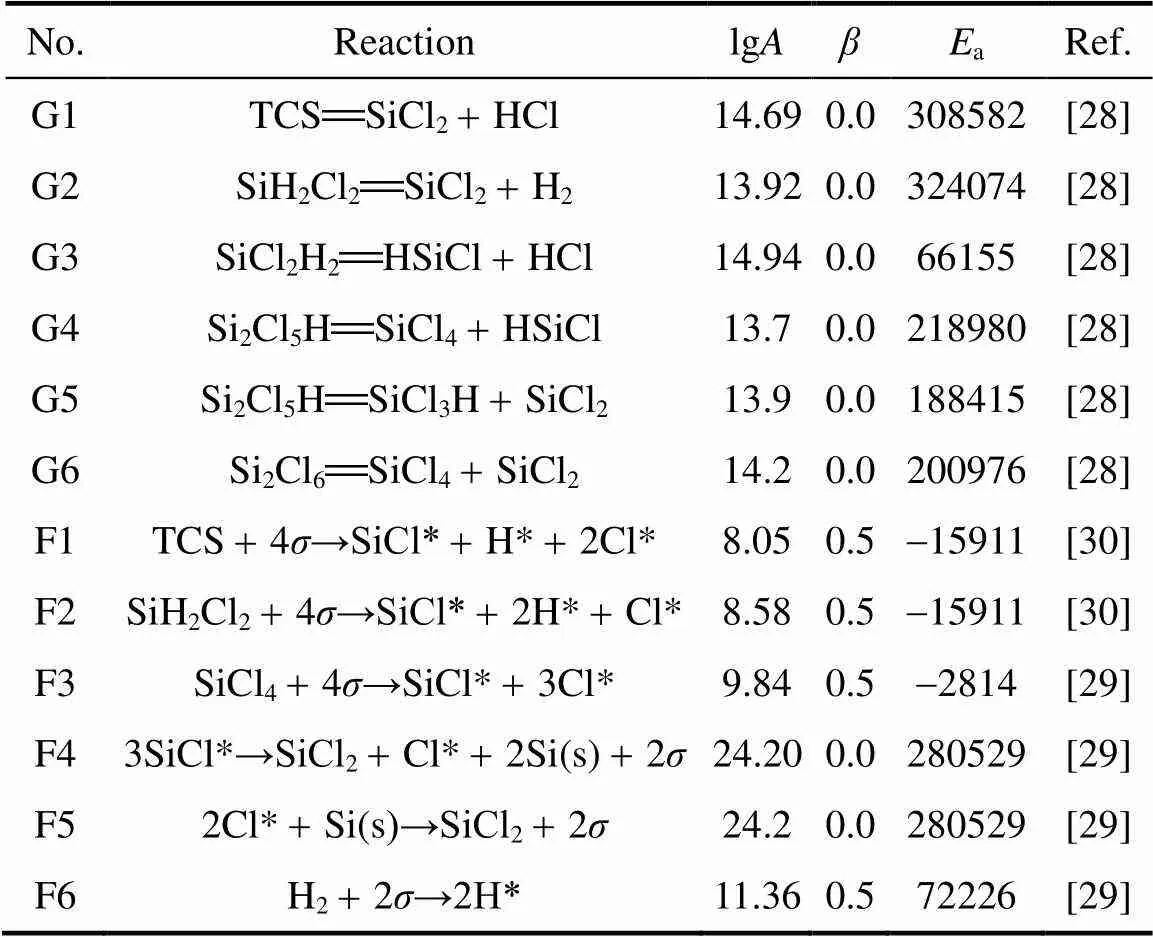
Table 1 The mechanisms of the chemical reactions and surface reactions in trichlorosilane and hydrogen system(G: gas-phase reaction, F: surface reaction)
The decomposition of TCS and SiH2Cl2are considered as the most important reactions in the gas-phase reaction mechanism. About the surface chemistry, three adsorbed species were considered: H*, Cl* and SiCl* [29]. All gaseous species adsorb dissociatively on the surface leading to the formation of adsorbed hydrogen and chlorine, and SiCl* through reactions.
2.4 Turbulent model and numerical method
Reynolds numbers in CVD reactors are usually quite low, and as a consequence the gas flow is assumed to be laminar [15, 31, 32]. But these low Reynolds numbers in combination with quite large temperature difference (up to 1000 K) can lead to significant interactions between forced and free convection in the CVD equipment. The mixed convection can be an important factor influencing heat, mass transfer and chemistry. van Santen. [33] found that turbulence can increases the heat flux, which offer the possibility for a high deposition rate. Thus, the low-Reynolds- number-turbulent model was used to simulate the turbulent transport [22].
The governing equations coupled with the boundary conditions have been solved using a commercially available software package FLUENT, which is based on the finite volume method (FVM) to discretize the non-linear partial differential equations of the model, and the segregated solution algorithm has been selected. For the pressure-velocity coupling, the SIMPLE (Semi-Implicit Method for Pressure-Linked Equations) method was used.
The geometry and the mesh are created using GAMBIT 2.2 starting from its primitives (shown in Fig. 1). Numerical tests are carried out using 2300, 4800 and 6600 cells to evaluate the effect of mesh size on the calculated results. Comparison of 4800 cells velocities estimates with 6600 cells estimates showed a mean relative difference of 0.87% and a root mean square difference of 2.8%. The computational grid is defined by hexahedral cells, non-uniformly distributed, with a total of 4800 cells.
Compared to the solution of the hydrodynamics problem, the solution of the accompanying chemical reactions is not a trivial task because it gives the important chemical source terms in the aforementioned governing equations. Especially for the surface reaction in the study, the transport process (diffusion) that carries species to and from the surface may be comparable in rate to that of reaction at the surface. Transport and reaction have to be solved simultaneously as a set of nonlinear algebraic equations at each node on the reacting surface. The numerical stiffness of the multi-dimensional multi-species transport coupled detailed CVD chemistry models leads to poor convergence, excessive computation time, and unreliable predictions.
Thus, computationally efficient methods are needed for simulating CVD reacting flows. Different numerical methods have been developed to solve these nonlinear equations introduced by the chemistry [34, 35]. Available approaches include direct integration (DI) in the FLUENT package, and DI is computationally expensive in CVD simulation.
The--adaptive tabulation (ISAT) method [36], which is an effective preconditioning technique, was used to implement detailed chemical kinetics. Since the chemical source term is computationally costly, a pre-computed chemical look-up table is calculated and stored for a set of representative initial conditions in the composition space. Then, numerical interpolation is used to find the values based on the neighboring points, replacing DI operation in the simulation.
The turbulence-chemistry interactions were computed by Eddy-Dissipation- Concept (EDC) model [37]. The results presented in this paper were obtained usingthe second order scheme for spatial discretization of the momentum equations and species transports equations. For pressure, linear discretization was used. A convergence criterion of 1×10⁻⁶was used for continuity, momentum, energy and species transport equations.
2.5 Boundary condition and gas properties
At the inlet, the velocity distribution is considered uniform; the gas feed is assumed to be uniform at 300 K. The mass fraction of the species in the inlet mixture is specified. A no-slip and an adiabatic or a temperature condition is imposed on the side walls, respectively as shown in Fig. 1 (a), and the substrate boundary is set to a constant temperature. A thermal conductivity of 204 W·m-1·K-1was applied for the susceptors.
Some reasonable simplifying assumptions have been made to reduce the complexity of the numerical problem: the gases, being highly diluted in hydrogen, obey the ideal gas law and Newton’s law of viscosity; the gaseous mixture behaves as continuum under steady state conditions; pressure variations in the energy equation are neglected as the Mach number is very small.
The viscosity and thermal conductivity of the gas species may be calculated from the kinetic theory. The coefficients of the specific heat capacity polynomial and the Lennard-Jones parameters (the characteristic energy and the collision diameter) were taken from Ref. [38].
Mixture gas density is estimated based on the ideal gas law [39, 40]:
The full multi-component diffusion model is used to calculate the ordinary diffusion, because the mass fraction of the hydrogen reagent species is too large for it to be considered dilute.
3 RESULTS AND DISCUSSION
3.1 Model validation
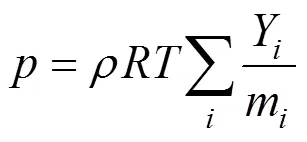
In order to ascertain proper functioning of the model, the operation conditions and boundary conditions applied by Habuka. [24] were used, so that the computed results can be compared with those obtained previously for the flat reactor [Fig. 1 (a)] [41].
The comparison between the average growth rates obtained from various models at the flat substrate is presented in Fig. 2. It can be derived that the model predicts the growth rate. More detailed can be seen in Ref. [42].


3.2 Velocity boundary layer
Some work [12, 32, 43, 44] revealed that the tilted susceptor can produce a greater deposition rate and a more uniform distribution of material than a non-tilted susceptor. Cheng and Hsiao [12] also concluded that the deposition rate can be improved if a rib was placed at the center of the susceptor. So we have selected the three reactors (shown in Fig. 1) to detect the effects of the various boundary layers on polycrystalline silicon CVD in the TCS-H2system. The follow results are obtained with the same boundary conditions at the three reactors, which were employed that an inlet velocity of 0.67 m·s-1, an inlet TCS mole concentration of 0.05, inlet temperature of 300 K, surface temperature of the substrate of 1398 K and the atmospheric pressure (as applied in [24]).
The deposition rates along the three substrates are shown in Fig. 3. The average deposition rates at tilted substrate and at the substrate in the rib reactor reach 8.0 and 10.4 μm·min-1, which are 1.5 and 1.9 times that at the flat substrate, respectively. The polysilicon deposition rate along the flat substrate is large firstly and then becomes smaller. For the tilted substrate and the substrate in the rib reactor, the variation trend of deposition rate is similar to that at the flat substrate. And there is a hump at the center at the substrate in the rib reactor. The growth rates at the tail section of the substrates are all decreasing, and that at tilted substrate sharply decrease. Generally, this difference in deposition rate is mostly considered due to a change in the velocity boundary layer thickness along the substrate [16, 45, 46]. The nominal boundary layer is thin at the beginning and increases along the substrate (qualitatively shown as Fig. 4), and it is the most thinnest at the center of the substrate with additional rib, that leads to a difference in the deposition rate as shown in Fig. 3.
And the velocity boundary layer characteristics can not explain the change of the deposition rate at the beginning and at the tail section of the substrates, but also not explain that the deposition rates at the tilted substrate and at the substrate with additional rib are higher than that at the flat substrate.

Figure 3 Comparison of polysilicon deposition rates along the substrate
☆ flat;■ rib;△ tilted
Figure 4 Velocity distributions in the three CVD reactors
3.3 Profiles of Nu number
It has been shown that the distribution of the local heat flux on the susceptor can be closely related to the growth rate and the uniformity of the deposition in the CVD reactor [12, 44]. Therefore, the local heat flux, in terms of Nusselt number (), on the heated substrate is calculated to identify the effects of the substrate tilting and the additional rib on the heat flux and the uniformity of deposition. Fig. 5 shows the comparison of the isotherm at the three CVD reactors. It can be seen that the tilted substrate and the additional rib result in thinner boundary layer and higher temperature gradient. The retardation of the growth thermal boundary layer and the increase of temperature gradient could yield an increased average heat flux. The computed Nusselt number distributions along the three substrates are shown in Fig. 6. It can be seen that the Nusselt numbers are large at the frontier and small at the tail section. This non-uniformity is due to the heat dissipation through the substrate, and the temperature decrease sharply along the substrates. This phenomenon can explain that the deposition rates are low at the frontier and the tail section.
We conclude that there is a similar trend between the deposition rate and the local heat flux along the substrate [Figs. 3 and 6 (b)]. The Nusselt numbers at the tail section of the substrate in the rib reactor are less than those at the same section of the tilted substrate. The deposition rate also has the same trend.
Comparisons of the computed results for the tilted substrate reveal that the converging channels is in favor of an increase of heat transfer as compared to a flat substrate. Moreover, this geometry can effectively improve the uniformity of heat flux distribution and deposition rate on the substrate. The uniformity of heat flux distribution at the substrate in the rib reactor is worse. But the addition of the rib enhances the heat flux on the substrate. The mean Nesselt numbers at the tilted substrate and at the substrate with rib are 90.2, 102.1, which are 1.99 and 2.25 times that at the flat substrate, respectively. The local heat transfer on the substrate is taken as a qualitative measure of the deposition rate, and the enhancement of heat transfer rate could lead to the improvement of deposition rate [12]. The results are consistent with the theory.
3.4 Mass transfer
However, this kind of understanding is not comprehensive enough. For these CVD systems, the diffusion rates of the reactant through the boundary layer and the diffusion out through this layer of the gaseous by-products have primary effect on the deposition progress. Habuka. [47] considered that transport of TCS molecules to the substrate surface plays a dominant role in the silicon epitaxial growth in the TCS-H2system and concluded that the dominant chlorosilane species in the system is TCS gas, whereas HCl gas is a major product in a TCS-H2system.

Figure 5 Computed isotherms in the three CVD reactors (unit of K)
Figure 6 Comparisons of the Nusselt numbers along the substrates

In order to investigate the mass boundary layers of the above main species, we defined the seven equidistant lines (named as a, b, c, d, e, f and g in Fig. 1) in the three reactors, respectively, which are from substrate to the upper wall, and perpendicular to the substrates. The molar concentration distributions of the two substances in the three reactors are shown in Figs. 7 and 8, respectively.
Figure 7 plots the molar concentration of TCS against the vertical position above the substrates. It can be seen that the thickness of the species boundary layer extends from about 10 mm to the entire channel in the so-called horizontal reactor. Furthermore, the molar fraction of TCS at the flat substrate is almost equal to zero especially at the b, c, d, e, f lines, and the value near the up wall reaches to 0.088, which is 1.6 times that at the inlet. This means that much of TCS gas was pushed away from the substrate and was condensed near the upper left wall. The results show that the deposition rate at these conditions is severely restricted by the diffusion rate of TCS.
But there is no such phenomenon in the other two reactors. The TCS molar faction in the two reactors is still less than 0.05, even though it begins to decrease until d line in the rib reactor. The boundary layer thickness of TCS on the substrate in the rib reactor is less than 10 mm until line e. The thickness at tilted substrate slowly increases from 7 mm to 12 mm along the substrate. Especially, the molar factions of TCS at these two substrates maintain a relatively higher value, which approach four times higher than that at the flat substrate. It is beneficial to TCS gas getting chemisorbed on the silicon substrate surface. The comparison between the TCS boundary layer thickness on the three substrates is shown in Fig. 9. The concentration gradient of TCS decreases due to the convergence of the tilted substrate at the tail section in the tilted reactor, rather than increases in the flat and rib reactors. The TCS boundary layer thickness has reverse variation trend with the deposition rate on the substrates.
Fig. 8 shows the molar concentration of HCl profiles on those seven lines (seen in Fig. 1) above the flat substrate, the tilted substrate and the substrate in the rib reactor. The behavior of HCl gas produced and the concentration of this gas are very important for discussing the details of the CVD processes [47]. It can be seen that the average HCl molar faction at the tilted substrate and at the substrate in the rib reactor are approximately 2.07 and 2.06 times that at the flat substrate. There is some discrepancy with Habuka’s conclusion [47] that the concentration of HCl gas produced in the reactor increases in proportion to silicon growth rate.
3.5 Adverse role of HCl
The negative effect of HCl gas inducing the silicon etching must be considered. The etching rate at each temperature increasing with the hydrogen chloride concentration was observed [48]. So the immediate diffusion out of HCl gas produced from the species boundary layer is favorable to the deposition progress. It can be observed that the concentration of HCl gas at the substrate with additional rib is almost equal to that at the tilted substrate, even a little higher. But the reverse trend was observed between the deposition rate and the concentration of HCl gas at the two last lines (.. f, g lines seen in Fig. 8). Though the molar concentration of HCl gas at the substrate in the rib reactor increases slightly, the differential concentration of HCl gas decreases rapidly after d line as shown in Fig. 8. The diffusing rate of HCl gas would reduce, and the silicon etching rate increases, which reduce the deposition rate at the tail section of the substrate, especially on the substrate in the rib reactor.
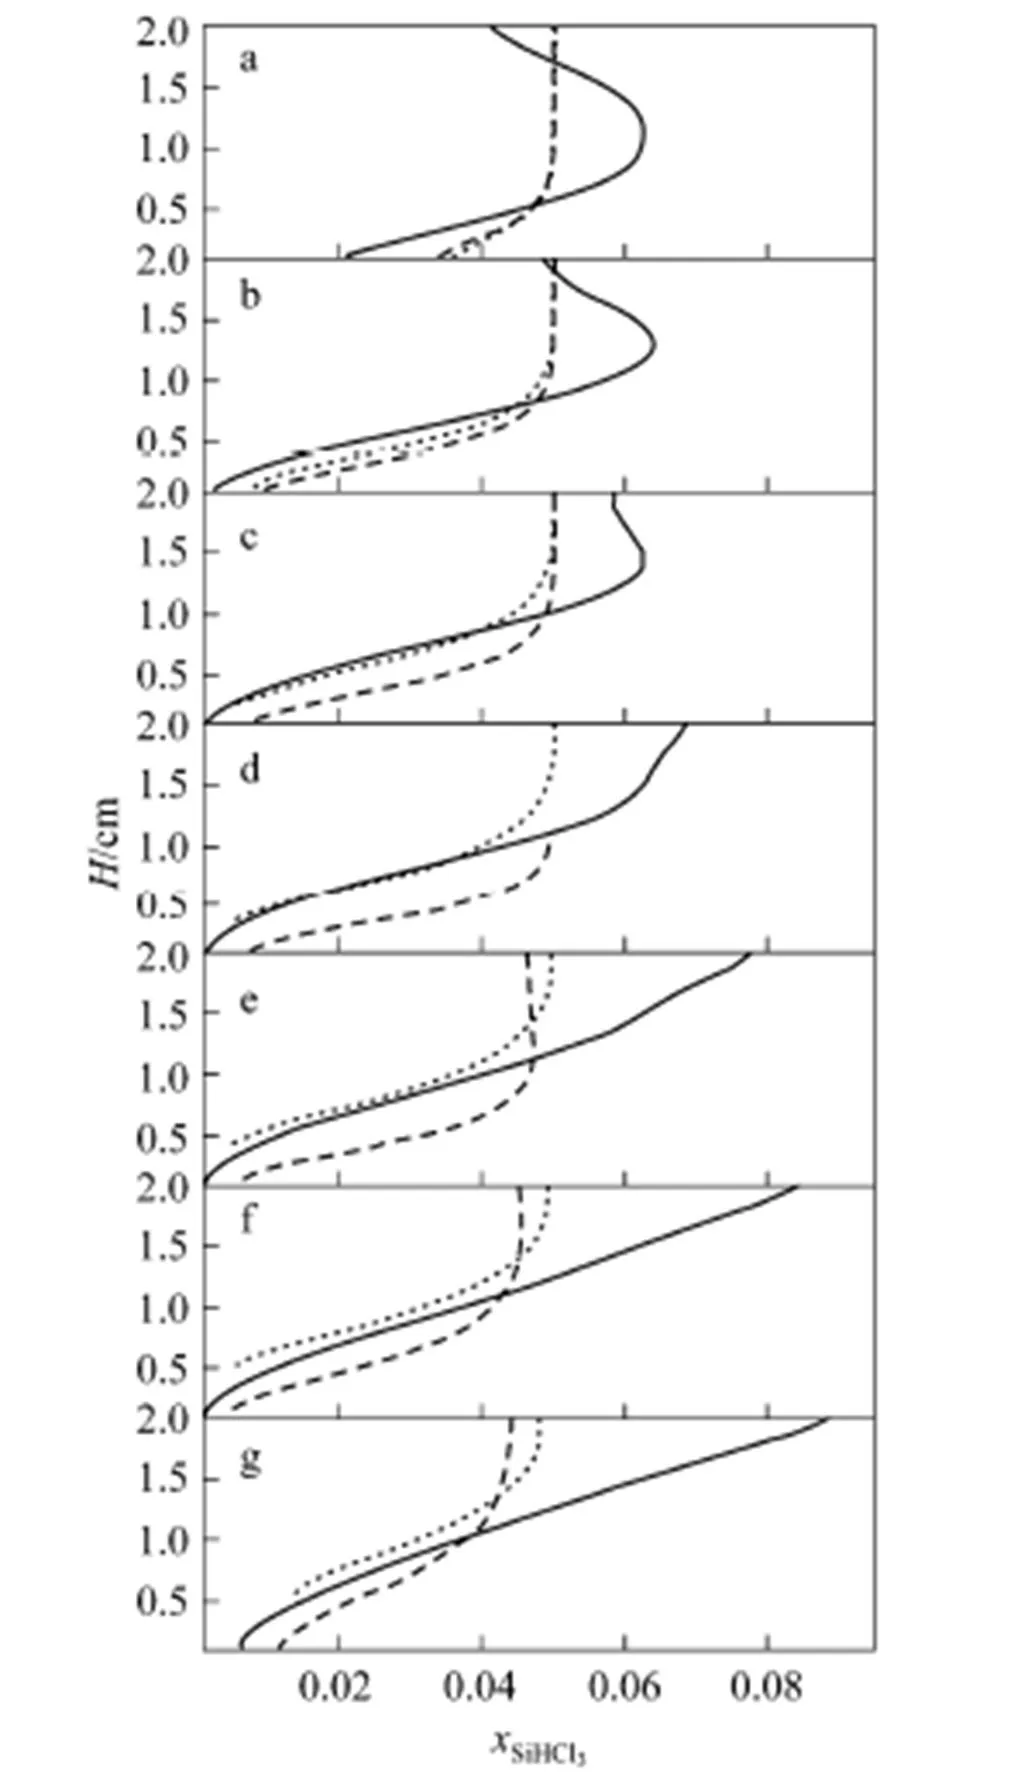
Figure 7 Profiles of concentration of TCS above the substrate for different lines

Figure 8 Profiles of concentration of HCl above the substrate for different lines
Now, it can be concluded that the great difference between the deposition rates in the three reactors resulted from the combined effect of the momentum, thermal and mass transfer. The deposition rate decreases with increasing the momentum, thermal and mass boundary layer thickness. The mean concentrations of TCS at the substrate tilting and at the substrate with rib are 3.82, 4.18 times that at the flat substrate, respectively, which also reflect qualitatively the deposition rate. At the middle of the substrates, though the difference between the concentration of TCS at the substrate tilting and at the substrate with rib is only less than 20.2%, the boundary layer thickness of TCS at the substrate with rib is less 50% than that at the substrate tilting, which may be explained that there is a hump of the deposition rate at the substrate with rib. The boundary layer thickness of TCS at tail section in rib reactor is thicker (up to 22.2%) than that in tilted reactor, which may cause that the deposition rates at tail section in rib reactor is less (up to 10.8%) than corresponding values in the tilted reactor.

Figure 9 Variation of SiHCl3boundary layer thickness on the three substrates
□ flat reactor;△ tilted reactor;☆ rib reactor
4 CONCLUSIONS
A two-dimensional model with gas phase and surface reactions is used to study the effects of momentum, thermal and species boundary layer on the polycrystalline silicon deposition characteristics in the TCS-H2system in three reactors of different geometry. The model validation based on the experimental and numerical data in the open literature was satisfactory. Our numerical simulations show that the momentum boundary layer has significant impact on the thermal boundary layer characteristics. Thermal boundary layer thickness can reflect qualitatively the deposition rate. The concentration of TCS gas at the substrate should maintain a relatively higher value in a good CVD reactor. After the formation of polycrystalline silicon, the HCl gas should be removed from the surface of the substrate immediately; otherwise, the deposition rate would be reduced.
NOMENCLATURE
pre-exponential factor
energy per mass gas, J·kg-1
aactivation energy, J·mol-1
Fmass force, N
gravity acceleration, m·s-2
distance from the substrate, cm
rib height, m
effeffective thermal conductivity coefficient
distance along the substrate, m
static pressure, Pa
gas constant, 8.314 J·mol-1·K-1
Rnet rate of production of the species
deposition rate, μm·min-1
Sthe heat of chemical reaction, J
S the rate of creation by addition from the dispersed phase
gas temperature, K
ssubstrate temperature, K
gas velocity, m·s-1
rib width, m
coordinate, m
HClmole fraction of HCl gas
Ythe mass concentration of the species
tilted angle
temperature exponent
density, kg·m-3
free surface site
τstresses tensor, Pa
1 Moffat, H., Jensen, K., “Three-dimensional flow effects in silicon CVD in horizontal reactors”,..., 135, 459-466 (1988).
2 Vanka, S., Luo, G., Glumac, N., “Parametric effects on thin film growth and uniformity in an atmospheric pressure impinging jet CVD reactor”,.., 267, 22-34 (2004).
3 Oh, I., Takoudis, C., Neudeck, G., “Mathematical modeling of epitaxial silicon growth in pancake Chemical Vapor Deposition reactors”,..., 138, 554-562 (1991).
4 Kuwana, K., Andrews, R., Grulke, E.A., Saito, K., “CFD analysis on a vortex enhanced CVD reactor design”, in Symposium on Making Functional Materials with Nanotubes held at the 2001 MRS Fall Meeting, P. Bernier, P. Ajayan, Y. Iwasa, P. Nikolaev, eds, Materials Research Society, Boston, MA, 61-66 (2001).
5 Wang, A.Y., Lee, K., Sun, C., Wen, L.S., “Simulations of the dependence of gas physical parameters on deposition variables during HFCVD diamond films”,...., 22, 599-604 (2006).
6 Luo, G., Vanka, S.P., Glumac, N., “Fluid flow and transport processes in a large area atmospheric pressure stagnation flow CVD reactor for deposition of thin films”,.., 47, 4979-4994 (2004).
7 Oda, A., Suda, Y., Okita, A., “Numerical analysis of pressure dependence on carbon nanotube growth in CH4/H2plasmas”,, 516, 6570-6574 (2007).
8 Leakeas, C.L., Sharif, M.A.R., “Effects of thermal diffusion and substrate temperature on silicon deposition in an impinging-jet CVD reactor”,.., 44, 127-147 (2003).
9 Zhuang, Q., Guo, H., Heberlein, J., Pfender, E., “Effect of substrate temperature distribution on thermal plasma jet CVD of diamond”,.., 3, 319-324 (1994).
10 Xu, Q., Baciou, L., Sebban, P., Gunner, M., “Exploring the energy landscape for Q(A)(-) to Q(B) electron transfer in bacterial photosynthetic reaction centers: Effect of substrate position and tail length on the conformational gating step”,, 41, 10021-10025 (2002).
11 Sharifi, Y., Achenie, L.E.K., “Effect of substrate geometry on the deposition rate in chemical vapor deposition”,.., 304, 520-525 (2007).
12 Cheng, T.S., Hsiao, M.C., “Numerical investigations of geometric effects on flow and thermal fields in a horizontal CVD reactor”,.., 310, 3097-3106 (2008).
13 Asmann, M., Borges, C., Heberlein, J., Pfender, E., “The effects of substrate rotation on thermal plasma chemical vapor deposition of diamond”,..., 142, 724-732 (2000).
14 Salinger, A.G., Pawlowski, R.P., Shadid, J.N., van Bloemen Waanders, B.G., “Computational analysis and optimization of a chemical vapor deposition reactor with large-scale computing”,...., 43, 4612-4623 (2004).
15 Kunz, T., Burkert, I., Auer, R., Lovtsus, A.A., Talalaev, R.A., Makarov, Y.N., “Convection-assisted chemical vapor deposition (CoCVD) of silicon on large-area substrates”,.., 310, 1112-1117 (2008).
16 Kleijn, C., Dorsman, R., Kuijlaars, K., Okkerse, M., van Santen, H., “Multi-scale modeling of chemical vapor deposition processes for thin film technology”,. Cryst.,303, 362-380 (2006).
17 Pierson, H., Handbook of Chemical Vapor Deposition: Principles, Technology, and Applications, Noyes Publications, NY, USA, 32-43 (1999).
18 Yang, Y., Zhang, W., “Kinetic and microstructure of SiC deposited from SiCl4-CH4-H2”,...., 17, 419-426 (2009).
19 Coltrin, M., Kee, R., Evans, G., “A mathematical model of the fluid mechanics and gas-phase chemistry in a rotating disk chemical vapor deposition reactor”,..., 136, 819-829 (1989).
20 Arora, R., Pollard, R., “A mathematical model for chemical vapor deposition processes influenced by surface reaction kinetics: Application to low-pressure deposition of tungsten”,..., 138, 1523-1537 (1991).
21 Tanimoto, S., Matsui, M., Kamisako, K., Kuroiwa, K., Tarui, Y., “Investigation on leakage current reduction of photo-CVD tantalum oxide films accomplished by active oxygen annealing”,..., 139, 320-328 (1992).
22 Kommu, S., Khomami, B., “High-volume single-wafer reactors for silicon epitaxy”,..., 41, 732-743 (2002).
23 Kleijn, C., “Computational modeling of transport phenomena and detailed chemistry in chemical vapor deposition—A benchmark solution”,, 365, 294-306 (2000).
24 Habuka, H., Nagoya, T., Mayusumi, M., Katayama, M., Shimada, M., Okuyama, K., “Model on transport phenomena and epitaxial growth of silicon thin film in SiHCl3-H2system under atmospheric pressure”,.., 169, 61-72 (1996).
25 Yang, S., Yang, Q., Sun, Z., “Nucleation and growth of diamond on titanium silicon carbide by microwave plasma-enhanced chemical vapor deposition”,.., 294, 452-458 (2006).
26 Mills, R., Sankar, J., Voigt, A., He, J., Ray, P., Dhandapani, B., “Role of atomic hydrogen density and energy in low power chemical vapor deposition synthesis of diamond films”,, 478, 77-90 (2005).
27 Zhang, X.D., Zhang, F.R., Amanatides, E., Mataras, D., Zhao, Y., “Effect of substrate bias on the plasma enhanced chemical vapor deposition of microcrystalline silicon thin films”,, 516, 6912-6918 (2008).
28 Ho, P., Balakrishna, A., Chacin, J., Thilderkvist, A., Haas, B., Comita, P., “Chemical kinetics for modelling silicon epitaxy from chlorosilanes”, In: 194th Meeting of the Electrochemical Society, The Electrochemical Society, Inc., New Jersey, 117-122 (1998).
29 Valente, G., Cavallotti, C., Masi, M., Carr, S., “Reduced order model for the CVD of epitaxial silicon from silane and chlorosilanes”,.., 230, 247-257 (2001).
30 Balakrishna, A., Chacin, J.M., Comita, P.B., Haas, B., Ho, P., Thilderkvist, A., “Chemical kinetics for modeling silicon epitaxy from chlorosilanes”, in 194th Meeting of the Electrochemical Society, US DOE, MA,1-6 (1998).
31 Endo, H., Kuwana, K., Saito, K., Qian, D., Andrews, R., Grulke, E., “CFD prediction of carbon nanotube production rate in a CVD reactor”,..., 387, 307-311 (2004).
32 Khanafer, K., Lightstone, M., “Computational modeling of transport phenomena in chemical vapor deposition”,., 41, 483-494 (2005).
33 van Santen, H., Kleijn, C., van Den Akker, H., “On turbulent flows in cold-wall CVD reactors”,.., 212, 299-310 (2000).
34 Coltrin, M., Kee, R., Miller, J., “A mathematical model of silicon chemical vapor deposition”,..., 133, 1206-1210 (1986).
35 Verwer, J., Sommeijer, B., Hundsdorfer, W., “RKC time-stepping for advection-diffusion-reaction problems”,..., 201, 61-79 (2004).
36 Pope, S., “Computationally efficient implementation of combustion chemistry usingadaptive tabulation”,., 1, 41-63 (1997).
37 Yu, M., Lin, J., Chan, T., “Numerical simulation of nanoparticle synthesis in diffusion flame reactor”,., 181, 9-20 (2008).
38 Kee, R., Rupley, F.M., Meeks, E., Miller, J.A., “Chemkin-III: A fortran chemical kinetics package for the analysis of gas-phase chemical and plasma kinetics”, Technical Report SAND96- 8216, Sandia National Laboratories, Albuquerque, NM (1996).
39 Cai, D., Zheng, L., Wan, Y., Hariharan, A., Chandra, M., “Numerical and experimental study of polysilicon deposition on silicon tubes”,.., 250, 41-49 (2003).
40 Cheng, T., Hsiao, M., “Computation of three-dimensional flow and thermal fields in a model horizontal chemical vapor deposition reactor”,.., 293, 475-484 (2006).
41 del Coso, G., del Canizo, C., Luque, A., “Chemical vapor deposition model of polysilicon in a trichlorosilane and hydrogen system”,..., 155, D485-D491 (2008).
42 Zhang, P., Wang, W.W., Chen, G.H., Li, J.L., “Study on the chemical vapor deposition of polycrystalline silicon in a trichlorosilane and hydrogen system”,.., 39, 495-499 (2010).
43 Salinger, A., Shadid, J., Hutchinson, S., Hennigan, G., Devine, K., Moffat, H., “Analysis of gallium arsenide deposition in a horizontal CVD reactor using massively parallel computations”,., 203, 516-533 (1999).
44 Park, K., Pak, H., “Characteristics of three-dimensional flow, heat, and mass transfer in a chemical vapor deposition reactor”,.., 37, 407-423 (2000).
45 De, A.K., Muralidhar, K., Eswaran, V., Wadhawan, V., “Modelling of transport phenomena in a low-pressure CVD reactor”,.., 267, 598-612 (2004).
46 Terai, F., Kobayashi, H., Katsui, S., Tamaoki, N., Nagatomo, T., Homma, T., “High-speed rotating-disk chemical vapor deposition process for-arsenic-doped polycrystalline silicon films”, Japanese Journal of Applied Physics Part 1—Regular Papers Short Notes & Review Papers, 44, 7883-7888 (2005).
47 Habuka, H., Aoyama, Y., Akiyama, S., Otsuka, T., Qu, W.F., Shimada, M., Okuyama, K., “Chemical process of silicon epitaxial growth in a SiHCl3-H2system”,.., 207, 77-86 (1999).
48 Habuka, H., Suzuki, T., Yamamoto, S., Nakamura, A., Takeuchi, T., Aihara, M., “Dominant rate process of silicon surface etching by hydrogen chloride gas”,, 489, 104-110 (2005).
2010-06-11,
2010-11-16.
the Natural Science Foundation of Shandong Province of China (ZR2009BM011), and the Doctor Foundation of Shandong Province of China (BS2010NJ005).
** To whom correspondence should be addressed. E-mail: jlong_li@hotmail.com
杂志排行

Chinese Journal of Chemical Engineering的其它文章
- Dynamic Simulation and Analysis of Industrial Purified TerephthalicAcid Solvent Dehydration Process*
- Preparation of p-Hydroxybenzaldehyde by Hydrolysis of DiazoniumSalts Using Rotating Packed Bed*
- Liquid-solid Equilibria in Quinary System Na+, K+, Mg2+//Cl-, at 25 °C*
- Pervaporation Separation of Butanol-Water Mixtures UsingPolydimethylsiloxane/Ceramic Composite Membrane*
- Reaction Kinetics of Biodiesel Synthesis from Waste Oil Using a Carbon-based Solid Acid Catalyst
- Enzyme-catalyzed Synthesis of Vitamin E Succinate Using aChemically Modified Novozym-435*